Google Analytics 4 is powerful. It is also confusing, cluttered, and full of data that most Shopify store owners do not know how to interpret. You log in, see 47 different reports, click around for ten minutes, and leave feeling less informed than when you started. If that sounds like your GA4 experience, you are not alone.
What’s in This Article
The problem is not GA4 itself — it is that nobody taught you which reports actually matter for an ecommerce business. Most GA4 guides are written by analytics nerds for analytics nerds. They cover every feature without telling you which ones you should actually use to make better decisions about your Shopify store.
Here is the truth: you need about 5 GA4 reports to run your Shopify store effectively. Master these five, check them weekly, and you will have better insight into your business than 90% of store owners who have never even set up their analytics properly.
First: Make Sure Your GA4 Is Actually Set Up Correctly
Before you look at any reports, you need to verify that GA4 is tracking your Shopify store correctly. A shocking number of stores have broken or incomplete GA4 setups, which means the data they are looking at is wrong — and making decisions on wrong data is worse than making no decisions at all.
Check enhanced ecommerce tracking. GA4 should be capturing these key ecommerce events: view_item (product page views), add_to_cart, begin_checkout, purchase, and view_item_list (collection page views). Go to Admin > Events and verify all five are showing data. If they are not, your Shopify-GA4 integration needs fixing — either through Shopify’s built-in Google channel or through Google Tag Manager.
Verify purchase revenue matches Shopify. Compare GA4 purchase revenue to your Shopify revenue for the same period. They will never match exactly (GA4 uses session-based attribution while Shopify uses order data), but they should be within 10-15% of each other. If GA4 is showing 50% less revenue than Shopify, your purchase event tracking is broken.
Set up Google Signals and data retention. In Admin > Data Settings, enable Google Signals for cross-device tracking and set data retention to 14 months (the maximum). These two settings are off by default and significantly improve the quality of your data and your ability to analyse trends over time.
Report 1: Traffic Acquisition — Where Your Visitors Come From
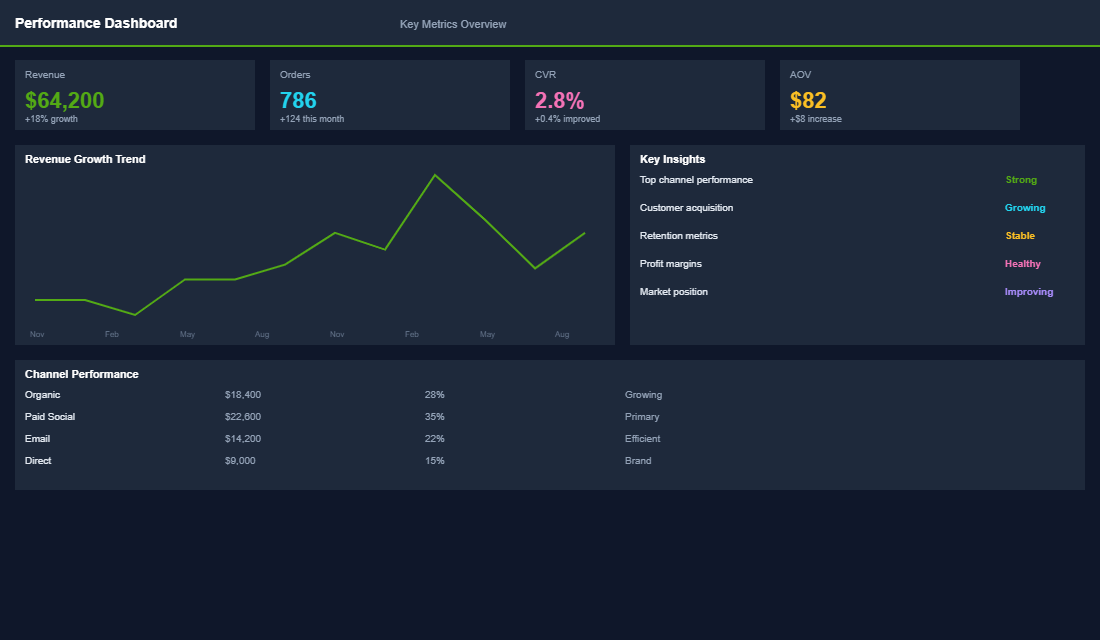
Navigate to Reports > Acquisition > Traffic Acquisition. This report tells you where your visitors come from and how each channel performs. It is the first report you should check every week because it tells you whether your marketing is working.
What to look at: Focus on the “Session default channel group” dimension. This groups your traffic into channels: Organic Search, Paid Search, Paid Social, Email, Direct, Referral, and Organic Social. For each channel, look at three metrics: sessions (volume), engagement rate (quality), and conversions (results).
What to act on: If a channel is driving high traffic but low engagement rate (below 40%), the traffic quality is poor — your targeting or messaging needs work. If a channel has high engagement but low conversions, the traffic is good but your website is not converting it — look at your product pages and checkout. If a channel is driving conversions efficiently, increase investment.
Pro tip: Add a secondary dimension of “Session source/medium” to drill into specific sources within each channel. For example, within Paid Social, you might see facebook/cpc vs instagram/cpc — showing you which platform is performing better.
Report 2: Landing Page Performance — Your First Impressions
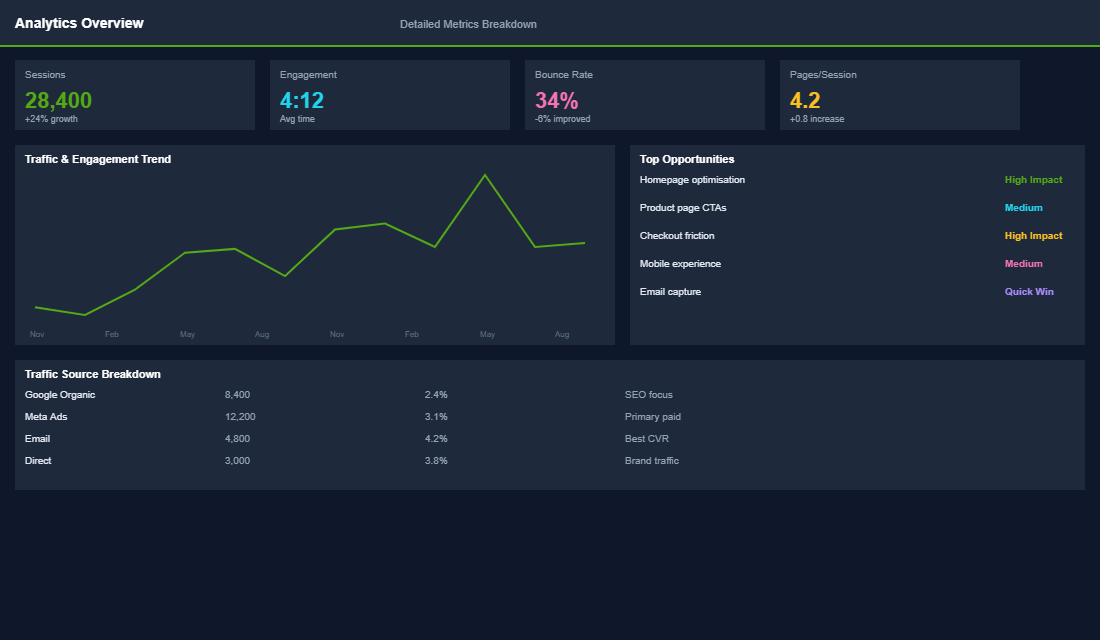
Navigate to Reports > Engagement > Landing Page. This shows you which pages visitors land on first and how each page performs at keeping visitors engaged and driving conversions.
What to look at: Sort by sessions to see your most-visited landing pages. For each page, check engagement rate, average engagement time per session, and conversion rate. Your homepage, top collection pages, and top product pages should dominate this list.
What to act on: Pages with high traffic but below-average engagement rates need optimisation. If your homepage has a 35% engagement rate but your best collection page has 65%, your homepage is leaking visitors. Similarly, product pages with high traffic but zero conversions need attention — the traffic is there but the page is not persuading people to buy.
Report 3: Ecommerce Purchases — What People Actually Buy
Navigate to Reports > Monetisation > Ecommerce Purchases. This report shows your product-level performance — what is selling, how often, and at what revenue.
What to look at: Focus on item name, items viewed, items added to cart, items purchased, and item revenue. The key metric is the view-to-purchase rate: what percentage of product page views convert to purchases. A healthy rate is 2-5% for most Shopify categories.
What to act on: Products with high views but low add-to-cart rates need better product pages (photos, descriptions, reviews, pricing). Products with high add-to-cart but low purchase rates have a checkout or pricing friction problem. Products with consistently high conversion rates should be featured more prominently — in collections, in ads, and on your homepage.
Report 4: Funnel Exploration — Where You Lose Customers
Navigate to Explore > Funnel Exploration. This is a custom report you need to set up, but it is the most powerful ecommerce report in GA4. It shows you exactly where customers drop off in your purchase journey.
How to set it up: Create a new funnel exploration with these steps: session_start > view_item > add_to_cart > begin_checkout > purchase. GA4 will show you the conversion and drop-off rate at each step. Most Shopify stores see the biggest drop-off between view_item and add_to_cart (70-85% drop-off) and between begin_checkout and purchase (30-50% drop-off).
What to act on: Focus on the step with the highest drop-off percentage — that is where you will get the most improvement for your effort. If 80% of product page visitors leave without adding to cart, your product pages need work. If 40% of checkout starters abandon, your checkout process has friction that needs smoothing.
Report 5: User Attributes — Who Your Customers Are
Navigate to Reports > User > User Attributes > Overview. This report shows you demographic and geographic data about your visitors and customers, which is essential for targeting your marketing effectively.
What to look at: Check the geographic breakdown (are most visitors in your target market?), device split (mobile vs desktop conversion rates), and if available, age and gender breakdowns. Cross-reference this with your customer assumptions — you might be surprised.
What to act on: If 75% of your traffic is mobile but your mobile conversion rate is half your desktop rate, you have a mobile experience problem. If most of your converting customers are in a demographic you are not targeting in ads, you might be wasting ad spend on the wrong audience. Use this data to validate and refine your marketing targeting.
Your Weekly Analytics Routine
- Monday morning, 15 minutes. Check Traffic Acquisition for the previous week. Note any channels that are up or down significantly. Look at Landing Page performance for your top 10 pages. Flag any pages with declining engagement rates.
- Check Ecommerce Purchases. Review your top products by conversion rate and revenue. Identify any products that need attention (high views, low conversion).
- Monthly deep dive, 30 minutes. Run the Funnel Exploration to check drop-off rates at each stage. Compare this month to last month. Review User Attributes to confirm your audience assumptions. Set one specific optimisation goal based on the data.
Analytics Is Decision-Making Fuel
GA4 is not about collecting data — it is about making better decisions faster. These five reports give you everything you need to understand where your traffic comes from, how your pages perform, what products are converting, where you lose customers, and who your audience actually is. Master them and you will stop guessing and start knowing.
Inside the eCommerce Circle, analytics mastery is part of our Performance pillar. We help every member set up GA4 correctly, build custom dashboards, and develop a weekly analytics routine that drives smarter decisions. If GA4 still feels overwhelming and you want someone to walk you through exactly what to look at and why, that is what our coaching is for.