Most Shopify owners are still making seven-figure decisions based on a number their ad platforms made up.
What’s in This Article
Meta says you did 8x ROAS. Google says you did 6x ROAS. TikTok claims another 4x. Add it up and your “attributed” revenue is somehow twice what your Shopify dashboard actually shows. Then you wonder why your bank balance is going down while your ROAS reports look like a celebration.
This is the attribution problem. Every platform takes credit for every conversion it touched, even when three platforms touched the same customer. After iOS 14, that overlap got worse — around 75 to 85% of iOS users opted out of tracking, so platforms started filling the gaps with modelled conversions, view-through windows, and increasingly creative maths.
The brands that scale past $1M cleanly don’t fight that fight anymore. They’ve moved to a single number that ignores attribution entirely. It’s called the Marketing Efficiency Ratio, or MER, and it’s the closest thing Shopify owners have to a financial truth serum.
What MER Actually Is (and Why ROAS Stopped Working)
MER is brutally simple:
MER = Total Revenue ÷ Total Marketing Spend
That’s it. You take every dollar that hit your Shopify checkout for the month and divide it by every dollar you spent on marketing — Meta, Google, TikTok, email tools, influencer fees, agency retainers, content production, the lot. No attribution windows. No platform-claimed conversions. No “view-through” credit. Just real revenue divided by real spend.
If you spent $50,000 on marketing in March and Shopify shows $250,000 in sales, your MER is 5.0. That means every $1 of marketing brought back $5 of revenue. Done.
ROAS, by contrast, is a channel-specific metric your ad platforms calculate using their own attribution rules. Meta uses a 7-day click, 1-day view window. Google uses data-driven attribution. Klaviyo claims revenue from anyone who opened an email in the past 5 days. Each platform measures honestly inside its own walls — but those walls overlap, double-count, and miss organic, branded, and word-of-mouth revenue entirely.
The result: most Shopify brands have a “platform-attributed ROAS” that’s 30 to 60% inflated versus what the bank account actually shows. MER closes that gap by zooming out to the only number that matters — what the business actually made.
The MER Benchmark Most Brands Are Aiming Wrong At
Across the DTC ecosystem, the median MER for brands tracked through Triple Whale sits around 4.1 (or 41%, depending on how you express it). The healthy band most established Shopify brands target is 3.0 to 5.0 — meaning $3 to $5 of revenue for every $1 spent on marketing.
But here’s where most owners get it wrong: they assume higher is always better.
An MER of 10x or higher usually means one of two things. Either you’re severely under-spending on marketing and leaving growth on the table, or your business is so reliant on organic and repeat purchases that one bad month of email deliverability could halve your revenue. Neither is sustainable.
The right MER target depends on three things:
- Your contribution margin. A brand running 65% gross margin can run a much lower MER profitably than a brand on 35%. If you don’t know your real contribution margin, you can’t pick a target MER that actually pays the bills.
- Your stage of growth. A $300K/year brand should sit at 4.0 to 5.0. A $3M brand pushing growth might intentionally drop to 2.5 to 3.0 to reinvest into customer acquisition. A $20M brand running on retention might see 6.0+.
- Your customer lifetime value. Brands with subscription products or high repeat rates can run skinnier MERs because the second and third orders bring the long-term math home. If your customer lifetime value is healthy, you can afford to “lose” money on first order acquisition.
The Australian brands we coach who are scaling cleanly typically run an MER between 3.5 and 4.5 during steady-state, dropping to 2.8 to 3.2 during aggressive launch periods, and climbing to 5.0+ during retention-led months like February or August.
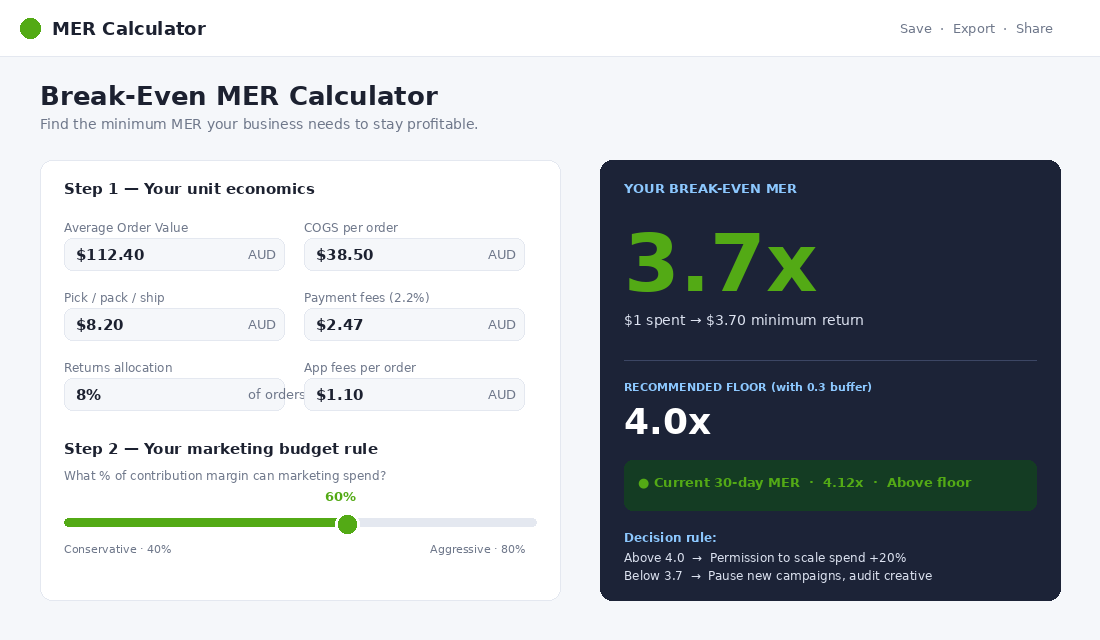
How to Calculate Your Break-Even MER (The Number That Actually Matters)
Targeting “an MER of 4” sounds smart until you realise different businesses break even at completely different MER levels. A skincare brand with 70% margins breaks even around 1.5x. A furniture brand with 25% margins needs to hit 4.0x just to pay the rent.
Here’s the calculation every Shopify owner should run before setting a marketing budget:
- Step 1: Calculate your true contribution margin per order. Take your AOV and subtract COGS, payment fees (around 2.2% on Shopify Payments in Australia), pick-pack-ship cost, returns allocation (typically 5 to 12% of orders), and any per-order app fees. The leftover is what’s available for marketing and overhead.
- Step 2: Decide what % of contribution margin you want to spend on marketing. A brand prioritising profit might cap marketing at 40% of contribution margin. A brand prioritising growth might let marketing eat 70 to 80% short-term.
- Step 3: Convert that to an MER target. If your contribution margin is 45% and you’re willing to spend 60% of it on marketing, your break-even MER is 1 ÷ (0.45 × 0.60) = 3.7. Below that, you’re losing money. Above that, you’re profitable.
- Step 4: Set your real-world MER floor 0.3 above that. Build in a buffer for the months when something breaks — supplier price hike, returns spike, ad costs run hot. If your math says 3.7, run your business at 4.0.
Run this calculation today. If your current MER is below your break-even MER, you’re scaling toward bankruptcy. If it’s significantly above your floor, you have permission to spend more aggressively to capture growth. Either way, this number gives you a decision rule that doesn’t require an ad platform’s opinion.
The Three MER Numbers to Track Weekly (Not Just Monthly)
Most owners check MER monthly when their bookkeeper tallies up spend. That’s too late. By the time you see April’s MER tank, May is already half over. The brands running tight ships look at three flavours of MER every Monday morning.
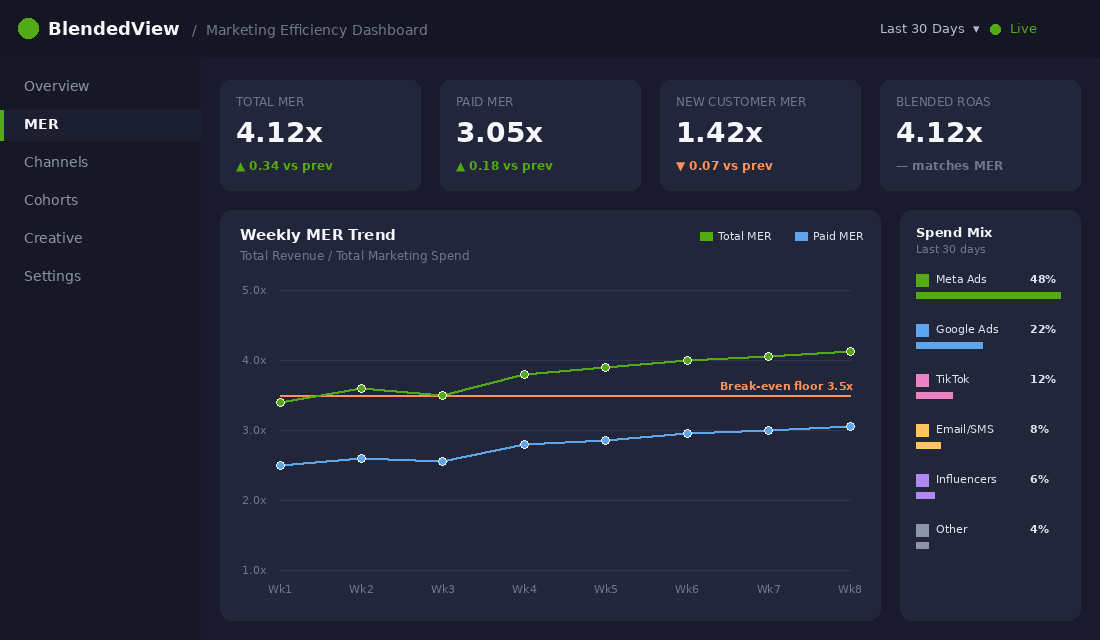
- Total MER. All Shopify revenue ÷ all marketing spend (paid media, email/SMS tools, influencers, agency, content). This is the number your CFO cares about. It tells you if the business is buying customers profitably as a whole.
- Paid Media MER (or aMER). Total Shopify revenue ÷ paid ad spend only. This isolates the pull of your acquisition engine. A healthy paid MER for most Aussie Shopify brands sits between 2.5 and 4.5. Below 2, paid media is becoming a tax.
- New Customer MER (or nMER). Revenue from first-time customers only ÷ paid ad spend. This is the harshest number — and the most useful. If your new-customer MER is below 1.0, you’re losing money on every new customer and betting the business on retention bringing them back.
nMER is the number that separates the brands quietly stacking cash from the ones that look successful on paper but can’t actually pay themselves. It strips out repeat-purchase revenue and forces you to confront whether your acquisition is genuinely paying for itself.
For most Aussie brands targeting profitable growth, the working benchmarks are: total MER 3.5+, paid MER 2.5+, nMER 1.0+. Hit all three and you’re scaling cleanly. Miss any one and you’ve got a leak to plug before you spend another dollar on ads.
The Tools That Actually Make This Trackable
You don’t need a $500/month attribution platform to track MER. You need a spreadsheet, a routine, and one decision about what counts as “marketing spend.” But if you’re scaling past $1M and the calculations are eating an hour a week, the tooling pays for itself fast.
- Triple Whale (~AUD $190/month and up). The most popular MER tool in DTC. Pulls Shopify, Meta, Google, TikTok, Klaviyo, and more into a single dashboard. Their free starter dashboard tracks MER and aMER without you having to configure anything. Setup takes about 30 minutes.
- Polar Analytics (~AUD $250/month and up). The Triple Whale alternative most agencies use. Slightly cleaner UI, stronger pivot reporting, and a tax-and-fees module that gets contribution margin closer to truth than most.
- Northbeam (~AUD $1,000/month and up). Heavier-duty multi-touch attribution for brands $5M+. Overkill for most Shopify owners but the gold standard once you’re running serious ad spend across 4+ channels.
- Free option: a Google Sheet. Pull Shopify revenue from the dashboard each Monday. Pull spend from your Meta, Google, and TikTok ads managers. Add email tools, influencer payouts, and any retainer fees. Divide. You now have MER. The whole exercise takes 15 minutes a week and is more accurate than any platform-attributed report.
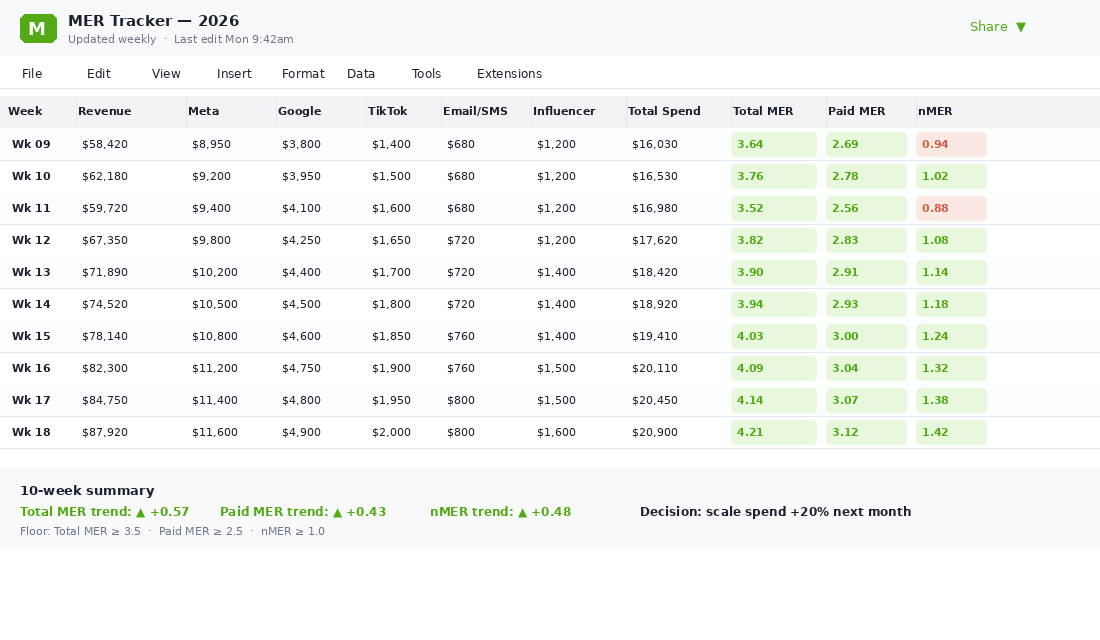
If you’re going the spreadsheet route, here’s the exact setup: create columns for Date, Shopify Gross Revenue, Shopify Net Revenue (after refunds), Meta Spend, Google Spend, TikTok Spend, Other Paid Media, Email/SMS Tools, Influencers/UGC, Agency Retainer, Total Spend, Total MER, Paid MER, and nMER. Update it every Monday using last week’s numbers. Within 8 weeks you’ll have a trend line that’s worth more than any single platform’s attribution report.
How Brands Are Actually Using MER to Make Decisions
The point of MER isn’t to admire it on a dashboard. It’s to use it as the rule that decides whether you spend more, spend less, or change strategy.
Here’s how brands at different stages use MER as a decision tool:
- $300K to $1M brands: Use MER to set a hard ad spend ceiling each month. If MER drops below the floor for 2 weeks straight, pause new campaigns and audit creative, audience, and offer. Don’t let one bad month compound into three.
- $1M to $5M brands: Use MER trend lines to decide when to scale. A 4-week climbing MER means you have permission to push spend 20 to 30% higher. A 4-week declining MER means hold steady or pull back. The number governs the budget, not the gut.
- $5M+ brands: Use MER alongside contribution margin to set channel mix. If paid MER drops while organic MER climbs, shift budget toward content, SEO, or email. If new customer MER drops while total MER stays steady, the acquisition engine is breaking and retention is masking it.
One Sydney-based activewear brand I worked with recently was running a “platform ROAS” of 6.2x and felt like champions. Their actual MER, calculated from Shopify and the bank statement, was 2.4. Once they saw the gap, we re-cut the budget — slashed the bottom 30% of campaigns, doubled down on the top performers, and rebuilt their email flows. Eight weeks later their real MER was 3.7 on the same revenue, and they kept an extra $42K in profit that quarter. Same activity, better decisions, because they were finally measuring the right number.
Why MER Beats Channel ROAS for Forecasting
Channel ROAS tells you what each platform claims it did. MER tells you what your business actually did. The difference matters most when you’re forecasting.
If you build next quarter’s revenue forecast on platform-attributed ROAS, you’re stacking three layers of optimism: each platform overclaiming, your projection assuming yesterday’s ROAS holds, and ad costs creeping 5 to 15% per quarter as auctions get more competitive. By the time the quarter actually plays out, you’re 20 to 40% short of plan and scrambling for cash.
Building forecasts off MER does two things differently. First, it uses your real revenue and real spend, so the input is grounded in reality. Second, it forces you to think about marketing as a system rather than a stack of channels. You don’t ask “how much can Meta deliver?” — you ask “if we hold MER at 3.8 and spend $80K, we’ll do $304K. Does that hit the plan?”
This is also why MER pairs so well with cohort analysis. MER tells you what’s happening at the top of the funnel today; cohort analysis tells you what those customers will do over the next 12 months. Together they give you a complete picture of acquisition efficiency and retention strength — the two engines every Shopify business runs on.
The Compound Effect: Why MER Discipline Changes Everything
Track MER weekly for three months and something quietly powerful happens. You stop arguing with your media buyer about whether a campaign is “working.” You stop being whiplashed by Meta’s ROAS swings. You stop second-guessing whether to spend more or pull back.
Instead, you have a single number that anchors every marketing decision. The MER frames the conversation. “Are we above the floor? Spend more. Are we below it? Find the leak first.” Every meeting gets shorter. Every budget conversation gets cleaner. Every decision gets faster, because the rule is already set.
MER also forces honesty about marketing spend you’ve been hiding from. Most brands forget to count their email tool, their UGC creator fees, their agency retainer, their photographer, their content writer, and their conversion app stack as “marketing spend.” Once you put it all in the MER calculation, you suddenly see the real cost of customer acquisition — and you start making sharper decisions about which costs are pulling their weight.
Pair this discipline with weekly tracking and a clear break-even floor, and you’ve built the foundation for what every successful Shopify brand eventually has: a marketing engine where you can confidently say “we will spend X, generate Y, and clear Z in profit.” That’s not just a marketing skill. That’s how a real business gets run.
Your MER Implementation Checklist
Don’t overthink the start. Here’s what to do this week:
- Pull last 90 days of Shopify revenue. Use the Shopify dashboard, set range to “Last 90 days,” and grab gross sales.
- Add up all marketing spend in that period. Meta, Google, TikTok, Klaviyo or Omnisend, app fees, influencer fees, agency retainers, content costs. Don’t skip the small ones.
- Calculate your current MER. Revenue ÷ spend. Note what it is.
- Calculate your break-even MER. Use the contribution margin formula above. Note what it is.
- Calculate the gap. Are you above the floor or below? By how much?
- Set up a weekly tracker. Either Triple Whale or a Google Sheet. Update it every Monday before 10am.
- Build your monthly MER review into your weekly operating rhythm. First Monday of the month, look at last month’s MER versus break-even, decide whether to scale, hold, or pull back.
- Share it with your team. Your media buyer, your CMO, your CFO if you have one. The number changes the conversation when everyone’s looking at the same scoreboard.
Within 30 days you’ll know more about your marketing economics than 90% of Shopify brands. Within 90 days you’ll have a trend line that lets you forecast revenue and spend with confidence. Within 12 months MER becomes a habit — the first number you check in the morning, the last number you reference before approving a budget.
How to Build Your MER Dashboard in 30 Minutes (Tools, Formulas, and the Daily View)
You do not need a fancy BI stack to track MER properly. Most $1M to $10M Aussie Shopify brands run their MER dashboard in one of three places: Google Sheets, Triple Whale, or Lifetimely. Each one works, and each has a clear sweet spot.
- Google Sheets (free): The fastest way to start. Pipe in Shopify sales via the official Shopify Sheets app or a Supermetrics connector. Add daily ad spend from Meta Ads Manager and Google Ads. Compute total MER, paid MER, and new customer MER in three columns. Refresh daily for 30 days before deciding you need more.
- Triple Whale ($129+/month): Worth the spend once you cross $200k AUD/month and want attribution layered on top. The “Lighthouse” view computes blended MER automatically, alerts you when MER drops below threshold, and shows new vs returning customer revenue side by side.
- Lifetimely ($79+/month): Strongest for cohort and LTV analysis. Pairs MER with payback period, which is the second number most operators ignore. If you do not know your average payback period in days, you cannot scale paid acquisition safely.
Whatever tool you pick, build three views. Daily MER (last 7 days, last 30 days, last 90 days). Weekly trailing MER for trend spotting. And a “spend vs target MER” view that flags when blended MER is drifting below the break-even floor. That third view is the one that prevents 90-day budget blowouts.
The Three MER Traps That Catch Brands in Their First Year of Scale
Once founders understand MER, they tend to fall into one of three traps that quietly erode margin. Watching for these is half the discipline.
Trap 1: Confusing total MER with new customer MER. Total MER includes returning customers and email-driven revenue, which can mask paid acquisition that is actually unprofitable. Imagine you run a skincare brand at 3.0 total MER. Looks healthy. Strip out email and SMS revenue and your paid MER might be 1.7, meaning every new customer dollar is barely covering ads, let alone product cost. Always track both.
Trap 2: Ignoring contribution margin per order. MER tells you nothing about gross margin. A 2.5 MER on a 60% margin product is excellent. A 2.5 MER on a 28% margin product is a slow bleed. Pair your MER dashboard with a contribution margin column in Shopify and the picture becomes obvious. For the upstream half of this equation, our deep dive on Shopify discount discipline shows exactly how to protect margin while still running promotions.
Trap 3: Treating MER as a single weekly number. Brands scaling past $1M need to slice MER by channel (Meta vs Google vs TikTok), by campaign objective (prospecting vs retargeting), and by new customer cohort. A blended weekly MER of 2.8 can hide a Meta prospecting MER of 1.4 that is silently burning $40k a month. Slicing is the difference between confident scaling and praying.
Most operators we work with do not need new tools. They need the discipline of pulling these numbers every Monday morning, before they look at anything else. That single habit changes how you spend, hire, and forecast for the rest of the year.
The Bottom Line
The brands that scale Shopify cleanly aren’t the ones with the best ROAS reports. They’re the ones with the cleanest MER discipline. They’ve stopped letting platforms grade their own homework. They’ve defined their break-even floor. They track total MER, paid MER, and new customer MER every week. And they spend confidently — or pull back fast — based on the only number that doesn’t lie: real revenue divided by real spend.
Inside the eCommerce Circle, this is one of the first numbers we set up with every member. It’s the metric that anchors how they think about scale, how they make budget decisions, and how they decide when to push and when to protect. Once you see your business through MER, you can’t unsee it.
If you’re scaling a Shopify brand and you’re not sure whether your marketing is actually working — or if you suspect your platform-reported ROAS is hiding the real story — let’s talk. Book a free strategy call and we’ll walk through your MER, your break-even floor, and the highest-impact move you can make this quarter to clean up the numbers.