You have read the guides, watched the tutorials, and maybe even taken a course on running Meta Ads. But there is a massive gap between understanding the theory and seeing what a real Shopify brand actually did to scale from $15K to $80K per month in revenue using Meta as their primary acquisition channel.
What’s in This Article
This is the story of an Australian activewear brand — one of our eCommerce Circle members — who went from struggling to break even on ads to running a Meta Ads machine that consistently delivers 4.2x blended ROAS. No tricks, no hacks — just smart structure, disciplined testing, and patience.
The Starting Point: Burning Cash With No Strategy
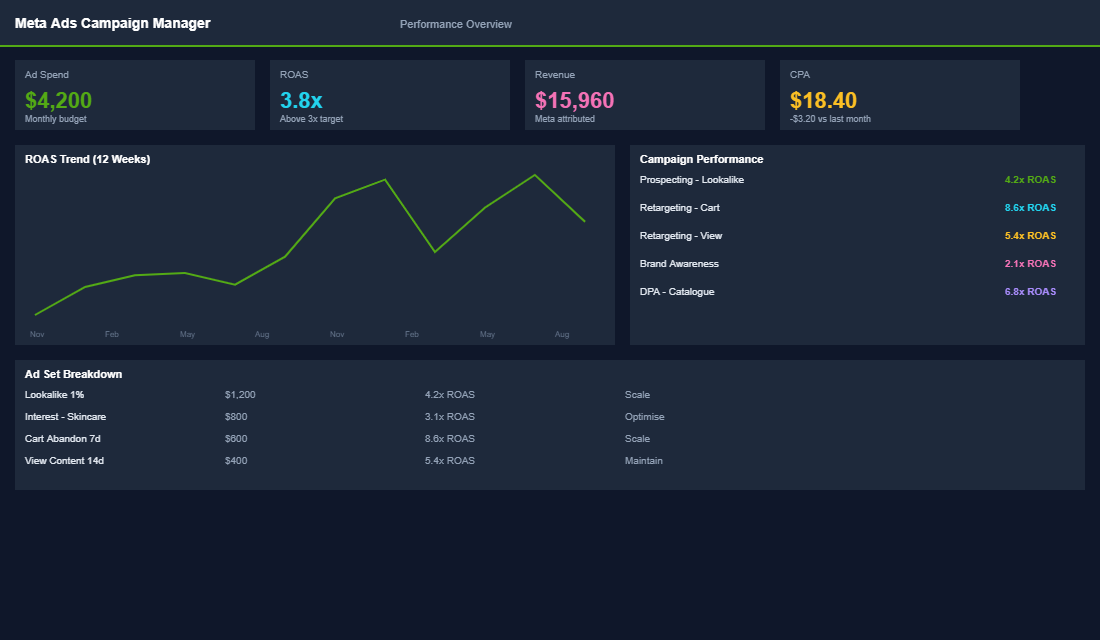
When this brand came to us, they were spending $3,000 per month on Meta Ads and generating about $8,000 in ad-attributed revenue — a 2.7x ROAS that barely covered their costs after product margins, shipping, and overheads. Their blended ROAS (total revenue divided by total ad spend) was even worse at 2.1x because they were counting every sale Meta claimed credit for.
The problems were textbook. One campaign running to a broad audience with a single ad set. Three creatives that had been running for four months without testing. No retargeting strategy beyond the default “website visitors” audience. And zero email flows to convert the traffic Meta was sending.
In short, they were paying to fill a leaky bucket. Meta was driving traffic, but the store was not converting or retaining those visitors. Here is what we changed.
Month 1: Fix the Foundation Before Scaling Spend
Before touching their ad account, we fixed the store. There is no point driving more traffic to a site that does not convert. The changes were straightforward but critical:
- Product page overhaul. Added lifestyle photography alongside the flat-lay product shots. Rewrote product descriptions to focus on benefits rather than features. Added a size guide with real customer measurements. Added a reviews section using Judge.me (they had 340 reviews sitting in their Shopify admin that were not displayed anywhere).
- Checkout optimisation. Enabled Shop Pay and Apple Pay. Added trust badges below the payment form. Removed unnecessary form fields. Set up a free shipping threshold at $120 (their AOV was $95, so this incentivised adding one more item).
- Email flows. Set up five core Klaviyo flows: welcome series, abandoned cart, browse abandonment, post-purchase, and win-back. These flows started generating $2,800/month within the first 30 days — revenue that was previously being left on the table.
Result after month 1: Revenue increased from $15K to $22K without increasing ad spend. The store was simply converting more of the traffic it was already getting.
Month 2-3: Restructure the Ad Account
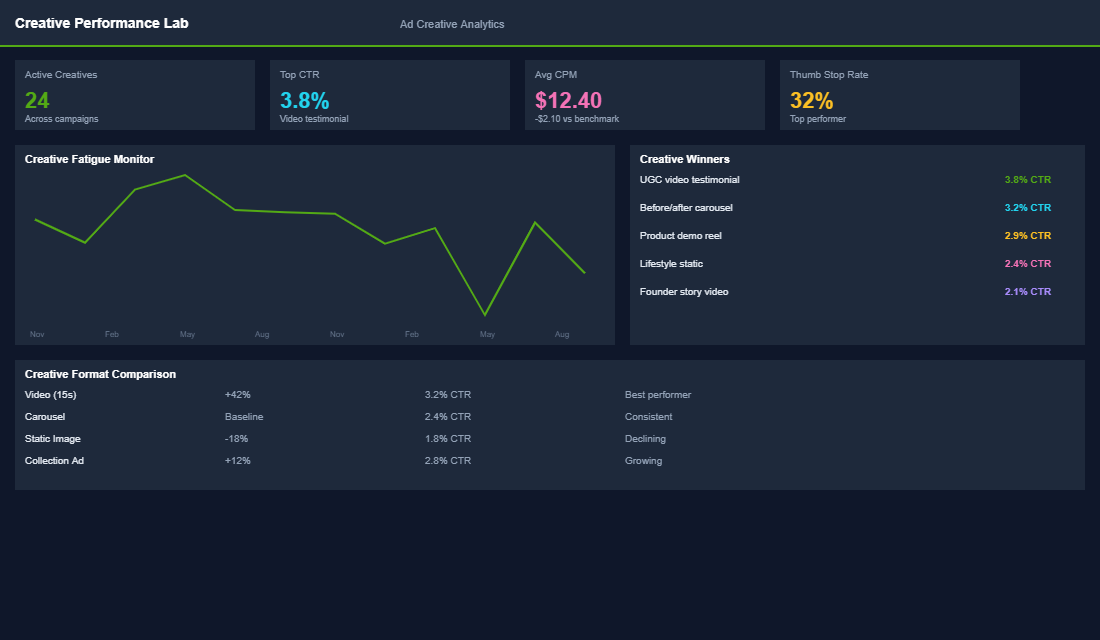
With the store converting properly, we rebuilt the Meta Ads account from scratch using a three-campaign structure:
Campaign 1: Prospecting (60% of budget). Broad targeting (women 25-45, Australia-wide, no interest targeting). This sounds counterintuitive, but Meta’s algorithm in 2025 is remarkably good at finding buyers if you give it a broad audience and good creative. We launched with five ad sets, each containing three creatives — a mix of UGC videos, lifestyle photography, and before/after transformation content.
Campaign 2: Retargeting (25% of budget). Three audience layers: website visitors (7 days), add-to-cart but did not purchase (14 days), and engaged on Instagram/Facebook (30 days). Each audience got different creative — product-specific ads for cart abandoners, social proof ads for website visitors, and brand story ads for social engagers.
Campaign 3: Retention (15% of budget). Targeting existing customers with new product launches, bundle offers, and loyalty incentives. This campaign consistently delivers 8-12x ROAS because these people already trust the brand.
We increased spend gradually — from $3K to $4.5K in month 2, then to $6K in month 3. Each increase was only made after confirming the blended ROAS held above 3.5x.
Month 4-6: Creative Testing Engine
The single biggest shift was systematic creative testing. Most brands create an ad, run it until it dies, then scramble to make a new one. We implemented a weekly testing rhythm:
- Every Monday: Launch 3-4 new ad creatives in the prospecting campaign testing cell.
- Every Friday: Review performance. Any creative with a cost per purchase below the target ($28) and a click-through rate above 1.5% gets promoted to the main prospecting campaign. Everything else gets turned off.
- Every month: Refresh retargeting creatives with new social proof, new UGC, and updated offers.
Over six months, we tested 72 different ad creatives. Only 14 (19%) became profitable “winners.” But those 14 winners collectively generated over $180,000 in revenue. The testing cost for the 58 losers was roughly $4,200 — a tiny investment for the insights and winning ads it produced.
The top-performing creative format was UGC-style video: a real customer showing the product in their daily life, talking about why they love it, with text overlays highlighting the key benefits. These consistently outperformed polished brand videos by 2-3x on cost per acquisition.
The Results: Month 6 Snapshot
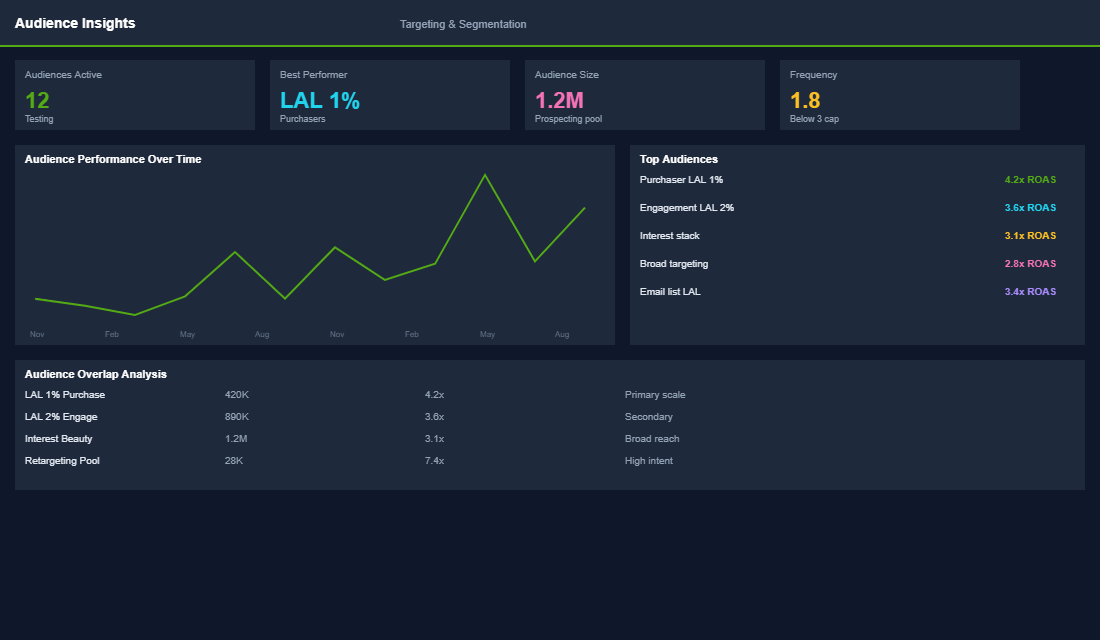
By month six, the numbers told a clear story:
- Monthly revenue: $80,200 (up from $15,000)
- Monthly ad spend: $12,400 (up from $3,000)
- Blended ROAS: 4.2x (up from 2.1x)
- Email revenue: $18,400/month (was $0)
- Average order value: $118 (up from $95)
- Conversion rate: 3.4% (up from 1.8%)
The revenue increase was not just from more ad spend. It was from a compounding effect: better creatives drove cheaper traffic, better product pages converted more of that traffic, email flows captured revenue from non-buyers, and the free shipping threshold increased AOV. Each improvement amplified the others.
The Three Lessons Every Shopify Brand Should Take Away
Lesson 1: Fix the store before scaling ads. No amount of ad spend can compensate for a store that does not convert. This brand increased revenue by 47% in month one without spending an extra dollar on ads — just by improving the on-site experience and adding email flows.
Lesson 2: Creative is the new targeting. In 2025, Meta’s algorithm handles targeting better than any manual audience setup. Your job is to feed it great creative. The brands that test 3-4 new creatives per week consistently outperform those that run the same ads for months.
Lesson 3: Scale gradually and watch blended ROAS. This brand increased ad spend by 313% over six months, but they did it in controlled increments — never increasing more than 30% per month, and only when blended ROAS confirmed the spend was efficient.
The Exact Account Structure They Ran
Vague case studies are useless. Here is the account they ended up with at $80k a month, so you can hold it against your own.
Three campaigns. Not eleven. One prospecting campaign, one retargeting campaign, one retention and lapsed-customer campaign. Every time we audit an underperforming account, the same pattern shows up: 8 to 15 live campaigns, each starved of data, none of them ever exiting the learning phase. Meta needs roughly 50 conversions per ad set per week to optimise properly. Split $20k of spend across 14 ad sets and not one of them gets there.
Prospecting: broad, with two ad sets maximum. They ran one broad ad set (no interest stacking, age 25-54, Australia) and one lookalike ad set built on a 180-day purchaser seed. That was it. Broad took roughly 70% of prospecting budget. Their broad ad set consistently beat every interest-based audience they had been running before, which surprised the founder and surprises most founders.
Retargeting: three windows, decreasing spend. 0-7 day site visitors and add-to-carts took the bulk of retargeting budget, 8-30 days took a third, 31-90 days ran at a maintenance level with a stronger offer. Retargeting never exceeded 20 to 25% of total spend. If retargeting is eating more than a third of your budget, you do not have a scaling problem, you have a traffic problem.
Budgets at campaign level, not ad set level. They moved to campaign budget optimisation in month three and stopped hand-feeding individual ad sets. Combined with a rule of never increasing a campaign budget by more than 20 to 30% in any 72-hour window, this kept the account out of repeated learning resets. If you want the full structure written out, our guide to building a Meta Ads campaign structure that scales past $50k a month covers the version we hand to members.
The Creative Testing Engine, Week by Week
Creative was the actual growth lever, so it is worth being precise about the cadence rather than saying “test more”.
Every Monday, four new creatives went live in a dedicated testing ad set with a fixed $150 AUD daily budget, separate from the scaling campaigns. Each creative got 3 to 5 days and roughly $500 to $700 in spend before a decision. Anything that beat the account’s rolling 30-day cost per acquisition by 15% or more graduated into the main prospecting campaign. Everything else was killed without sentiment on Friday.
Four a week is roughly 200 creatives a year. Their hit rate was about 1 in 6, so they found around 30 to 35 genuine winners across the period. That is the whole game. You are not looking for a clever ad, you are running a volume process until statistics hand you one.
The creative mix mattered too. Roughly 60% was customer-shot UGC (phone footage, unboxing, honest first-impression reactions), 25% was static social proof (review screenshots, before-and-afters, comparison cards), and 15% was polished brand content. The polished 15% almost never won on cost per acquisition, but it held brand perception up and performed better on retargeting. The systematic version of this cadence is laid out in our Meta ad creative testing framework.
One detail founders miss: they logged every test in a single Google Sheet with hook type, format, offer, spend, CPA and outcome. After 60 tests, the sheet started predicting winners. Hook style beat production quality every single time.
The Numbers That Actually Moved
Revenue going from $15k to $80k is the headline. The underlying metrics are more useful.
- Site conversion rate: 1.4% to 2.6%. Almost all of the month-one gain came from here, before ad spend changed at all. Australian Shopify stores typically sit between 1.5 and 3%, so this moved them from below-average to solidly above.
- Average order value: $84 to $112 AUD. Driven by a bundle offer and a free-shipping threshold set just above AOV, not below it.
- Email revenue share: 8% to 24% of total. Welcome, abandoned cart and browse abandonment flows in Klaviyo. Email should be carrying 25 to 30% of revenue for a store this size, so there is still room.
- Blended ROAS: 1.9 to 2.7. Note that in-platform Meta ROAS read considerably higher. Blended is the number that pays your rent.
- Repeat purchase rate: 18% to 27%. This is the quiet one. It is also why the ad spend increase stayed affordable.
Track blended ROAS weekly in a simple sheet: total revenue divided by total ad spend across every channel. Set a floor based on your actual contribution margin, not a number you read on LinkedIn. For most Aussie DTC brands running 60 to 70% gross margin, a blended ROAS floor somewhere between 2.2 and 2.8 keeps you profitable while still growing.
What Would Have Broken This
Three things nearly did, and they are the same three that derail most scaling attempts.
Scaling before the retargeting layer existed. In month two they pushed prospecting spend up while retargeting was still a single generic audience. Cost per acquisition jumped 34% in nine days. Rebuilding retargeting into segmented windows fixed it, and the approach is covered in our breakdown of Meta retargeting segmentation.
Stock. Two of their top three sellers went out of stock in month five while ads were still running to those product pages. Roughly $9k of demand was pushed at a page that could not convert. Anyone scaling paid media needs a weekly stock-versus-spend check, and ad sets should pause automatically when cover drops under three weeks.
Founder impatience. Twice the founder wanted to triple budget in a week after a good day. Both times they held to the 20 to 30% rule instead. Every account we have seen blow up during scaling blew up on a budget jump, not a bad ad.
Your Scaling Roadmap
This case study is not unique. The framework — fix the store, restructure the account, test creative systematically, scale gradually — works for any Shopify brand spending $2K+ per month on Meta Ads. The specific tactics differ by niche, but the principles are universal.
Inside eCommerce Circle, a Meta Ads account structure that scales without burning margin is one of the core Promotion pillars we work on with every member. If you want a second opinion on yours, let’s talk.