Most Aussie DTC founders treat their product catalogue like a hoarder’s garage. Every SKU launched is a SKU kept. Every “let’s just try one more colour” stays on the site three years later, taking up shelf space, photoshoot budget, ad creative slots, and forecasting brain power that should be going somewhere else.
What’s in This Article
Then you hit June and the same pattern repeats. Your accountant asks why stock-on-hand is so high. Your 3PL invoices climb. Cash is tight even though revenue is up. You blame Meta, shipping rates, or the AUD. The real culprit is sitting in your Shopify admin: a long tail of SKUs that nobody buys, that no one will ever buy at full price, and that you are still paying to store, insure, photograph, and forecast for.
Here is the math most founders never run. McKinsey research puts the cost of product complexity at roughly USD 50 billion in lost gross profit per year for U.S. food and beverage manufacturers alone. Bain estimates SKU complexity can inflate supply chain costs by up to 25%. In your store, the bottom 50% of SKUs typically generate only 5% of revenue. Half your catalogue is doing one-twentieth of the work. The SKU rationalisation playbook below is the 5-tier audit we run inside eCommerce Circle to find that dead weight, decide what to do with it, and reclaim $50K or more in trapped inventory cash before 30 June.
The Real Cost of SKU Bloat (No One Talks About)
When you ask a founder why they hold 240 SKUs instead of 80, the answer is almost always the same: “Every product earns its keep.” That is rarely true once you actually look at the numbers.
Inventory holding costs in ecommerce run between 20% and 30% of total inventory value per year. For stores under $1M in annual revenue, the high end is more typical: 25 to 30%. That covers warehousing, insurance, shrinkage, capital cost, and obsolescence. If you are sitting on $50,000 in dead stock, you are quietly paying $12,500 a year just to keep it on shelves that could be holding a winner.
The complexity tax is bigger than the storage tax. Forecast accuracy is roughly four times worse at the SKU level than at the category level, which is why your reorders are always slightly wrong. Every extra SKU adds a row to the demand plan, a line on the supplier PO, a tile in the PDP grid, a creative variant in the Meta ad set, and a new edge case for customer service. A 240-SKU catalogue is not twice the work of a 120-SKU catalogue. It is closer to four times the work.
The good news is that the inverse works too. Bain studied a Belgian food category that grew revenue 17% while reducing SKUs by 42%. A Swedish candy category lifted sales 19% with 18% fewer items. Coca-Cola publicly discontinued thousands of SKUs in 2020 and James Quincey credited the simplification with returning the business to revenue growth. Less can absolutely mean more, but only if you do the cuts with a framework rather than vibes.
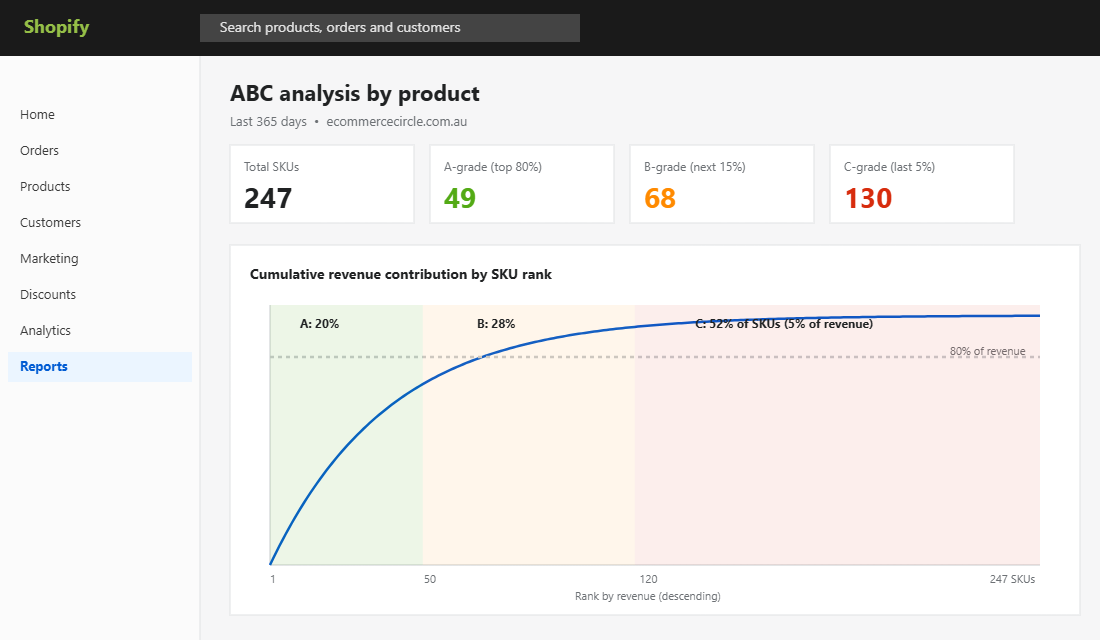
Tier 1: Run the Shopify ABC Analysis (Your Starting Map)
Shopify has had ABC analysis built into the admin for years and most founders have never opened it. From your admin, go to Analytics, then Reports, then look for “ABC analysis by product” under the Inventory section. If you are on Basic or Lite, the report is gated, so use Mipler, Report Pundit, or Sumtracker from the App Store to get an equivalent view for under $30 a month.
The report classifies every SKU into one of three grades based on revenue contribution over a rolling window. A-grade is the top 80% of revenue, typically 15 to 25% of your SKUs. B-grade is the next 15% of revenue, roughly 25 to 35% of SKUs. C-grade is the bottom 5% of revenue, which usually balloons out to 40 to 60% of your catalogue. That C-grade band is where rationalisation lives.
A few rules when you pull the report. Use a 12-month window, not 90 days. Seasonal stores get punished by short windows. Run it by product variant, not by parent product, because a “navy XL” tells you something different to a “rose XS”. And export the CSV. You will need it for Tier 2 because ABC alone is necessary but never sufficient. Revenue tells you what sold. It does not tell you what was profitable, what was strategic, or what was just floating on heavy discounting.
For most Aussie stores between $40K and $500K a month in revenue, the first ABC pull reveals something uncomfortable. Roughly half the catalogue is in C-grade. A third of A-grade revenue is concentrated in five to ten variants. The hero range you thought was performing has two real winners and twelve passengers. The audit has not even started yet and you already know where the cuts are coming from.
Tier 2: The 5-Metric SKU Scoreboard (What ABC Misses)
ABC by itself will get you a punishing cut list, but it will also flag SKUs that should not be cut. Revenue is one input. You need four more before you make any irreversible decision.
- 1. Revenue (12 mo). The ABC input. Net of returns, not gross sales.
- 2. Contribution margin. Revenue minus COGS, minus shipping, minus transaction fees, minus packaging, divided by revenue. If you have never built this, the Shopify Contribution Margin Audit walks through it line by line. The 40% threshold is your dividing line for most categories.
- 3. Sell-through rate. Units sold in the period divided by average units on hand. Anything under 1x per year is dead money. Healthy A-grade stock sits between 3x and 8x annually.
- 4. Days of cover. Units on hand divided by daily run rate. Over 180 days is a warning. Over 365 days is dead stock by every reasonable definition.
- 5. Strategic value. The qualitative one. Is this SKU a halo product that pulls people into the brand, a gateway price point, a B2B requirement, or seasonal essential? Score High, Medium, or Low.
Put all five into one sheet next to every variant and you have a scoreboard. The reason this matters: a low-revenue SKU with a 55% contribution margin and a sell-through of 2x per year is a hidden gem, not a cut candidate. A high-revenue SKU with a 9% margin and a 1.2x sell-through is a margin trap, not a hero. ABC would tell you to keep the latter and quietly bury the former. The scoreboard tells you the opposite.
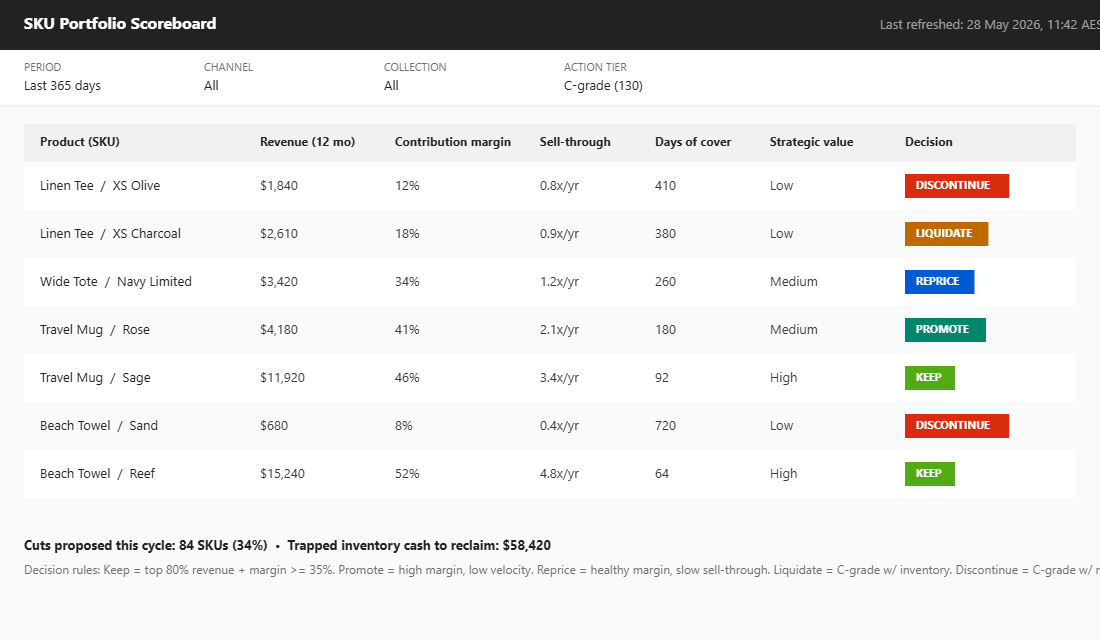
Tier 3: The Decision Matrix (Keep, Promote, Reprice, Liquidate, Discontinue)
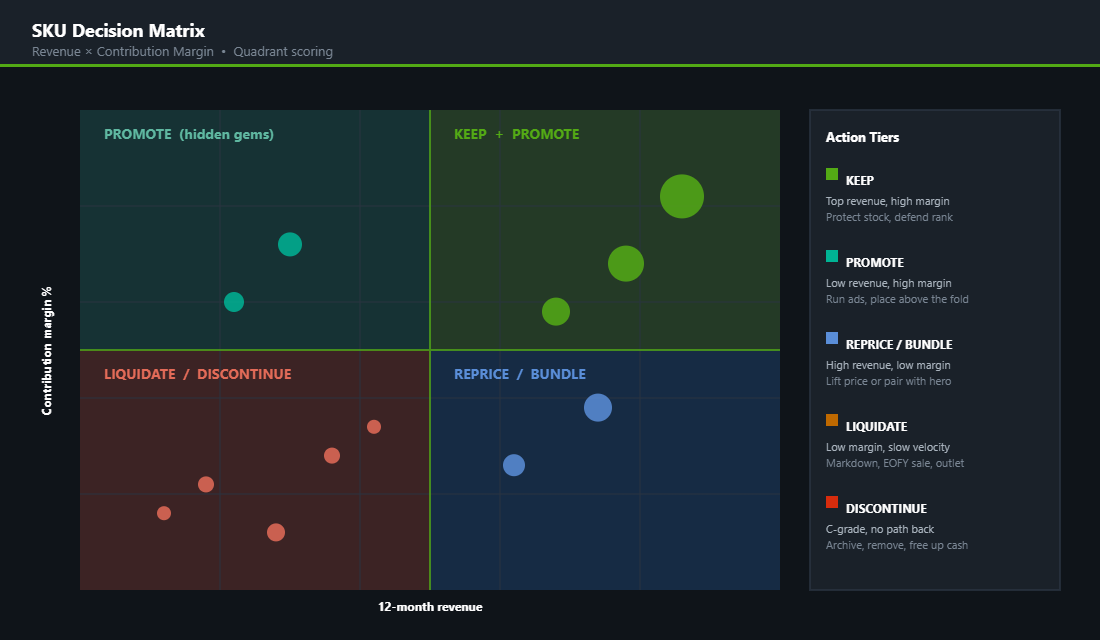
Once you have the scoreboard, every SKU gets one of five labels. The decision matrix below is what we use inside eCommerce Circle to remove the emotion from cuts. You are not deciding “is this a good product”. You are deciding “what is the right action for this product right now”.
- KEEP. A-grade or B-grade SKU with contribution margin above 35% and sell-through above 2x. Protect stock, defend its rank on the collection page, plan reorders aggressively.
- PROMOTE. Low revenue, high margin, healthy sell-through. The hidden gem. Move it above the fold, feature it in email, run a small budget Meta test. These are the most overlooked SKUs in any catalogue.
- REPRICE or BUNDLE. Decent revenue, weak margin. Lift the price 8 to 15% and watch volume. If volume holds, you just unlocked profit. If it tanks, pair the SKU with a hero in a curated bundle at full margin.
- LIQUIDATE. C-grade with on-hand stock and no strategic value. Mark down, push through EOFY sale, outlet collection, or wholesale dumping. Goal is to convert dead cash into live cash within 60 days.
- DISCONTINUE. C-grade with no stock, no strategic value, and no realistic path back. Archive in Shopify, redirect the URL, remove from the supplier PO forever.
The decision is rarely fifty-fifty. About 70% of C-grade SKUs in a typical first audit fall cleanly into LIQUIDATE or DISCONTINUE. Another 20% turn out to be hidden gems flagged for PROMOTE. The last 10% are the genuinely tough calls: a slow-moving SKU that a top customer specifically buys, a colour that drives a key collaboration, or a variant that supports a wholesale account. Those get a conditional KEEP with a 90-day review.
Tier 4: The Liquidation Playbook (5 Channels to Clear C-Grade Stock)
This is where most Aussie founders stall. They run the audit, draw up the cut list, and then the C-grade stock sits there for another 18 months because nobody has a written plan for actually moving it. The point of rationalisation is to free up the cash. Stock that is “going to be cut” but still in your warehouse is just dead stock with a story.
- Channel 1: EOFY sale, segmented. Do not blanket discount the site. Build an EOFY collection that is C-grade only. 30 to 50% off, capped quantities, no returns. Run it for 14 days max so it does not bleed into your full-price brand. Email your top 30% list first, then your full list on day three.
- Channel 2: Bundle into a winner. Pair two C-grade variants with one A-grade hero at a $5 to $10 premium over the hero alone. The customer feels they got value, the hero sells through faster, and you move dead stock at near-full margin. Bundle architecture is the cleanest way to turn a write-off into AOV growth.
- Channel 3: Outlet collection. Permanent collection at /collections/outlet (noindexed). Discounted everyday by 25 to 40%. Linked from cart drawer, post-purchase pages, and the welcome flow. Quiet, persistent, no brand damage.
- Channel 4: Wholesale or jobber. Australian liquidation buyers like JTC Import Export, B-Stock pallets, or a local market reseller will offer 10 to 30% of cost in cash. Painful, but it clears the warehouse in a week and the cash is real.
- Channel 5: Donation with a tax receipt. For end-of-line stock with no buyer, a registered charity donation can be claimed as a deduction. Talk to your accountant first because it has to be timed before EOFY for the current FY benefit.
The order matters. Try Channel 1 and 2 first because they protect margin. Channel 3 keeps revenue flowing but discounts permanently. Channels 4 and 5 are emergency exits. The 60-day target is non-negotiable: if a SKU is on the cut list and has not moved through one of these five channels in 60 days, it goes to Channel 4 by default.
Tier 5: The Discontinuation SOP (Removing a SKU Without Killing SEO or CX)
Cutting a SKU in Shopify is not “click delete”. A clean discontinuation protects SEO equity, avoids angry customer service tickets, and keeps your reporting clean. We use a 7-step SOP every time, no exceptions.
- Step 1. Set the variant to “Continue selling when out of stock = OFF” and let the last units sell through. Do not delete inventory that customers can still buy.
- Step 2. Once at zero, change the product status from Active to Draft. The PDP returns a 404, which is a problem for SEO if the page has backlinks or traffic.
- Step 3. Set a 301 redirect from the discontinued product URL to its closest live replacement. Shopify has built-in URL Redirects under Online Store, Navigation. Never let a ranked URL 404.
- Step 4. Remove the SKU from all collections, automations, and saved searches. Klaviyo product feeds, Google Merchant Centre, Meta catalogue, Pinterest feeds. If you forget Merchant Centre, your Performance Max ads will keep serving an unavailable product, hurt your account quality score, and waste spend.
- Step 5. Update the supplier PO template and reorder sheet. The SKU goes on the “Do Not Reorder” list. This is the step founders skip and it is how dead SKUs come back from the dead.
- Step 6. Notify customer service. If there is a chance a customer will email asking when it is coming back, your CS team needs a macro. The honest macro is the best one: “We have retired this product. Here are two alternatives, and 10% off your next order if you want to try one.”
- Step 7. Log the cut in your SKU register with date, reason, and the redirect target. A founder running rationalisation quarterly will build a register of 30 to 80 cuts in a year. That is the institutional memory that keeps the bloat from coming back.
Run this SOP for every discontinued SKU. Most stores will find that the URL redirect alone reclaims 5 to 15% of the SEO traffic that would otherwise vanish, and customer service tickets about “where is product X” drop to near zero within 30 days.
The Compound Effect: What Founders See 90 Days After a Rationalisation
The reason this audit pays back faster than almost any other operating exercise is that the gains stack. You do not get one benefit. You get five at once and they reinforce each other.
First, cash. A typical Aussie brand running its first SKU audit on a 200-SKU catalogue will free up $40,000 to $80,000 in trapped inventory cash through liquidation channels 1 to 4. That cash goes straight onto the next hero reorder, which compounds because hero SKUs sell through 4 to 8 times faster than C-grade. If you have not yet mapped the working capital benefit, the Shopify Cash Conversion Cycle Playbook shows how this rolls into the broader cycle.
Second, margin. McKinsey case data on CPG simplification programmes shows 3 to 6 percentage points of margin lift even as SKU counts fall 25%. The same math holds in DTC. Cutting a 9% margin SKU and replacing the shelf space with a 45% margin SKU is a 36-point swing on every unit sold, before you even count the reduction in overhead.
Third, conversion. Fewer SKUs on the collection page means less decision fatigue. Choice overload research consistently shows 15 to 25% conversion lifts when a category drops from 30 options to 12. Aussie brands that have run this with us report similar movement, sometimes more on mobile where scroll depth is the silent killer.
Fourth, forecasting accuracy. Going from 240 SKUs to 160 does not just save admin time. Demand planning gets easier because you are planning around stronger signal. The four-times accuracy gap between SKU-level and category-level forecasts narrows as your tail thins. Better forecasts mean fewer stockouts on the heroes, which is where real revenue lives. The Back-in-Stock Playbook covers the stockout recovery side.
Fifth, focus. The least quantifiable, most under-rated benefit. A founder with 80 SKUs to obsess over thinks about positioning, photography, and customer experience. A founder with 240 SKUs thinks about inventory and admin. The cut is a strategic act, not just a financial one.
The 5-Tier SKU Audit Template (Your EOFY Checklist)
Pull this exercise into 5 days between now and 30 June. One tier per day. You do not need a consultant, an enterprise data warehouse, or new software. You need your Shopify admin, a spreadsheet, and the discipline to follow the order.
- Day 1: Run ABC. Shopify Reports, ABC analysis by product, 12-month window, by variant. Export CSV.
- Day 2: Build the scoreboard. Add columns for contribution margin, sell-through rate, days of cover, and strategic value. Pull COGS and inventory from your back-of-house. The scoreboard sheet template lives in the same spreadsheet as your monthly business review.
- Day 3: Apply the decision matrix. Tag every SKU as KEEP, PROMOTE, REPRICE, LIQUIDATE, or DISCONTINUE. Sense-check the LIQUIDATE list against your CS lead and your buyer. They will save you from cutting a SKU your wholesale account needs.
- Day 4: Stage the liquidation. Build the EOFY outlet collection, draft the segmented email, configure the bundles, and call your local jobber for a quote on whatever is left. Set firm 60-day milestones on each channel.
- Day 5: Execute the discontinuation SOP. For every SKU you have already zeroed out, run the 7-step SOP and log it in your SKU register. Update Klaviyo, Merchant Centre, Meta catalogue, and the supplier reorder sheet.
Run this every six months. Plenty of Aussie brands run it quarterly once they have done it once because the discipline pays. The cuts get smaller each cycle because the catalogue stays disciplined, but the cash freed and the margin lifted compound. By the second year of running this rhythm, the only SKUs that survive are the ones earning their place.
If you have not run this audit, your catalogue has 30 to 40% dead weight inside it right now. EOFY is the cleanest window of the year to cut it because the discounting is expected, the tax position favours clearing stock, and the new financial year starts with cash on the balance sheet instead of dust on the shelves. Inside eCommerce Circle, the SKU rationalisation audit is one of the first exercises we run with every new member because it pays for the membership three times over before BFCM. If you want a second opinion on yours, let’s talk.