Walk into any Australian Shopify back end at the $1m to $5m a year stage and you will find the same quiet drag on the P&L. A catalogue that has grown 30% bigger every year. A handful of hero SKUs paying the rent. And a long tail of slow-moving stock sitting in the third-party logistics rack, eating storage fees, distorting the merchandising, and tying up working capital that should be funding ads or new product development.
What’s in This Article
The numbers are confronting. Within retail alone, dead inventory costs the industry nearly $50 billion a year. The average ecommerce business carries 15 to 25% dead inventory at any moment, and fashion brands run as high as 20 to 30%. Worst of all, 73% of ecommerce operators have no systematic process for finding it, scoring it, and clearing it.
This playbook fixes that. It is the same 5-stage SKU rationalisation system we walk through inside the eCommerce Circle workshop with founders running $1m to $10m a year on Shopify. By the end of a single quarterly audit, you will have cut 20 to 30% of your slow movers, freed up $40K to $80K in dead stock cash, and given your range a sharper story that customers and the algorithm both reward.
The Reality of the Long Tail: Why Most Aussie Catalogues Are Quietly Bleeding
The Pareto principle is brutal in DTC. Across thousands of Shopify stores, the top 20% of SKUs generate 70 to 80% of revenue. The next 30% pull in another 15 to 25%. The remaining 50% of your catalogue contributes just 5 to 10% of the topline. In fashion, the split is even more extreme. Top performers see 75% of revenue come from the top 15% of styles, because trend volatility punishes anything outside the bestsellers list within 8 weeks of launch.
That long tail is not free. Inventory carrying cost runs 18 to 30% of inventory value a year for most ecommerce operations, and small Aussie brands under $1m a year sit at the high end at 25 to 30%. That includes capital cost, warehouse fees, insurance, shrinkage, obsolescence, and the opportunity cost of cash that could be deployed elsewhere. Hold $100K in dead stock for 12 months and you have spent $25K to $30K just keeping it on the shelf.
Then there is the merchandising drag. Every C-tier SKU on your collection page is a click your hero product did not get. Every variant in a slow size or colour is one more decision your customer has to make before adding to cart. Every dead SKU in your post-purchase upsell flow is a missed AOV opportunity. Bloated catalogues do not just cost cash. They cost conversion.
And the cost is compounding. Princess Polly, the Aussie fast-fashion giant, runs a catalogue of around 3,920 active styles and adds up to 150 new ones every week. That works at their scale and their margin structure. At your scale, mimicking that volume without their merchandising machine just buries the bestsellers. Big catalogue is not a strategy. Tight catalogue with deliberate range planning is.
Stage 1: Score Every SKU Using ABC and Sell-Through Rate
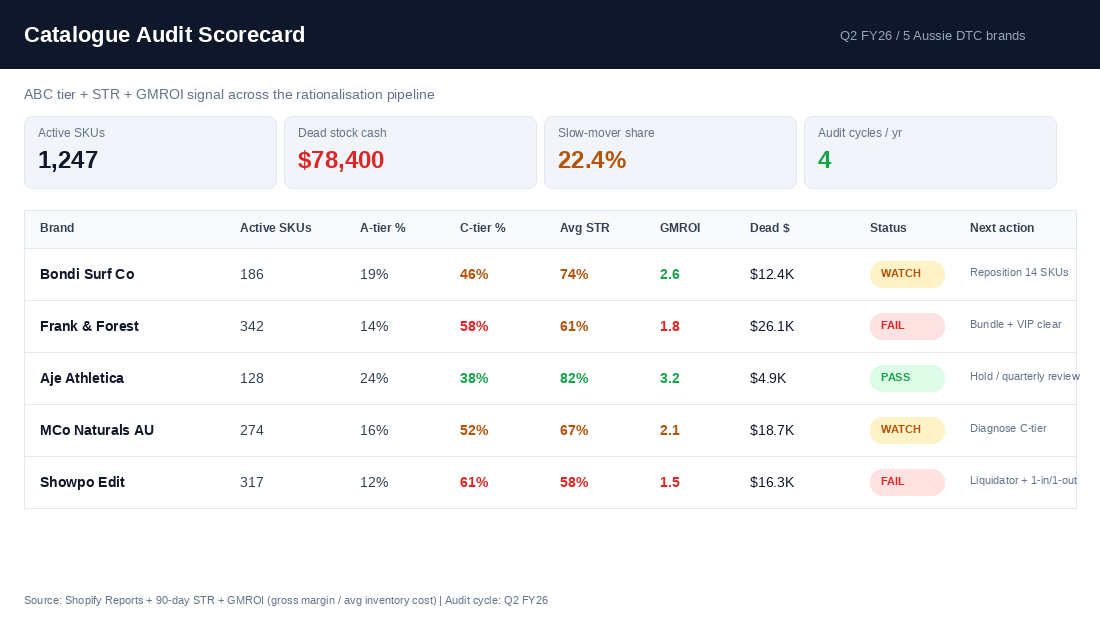
The first job of the audit is to put a tier and a velocity score on every active SKU in the catalogue. You cannot rationalise what you have not measured. Shopify already gives you the data inside the admin, free.
Go to Analytics > Reports > ABC analysis by product. Shopify will sort every SKU into three classes based on contribution to total revenue. A-grade products contribute up to 80% of revenue. B-grade contributes about 15%. C-grade contributes the bottom 5%. This is the same calculation the inventory planning industry has used for 50 years. Shopify just baked it into the admin.
Then layer in sell-through rate (STR). STR is the percentage of inventory you actually sold in a given period. A healthy DTC business runs above 80% storewide, with hero SKUs above 90% and acceptable C-tier sitting at 40 to 60%. Anything under 25% over a full quarter is a candidate for action, no matter how nice the product looks on the PDP.
Finally, layer in GMROI, gross margin return on inventory investment. The formula is gross margin divided by average inventory cost. For fashion and apparel, healthy GMROI sits at 2.5 to 4.0. Broader retail benchmarks land at 1.86 to 3.01. A GMROI under 1.5 on a SKU means you are not even recovering your gross margin on the cash tied up in stock.
Pull all three into one sheet. Columns: SKU, ABC tier, units on hand, 90-day units sold, STR, GMROI, contribution margin, days since last sale, total cash tied up. This is your scorecard. Every SKU gets a row. Sort by total cash tied up descending. That is your rationalisation hit list, ordered by the dollars you can actually release.
Stage 2: Diagnose the C-Tier Before You Cut Anything
This is the stage most founders skip. They see a C-grade SKU with low sell-through and immediately mark it for clearance. That is a fast way to liquidate a future hero. The reason a SKU is slow matters more than the fact that it is slow.
For every SKU on the action list, ask the four diagnosis questions:
- Is it a demand problem? No one wants this product, full stop. Returns are high, reviews are mixed, the niche it was meant to fill never materialised. This is a true cut candidate.
- Is it a merchandising problem? The product is fine but it sits on page 3 of the collection, has bad photography, weak copy, or is buried below 4 ranges of variants. Fix the merchandising first.
- Is it a pricing problem? The product converts when discounted but not at full price. Either the price ladder is wrong (too close to a hero SKU) or the perceived value does not match the price tag.
- Is it a product problem? The product itself has a quality, fit, or specification flaw the market is rejecting. Check return reasons, post-purchase survey verbatims, and 1-2 star reviews for the signal.
The diagnosis sets the next move. Demand and product problems usually end in discontinuation. Merchandising and pricing problems mean reposition and re-test before you write the SKU off. Run this triage on each C-tier item and you will be surprised. In a typical audit of a $2m a year Aussie Shopify brand, around 40% of slow movers are merchandising or pricing problems, not product problems. That is 40% of your dead stock list you could rescue with the right fix.
Document the diagnosis in plain English next to each SKU in the scorecard. “Demand. Returns 28%. Discontinue.” Or “Merchandising. Hidden in size variants. Reposition as standalone PDP.” Or “Pricing. Sits $5 under hero SKU, no clear premium tier reason. Lift to $89 and re-test.” The annotation forces clarity and stops you defaulting to liquidation when you have a fixable problem.
Stage 3: Run Every SKU Through the Decision Tree
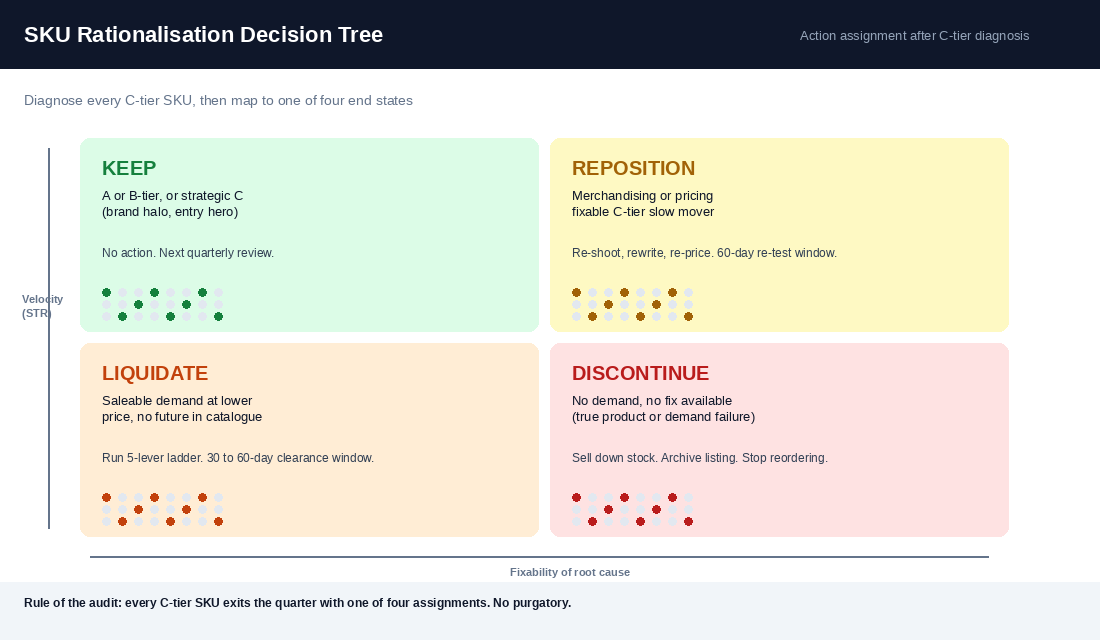
Once each SKU has a tier, a velocity score, and a diagnosis, it goes through the rationalisation decision tree. There are only four end states. Every SKU lands at one of them by the end of the quarter.
- Keep. The SKU is A or B grade, or it is a strategic C (entry-price hero, gift item, brand halo product) that earns its shelf space for a non-revenue reason. No action beyond the next quarterly review.
- Reposition. The SKU has a fixable problem. Re-shoot, rewrite, re-merchandise, re-price, or move into a new collection. Set a 60-day re-test window with a clear pass-fail target (for example, “lift STR from 18% to 40% in 60 days or drop to liquidate”).
- Liquidate. The SKU has saleable demand at a lower price but no future in the catalogue. Move through the liquidation playbook in stage 4. Target a 30 to 60-day clearance window.
- Discontinue. The SKU has neither demand nor a fixable reason. Stop reordering, sell down the existing stock at clearance pace, then archive the listing.
The discipline is in not letting any C-grade SKU stay in “we should look at that one day” purgatory. Either you make a decision in the quarterly audit or you keep paying the carry cost for another 90 days. At 25% carrying cost, every $10K of stagnant inventory is costing you about $208 a month in cash drag, before the merchandising and opportunity cost.
For inspiration on how this connects to the working capital side of the business, the Cash Conversion Cycle Playbook shows how SKU rationalisation slots into the broader working capital framework. Every dollar of dead stock released here lands in the same bank account that pays for ads and product development.
Stage 4: The Liquidation Playbook (5 Levers, Ranked by Margin Recovery)
When a SKU lands on the liquidate or discontinue path, the goal is to recover the most cash possible without bleeding the brand. Most founders default straight to a sitewide sale, which is the worst possible move. It trains customers to wait, devalues the hero range, and recovers a small fraction of what a structured liquidation playbook delivers.
Work through these 5 levers in order. Stop at the first lever that clears the stock. Each one preserves more margin than the next.
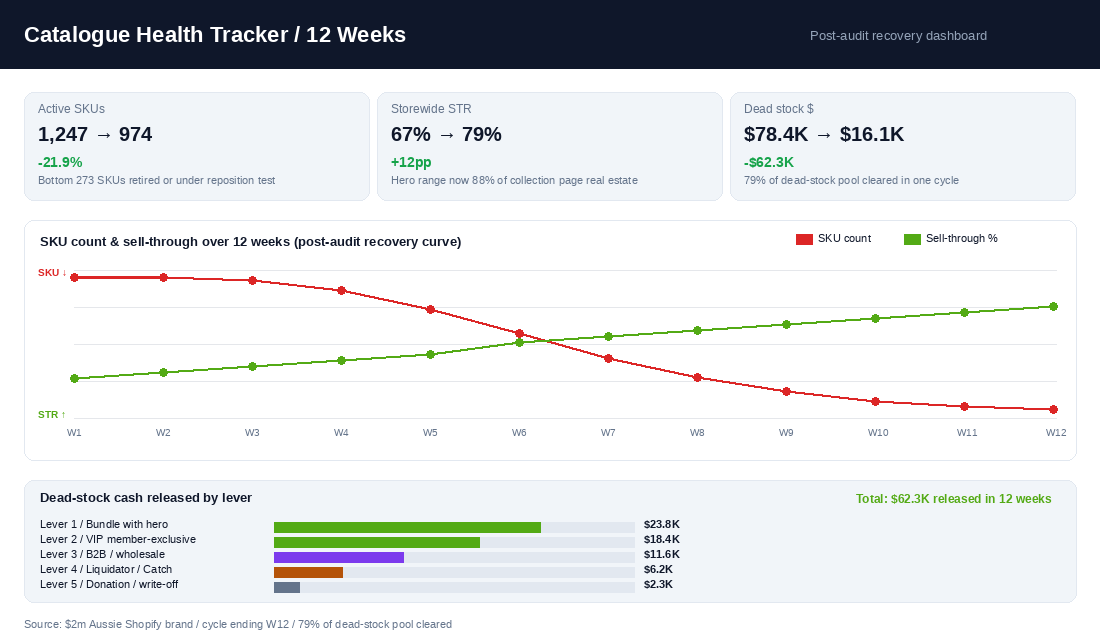
- Lever 1: Bundle with a hero SKU. Pair the slow mover with an A-grade product as a value bundle, “buy X get Y at 50% off”, or BOGO. Best margin recovery, 60 to 100% of full price. Move time 7 to 30 days. This is where your Product Bundle Playbook earns its keep.
- Lever 2: Member-exclusive or VIP early access. Offer 20 to 35% off to your top 10% customer segment via Klaviyo or your loyalty program. Preserves discount discretion (no sitewide leak), rewards your highest-LTV customers, and clears stock fast. Recovery 65 to 80% of full price.
- Lever 3: B2B or wholesale clearance. If you have wholesale accounts or relationships with multi-brand retailers, offer a one-off discount block. Aussie boutiques and gift stores will often pick up clearance lots at 50 to 60% off RRP for one-off in-store runs. Recovery 40 to 55%.
- Lever 4: Liquidator or marketplace. Sell the lot to a third-party liquidator like GraysOnline, ALLBIDS, MyDeal Liquidation Warehouse, or list overstock on Catch.com.au. Recovery 10 to 30% of cost, but the inventory leaves your warehouse in 14 to 30 days and the cash hits the account fast.
- Lever 5: Donation or salvage. Donate to a registered Aussie charity (Good360, Givit, Thread Together for apparel) and claim the tax deduction. Recovery is the tax write-off only, but the brand halo is real and the storage drag stops immediately.
Bondi Sands, Frank Body, and MCoBeauty all run structured end-of-season clearances that follow this ladder. Member-exclusive first, then VIP bundle, then a public sample sale, then a marketplace dump for whatever did not move. The discipline is in the sequence. Cheap brands skip to lever 4 and lose the margin. Strong brands grind through 1 and 2 first and recover an extra 30 to 50 cents on the dollar.
Set hard windows for each lever. 14 days for bundles, 21 days for member-exclusive, 14 days for wholesale outreach, 30 days for liquidator listing. If a SKU is still on the shelf after 90 days of structured clearance, donate it. Time is the enemy because the carry cost compounds every month it sits.
Stage 5: The Quarterly Audit Cadence and the 1-In, 1-Out SKU Gate
The audit is not a one-off rescue mission. Without a recurring rhythm and a gate on new SKU launches, the catalogue rebuilds the bloat inside 6 months and you are back where you started. Two non-negotiables make this stick.
The quarterly audit cadence. Block 1 full day in the calendar every 90 days, the week after quarter-end. Inputs are the Shopify ABC report, the STR by SKU, the GMROI per SKU, and the 90-day units sold. Outputs are the updated scorecard, the C-tier diagnosis log, the decision tree assignments, and a 60-day clearance window per Liquidate SKU. Founder time investment is 4 to 6 hours per audit. Cash released averages $30K to $80K per audit on a $2m brand, and the gain compounds because every retired SKU stops earning carry cost from quarter one onward.
The 1-in, 1-out SKU gate. Every new SKU added to the catalogue must kill an old one. No exceptions. If you launch 12 new styles for the spring drop, you retire 12 old ones from the previous range, either by discontinuing or by archiving the listing. This prevents the slow creep that buries hero SKUs over time. Princess Polly can run 150 launches a week because they have the team and the velocity to backfill the back end. A $2m to $5m Aussie brand cannot. Discipline is the moat.
Pair the gate with a SKU launch checklist that requires a 90-day STR target and a kill criteria before the product even gets a PDP. “Launch the Aubergine colourway. Target 35% STR in 90 days. If under 20%, discontinue and replace in the next drop.” Now your catalogue has a forward-looking quality control loop, not just a backward-looking clearance loop.
The Tool Stack Aussie Founders Use to Run the Audit
Most of this can be run inside Shopify and a single Google Sheet. The platforms below add depth as the catalogue scales past 500 SKUs.
- Shopify Analytics ABC Report (free). Built into the admin under Reports. Gives the A/B/C tiering across any time window. Start here.
- Shopify Inventory Reports (free). Days of supply, units on hand by variant, sell-through rate. Sufficient for catalogues under 500 SKUs.
- Stockful or Inventory Planner ($79 to $199 AUD a month). Critical heads-up for Aussie founders. Stocky, the Shopify-owned inventory app, is shutting down for good on 31 August 2026. If you are still relying on it for forecasting, sell-through, or reorder recommendations, migrate now. Stockful ($29 a month upward) and Inventory Planner are the two strongest replacements, with full ABC, sell-through, and dead stock detection baked in.
- Klaviyo segments (existing stack). Build a “Top 10% Customers” segment for the member-exclusive liquidation lever in stage 4. Pairs perfectly with a VIP early-access email.
- Google Sheet scorecard. One sheet, one row per SKU, the columns listed in stage 1 plus the diagnosis and decision. Owner of the sheet is the founder or the ops manager. Update inside the quarterly audit and again in the 60-day re-test reviews.
Variant complexity is its own rabbit hole and deserves a separate look. If your audit reveals that 70% of your dead stock is in third-tier variants (rare sizes, secondary colourways, niche flavours), pair this work with the Variant Strategy Playbook. Half the catalogue audit fix is at the variant level, not the master SKU level.
The Compound Effect: What This Looks Like on a $2m Aussie Shopify Brand
Run the maths on a $2m a year Aussie DTC brand carrying $400K of inventory at any moment, with a typical 20% slow-moving share, so $80K sitting as dead or near-dead stock.
One full audit cycle, executed through stages 1 to 4, typically releases 60 to 75% of that dead-stock pool. That is $48K to $60K in cash back in the bank inside a 90-day window. At a 25% carrying cost, you also save $12K to $15K a year in carry that you would have paid going forward. Net effect of one disciplined audit, $60K to $75K in working capital recovery in the first 12 months.
The compounding gain is in the merchandising. With 30% of slow movers retired, the average customer sees a tighter range, more hero SKUs above the fold on the collection page, and fewer dead-end variants in the cart drawer. In our coaching cohorts, founders running this audit see storewide conversion lift of 0.15 to 0.35 percentage points within 60 days of the cut. On a 2.0% baseline CR with $85 AOV and 24,000 sessions a month, a 0.25-point CR lift is $5,100 a month in incremental revenue, $61,200 a year. Margin contribution at 22% is $13,500.
Add the working capital release and the carry-cost saving and one disciplined catalogue audit returns roughly $75K to $90K in the first year on a $2m brand. The audit itself takes 6 hours of founder time per quarter, plus 8 to 12 hours of ops execution. ROI is in the order of 200x against the time invested.
The 30-Day Rollout Plan
You do not need to wait for the next quarter to start. Here is the 30-day sprint to run the first audit and lock in the cadence.
- Week 1: Pull the data. Generate the Shopify ABC analysis report. Export 90-day units sold, units on hand, and contribution margin by SKU. Build the scorecard sheet with all columns. End the week with one row per active SKU.
- Week 2: Diagnose the C-tier. For every SKU under 25% STR, run the 4-question diagnosis. Annotate the sheet with demand / merchandising / pricing / product. Bring 1-2 star reviews and return reasons in as evidence.
- Week 3: Decision tree assignments. Assign every C-tier SKU to Keep, Reposition, Liquidate, or Discontinue. Set 60-day re-test windows on Reposition SKUs with clear pass-fail targets. Build the liquidation queue ordered by cash tied up descending.
- Week 4: Execute Lever 1 and 2. Launch the first round of bundles pairing slow movers with heroes. Send the VIP member-exclusive clearance email to the top 10% segment. Monitor through Klaviyo and the Shopify analytics dashboard daily. Set the next quarterly audit date in the calendar before the week ends.
The 3 Failure Modes to Avoid
Three patterns kill the audit before it lands. Watch for all three.
- Default to a sitewide sale. Skipping levers 1 and 2 and going straight to “30% off everything” trains customers to wait, damages the hero range, and recovers a fraction of structured clearance margin. Discipline through the ladder.
- Quarterly audit becomes annual audit. One audit a year is too slow. The catalogue bloats faster than that, and the carry cost runs all year. The compounding gain only kicks in with 4 cycles a year on the calendar.
- No 1-in, 1-out gate. Without the launch gate, every new drop adds 15 SKUs and retires zero. Within 6 months you are back to the same long tail and the same dead stock pool. The gate is the structural fix. Audits clear the past; the gate prevents the future.
The Carry Cost Nobody Calculates: What Your C-Tier SKUs Cost You Every Month
Dead stock feels free once you have paid for it. It is not. Every unit sitting on a shelf carries a monthly cost, and once you put a number on it the audit stops being optional.
Inventory carry cost for Aussie DTC brands typically runs 20 to 30% of stock value per year once you add storage (3PL bin fees at $0.50 to $2 per cubic foot per month, or the rent you are paying on your own space), insurance, shrinkage, the cost of the capital tied up, and the write-down risk on anything seasonal. Take a brand holding $180,000 of stock where 35% of it is C-tier. That is $63,000 of slow movers costing $1,050 to $1,575 a month just to exist, before a single unit is discounted.
Now add the opportunity cost. That same $63,000 in cash buys two more turns of your A-tier products, which at a 55% gross margin and a 6-week sell-through generates $30,000 to $45,000 of gross profit a year that the dead stock is quietly blocking. Put both numbers on one line of your monthly scorecard: carry cost of C-tier, and gross profit forgone. That line is what gets the audit onto the calendar and keeps it there.
For the full liquidation sequence once you have the number, work through the dead stock playbook.
The Shopify Reports That Do 80% of the Audit For You
You do not need a data analyst to run the scoring. Four Shopify reports, exported once a quarter, give you nearly everything Stage 1 needs.
Start with Sales by product variant for the trailing 90 and 365 days. This gives you units, net sales and returns per SKU, which is the ABC ranking. Then pull Inventory: Month-end inventory value to get on-hand cost per SKU, and Sell-through rate (in Analytics on Shopify plans from Grow up) for the same window. Finally, export Product sessions and conversion from the Online store reports, because a C-tier SKU with high traffic and low conversion is a page or price problem, not a demand problem, and it should route differently in the decision tree.
Drop all four into one Google Sheet keyed on SKU. Add three calculated columns: weeks of cover (on-hand divided by weekly velocity), gross margin dollars per unit, and days since last sale. Sort by weeks of cover descending and the top of the list is your C-tier. Anything over 26 weeks of cover with under 5 units a month is an automatic Stage 2 candidate. If you would rather not build it yourself, Inventory Planner or Prediko pull the same data live and flag the outliers for you from around $99 a month.
Closing the Loop: Feeding Audit Results Into Your Open-to-Buy
The audit clears what you have. The buy plan decides what you add. If the two never talk to each other, every quarterly audit is cleaning up the previous quarter’s buying mistakes.
Take three outputs from each audit into the next buying cycle. First, the category-level sell-through: any category where more than 30% of SKUs landed in C-tier gets its open-to-buy budget cut by the same proportion until the ratio recovers. Second, the attribute pattern behind the dead stock. If four of your six slowest SKUs are the extended size range or the fourth colourway, that is a rule for the next range, not a one-off. Third, the cash released by liquidation, which goes into the A-tier reorder, never into new SKU experiments.
Brands that run this loop for four quarters typically lift catalogue-wide sell-through from the 50 to 60% range into the 70 to 80% range, and cut the share of stock value sitting in C-tier from over 30% to under 15%. The open-to-buy playbook shows how to set the budget, and the inventory forecasting system keeps the A-tier from running out while you do it.
Inside eCommerce Circle, the catalogue audit is one of the core operating disciplines we work on with every member. Run quarterly, paired with the working capital framework and a variant strategy review, it is one of the highest-impact rhythms a $1m to $10m Aussie Shopify brand can install. If you want a second opinion on your catalogue and where the dead stock cash is hiding, let’s talk.