Running out of stock on your best seller during your busiest month is one of the most expensive mistakes a Shopify store can make. Not only do you lose the immediate sales, but you lose the momentum – your ads stop converting, your organic rankings can drop, and customers who wanted your product buy from a competitor and may never come back. On the flip side, overstocking ties up cash that could be used for marketing and growth, and risks dead inventory that you eventually have to discount to clear.
What’s in This Article
Inventory management is the balancing act most Shopify store owners never master. They order based on gut feel, reorder too late, and live in a constant cycle of stockouts and overstock. The stores that scale efficiently have moved beyond guesswork to data-driven inventory forecasting – and it is not as complicated as it sounds.
With 6-12 months of sales data and a simple forecasting framework, you can predict demand accurately enough to reduce stockouts by 80% and cut excess inventory by 30-40%. Here is how to build an inventory forecasting system for your Shopify store.
The True Cost of Getting Inventory Wrong
Before diving into forecasting methods, let us quantify what bad inventory management actually costs your business.
Stockout costs are higher than you think. When a product is out of stock, you lose not just the sale but the customer acquisition cost you spent to get them there. If you spent $30 in ads to drive a customer to a product page that shows “Sold Out,” that $30 is wasted. For a store with $5,000 per month in stockout-related lost sales, the true cost including wasted ad spend, lost customer lifetime value, and organic ranking damage can be $8,000-$12,000 per month.
Overstock costs are sneaky. Cash locked in slow-moving inventory cannot be spent on marketing or new products. If $50,000 of your capital is sitting in excess inventory, that is $50,000 that could be generating returns elsewhere. Add storage costs, the risk of products becoming outdated or damaged, and the eventual markdown to clear them, and overstock can quietly erode 5-10% of your annual revenue.
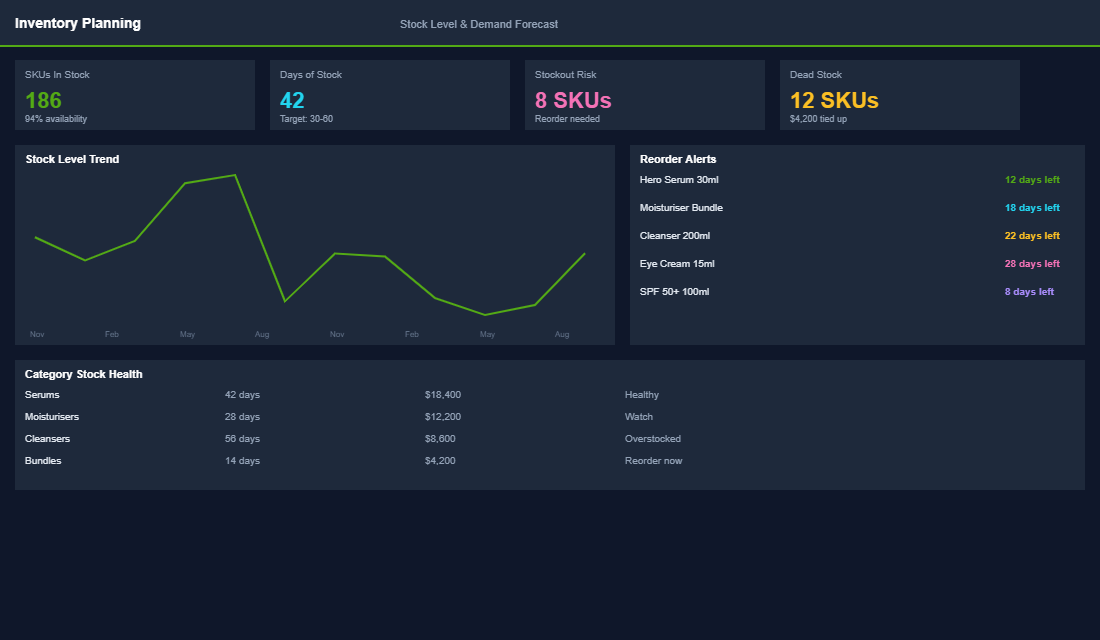
The sweet spot. Most successful Shopify stores target 4-8 weeks of inventory on hand for their core products, with 2-4 weeks of safety stock for best sellers. Getting to this level of precision requires forecasting – which starts with understanding your historical sales patterns.
Basic Demand Forecasting: The Moving Average Method
You do not need fancy software to start forecasting demand. The moving average method works well for most Shopify stores and requires nothing more than a spreadsheet.
Step 1: Pull your sales data. Export monthly sales by product (or SKU) from Shopify for the last 6-12 months. The more data you have, the more accurate your forecast.
Step 2: Calculate the 3-month moving average. For each product, average the last 3 months of sales. This smooths out week-to-week fluctuations and gives you a reasonable baseline for expected demand. If a product sold 120, 140, and 130 units over the last 3 months, your moving average is 130 units per month.
Step 3: Apply a growth factor. If your store is growing, your historical sales underestimate future demand. Apply a growth multiplier based on your month-over-month growth rate. If you are growing at 10% per month, multiply your moving average by 1.1 to get your adjusted forecast: 130 x 1.1 = 143 units.
Step 4: Add seasonal adjustments. If you have 12+ months of data, calculate seasonal factors by comparing each month to the annual average. If December typically sells 1.8x your average month, multiply your base forecast by 1.8 for December. Without seasonal data, research industry seasonality patterns for your category and apply conservative estimates.
Safety Stock: Your Insurance Against Uncertainty
No forecast is perfect. Safety stock is the buffer that protects you from forecast errors and supply chain delays. The right amount depends on two factors: how variable your sales are and how reliable your supplier is.
The simple safety stock formula: Safety Stock = Average Daily Sales x Safety Factor x Lead Time Variability. For most Shopify stores, a safety factor of 1.5-2.0 works well. If you sell 5 units per day of a product, your supplier lead time varies by plus or minus 7 days, and you use a safety factor of 1.5, your safety stock is: 5 x 1.5 x 7 = 52.5 units (round up to 53).
Increase safety stock for best sellers. The cost of stocking out on your top 20% of products (which likely drive 80% of revenue) is disproportionately high. Use a higher safety factor (2.0-2.5) for your best sellers and a lower factor (1.0-1.5) for slower movers.
Setting Reorder Points and Order Quantities
Your reorder point tells you when to place a new order. Your order quantity tells you how much to order. Together, they keep your inventory flowing smoothly.
- Reorder Point = (Average Daily Sales x Lead Time) + Safety Stock. If you sell 5 units per day, your supplier lead time is 21 days, and your safety stock is 53 units, your reorder point is: (5 x 21) + 53 = 158 units. When your inventory hits 158 units, it is time to reorder.
- Economic Order Quantity (simplified): Order enough to cover your forecasted demand for the period until your next order, plus safety stock. If you want to order monthly: Monthly Forecast + Safety Stock – Current Inventory = Order Quantity. If your forecast is 143 units, safety stock is 53, and current inventory is 80, order 116 units.
- Factor in minimum order quantities. Many suppliers have MOQs that may exceed your immediate needs. If your MOQ is 200 units but you only need 116, you have two choices: order the MOQ and accept higher inventory levels, or negotiate a lower MOQ (often possible for established relationships). Calculate whether the extra inventory cost is offset by better per-unit pricing at higher volumes.
- Review and adjust monthly. Forecasting is not set-and-forget. Review your forecasts against actual sales monthly, adjust your growth factors, and recalculate reorder points. The more cycles you go through, the more accurate your forecasting becomes.
Tools That Make Forecasting Easier
If spreadsheets feel too manual, several Shopify-integrated tools can automate demand forecasting. Inventory Planner (now Sage) is the gold standard for Shopify inventory forecasting – it analyses your sales history, calculates optimal reorder points, and generates purchase orders automatically. Stocky (Shopify’s own inventory management tool, available on Shopify POS Pro) handles basic demand forecasting and purchase order management. For larger stores, tools like Brightpearl or TradeGecko (now QuickBooks Commerce) offer full inventory management with forecasting built in.
Forecasting Around Australian Seasonality and Shipping Lead Times
Generic forecasting advice assumes a Northern Hemisphere calendar. If you run an Australian store and you copy a US template, your safety stock peaks in the wrong months and your reorder dates land three weeks late.
Build your seasonal curve off the Australian retail year. The demand spikes that matter here are Click Frenzy in May, EOFY in June, Black Friday and Cyber Monday in late November, the Christmas run through to about 18 December, and Boxing Day into January. Most Aussie DTC stores see November and December sitting at 1.6x to 2.2x an average month, with a genuine trough in February. If you sell anything seasonal (swimwear, outdoor, heating, gifting) the swing is far steeper again. Pull 24 months of Shopify sales by month, divide each month by the 12-month average, and you have your seasonal index in about fifteen minutes.
Then work backwards from the freight calendar, not the sales calendar. Sea freight from China to Sydney or Melbourne typically runs 30 to 45 days port to port, plus 7 to 14 days for customs, quarantine and inland transport. Add your supplier’s production window of 20 to 45 days and Chinese New Year, which shuts most factories for two to four weeks somewhere between late January and mid February. That means BFCM stock realistically needs a purchase order in the water by mid August, and your Christmas top-up order placed before your October sales data exists. You are forecasting on incomplete information by design, which is exactly why safety stock matters more here than in a domestic supply chain.
Use two lead times, not one. Air freight at 5 to 10 days costs roughly 4 to 8 times sea freight per kilo, but it is a legitimate insurance policy on your top five SKUs. The practical approach: forecast and order the bulk by sea, then keep an air-freight trigger written into your plan. If a best seller drops below two weeks of cover in November, you air-freight a partial order and accept the margin hit rather than losing the sale and the lifetime value behind it. A 30% freight cost on 200 units beats a stockout on your highest-traffic product during your highest-traffic fortnight.
One more Australian wrinkle worth pricing in: exchange rate movement. Most Aussie stores buy in USD and sell in AUD. A 5% move in AUD/USD between the day you forecast and the day you pay your supplier changes your landed cost more than most of the margin optimisations you will run all year. If you are placing orders more than 60 days out, talk to your bank or a provider like Wise or OFX about a forward contract on your larger POs.
The Weekly Inventory Rhythm That Prevents Stockouts
Forecasting fails in practice for a boring reason: nobody looks at it between orders. The fix is a 20 minute weekly review that any operator or VA can run. Same day, same report, every week.
- Weeks of cover, per SKU. Current units divided by average weekly units sold over the last 8 weeks. This single number replaces most of the dashboard. Anything under 4 weeks of cover on a core SKU goes on the action list immediately.
- Velocity change. Compare the last 4 weeks against the prior 4. A SKU accelerating more than 25% needs its reorder point recalculated now, not at the next monthly review. Ad spend changes, a good creative, or a press mention can double velocity inside a fortnight.
- Sell-through on new products. For anything launched in the last 90 days you have no history, so watch sell-through percentage instead. Under 20% sold at the 30-day mark means you over-ordered and should plan a promotion. Over 60% means reorder yesterday.
- Open purchase orders and their ETAs. Every PO gets a confirmed ship date and an expected landed date. Chase anything that has slipped more than 7 days, because a slipped PO is a stockout you can still prevent.
- Dead stock. Anything with zero sales in 60 days. Bundle it, discount it, or write it off. Cash trapped in dead stock is the most expensive money in the business.
Set the alert thresholds inside Shopify or your forecasting tool so the review starts from an exception list rather than a full catalogue scan. Inventory Planner, Stocky and Cogsy all support low-stock alerting by weeks of cover. If you are still in a spreadsheet, conditional formatting on the cover column does the same job for free.
The final piece is money. A forecast that says order 400 units is useless if the cash is not there in the week the deposit is due. Line your reorder calendar up against an 8-week rolling cash flow forecast so you can see the deposit and balance payments coming before they arrive. Where a large seasonal buy is genuinely bigger than your cash position, that is a financing conversation, not a forecasting one, and there are structured ways to fund inventory that do not involve maxing a personal credit card in October.
Better forecasts also make you a better customer to your suppliers. Turning up with a 6-month rolling forecast instead of a panic order is one of the strongest negotiating levers you have for improving unit price, payment terms or MOQ.
Forecast to Grow, Not Just to Survive
Good inventory forecasting does more than prevent stockouts – it frees up cash, reduces waste, and gives you the confidence to scale your marketing knowing the inventory will be there to fulfil the orders. It is one of those operational improvements that quietly makes everything else in your business work better. Start with the moving average method, add safety stock for your best sellers, and set reorder points that account for supplier lead times. Within 2-3 months, you will wonder how you ever managed inventory without a system.
Inside eCommerce Circle we help hundreds of Aussie Shopify founders build forecasting models that account for freight windows, seasonality and the cash behind the order. If your inventory still runs on gut feel, let’s talk.