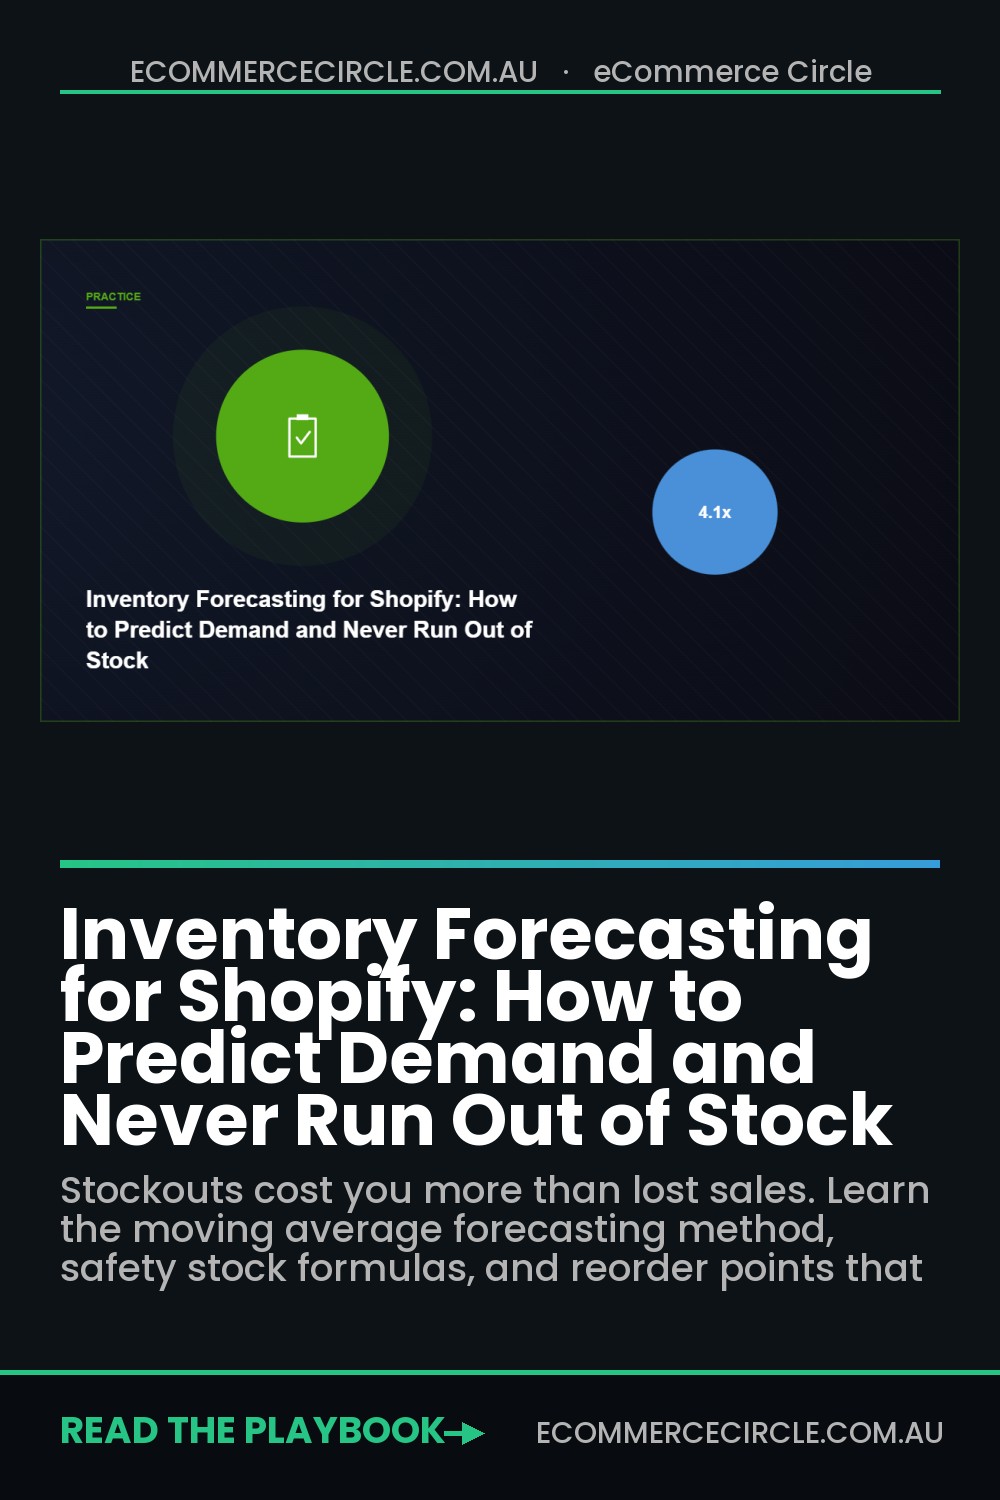
Running out of stock on your best seller during your busiest month is one of the most expensive mistakes a Shopify store can make. Not only do you lose the immediate sales, but you lose the momentum — your ads stop converting, your organic rankings can drop, and customers who wanted your product buy from a competitor and may never come back. On the flip side, overstocking ties up cash that could be used for marketing and growth, and risks dead inventory that you eventually have to discount to clear.
What’s in This Article
Inventory management is the balancing act most Shopify store owners never master. They order based on gut feel, reorder too late, and live in a constant cycle of stockouts and overstock. The stores that scale efficiently have moved beyond guesswork to data-driven inventory forecasting — and it is not as complicated as it sounds.
With 6-12 months of sales data and a simple forecasting framework, you can predict demand accurately enough to reduce stockouts by 80% and cut excess inventory by 30-40%. Here is how to build an inventory forecasting system for your Shopify store.
The True Cost of Getting Inventory Wrong
Before diving into forecasting methods, let us quantify what bad inventory management actually costs your business.
Stockout costs are higher than you think. When a product is out of stock, you lose not just the sale but the customer acquisition cost you spent to get them there. If you spent $30 in ads to drive a customer to a product page that shows “Sold Out,” that $30 is wasted. For a store with $5,000 per month in stockout-related lost sales, the true cost including wasted ad spend, lost customer lifetime value, and organic ranking damage can be $8,000-$12,000 per month.
Overstock costs are sneaky. Cash locked in slow-moving inventory cannot be spent on marketing or new products. If $50,000 of your capital is sitting in excess inventory, that is $50,000 that could be generating returns elsewhere. Add storage costs, the risk of products becoming outdated or damaged, and the eventual markdown to clear them, and overstock can quietly erode 5-10% of your annual revenue.
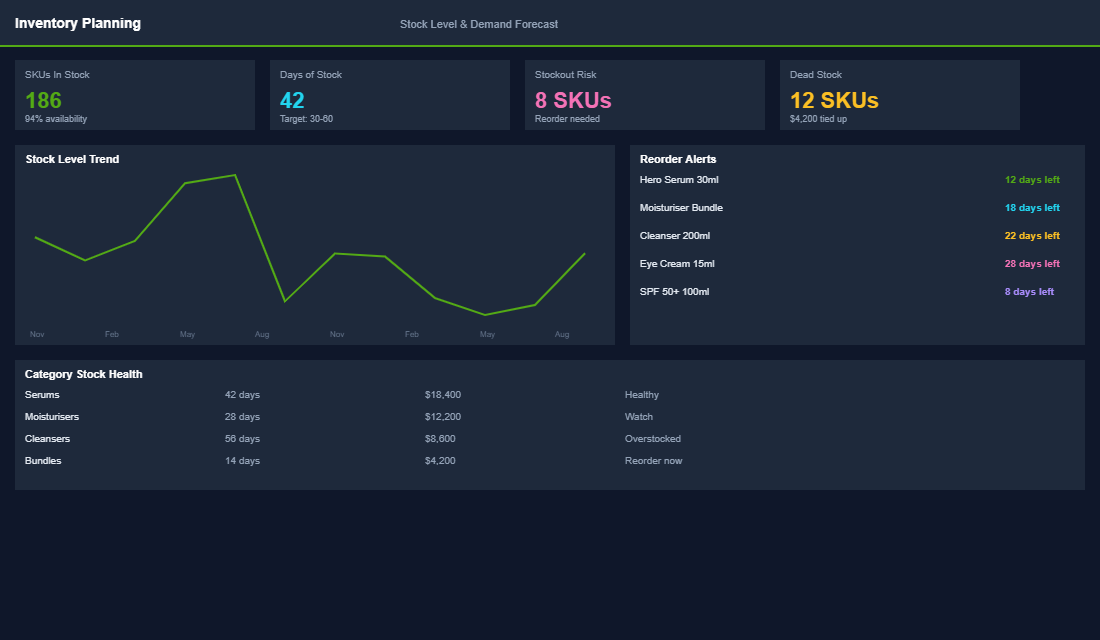
The sweet spot. Most successful Shopify stores target 4-8 weeks of inventory on hand for their core products, with 2-4 weeks of safety stock for best sellers. Getting to this level of precision requires forecasting — which starts with understanding your historical sales patterns.
Basic Demand Forecasting: The Moving Average Method
You do not need fancy software to start forecasting demand. The moving average method works well for most Shopify stores and requires nothing more than a spreadsheet.
Step 1: Pull your sales data. Export monthly sales by product (or SKU) from Shopify for the last 6-12 months. The more data you have, the more accurate your forecast.
Step 2: Calculate the 3-month moving average. For each product, average the last 3 months of sales. This smooths out week-to-week fluctuations and gives you a reasonable baseline for expected demand. If a product sold 120, 140, and 130 units over the last 3 months, your moving average is 130 units per month.
Step 3: Apply a growth factor. If your store is growing, your historical sales underestimate future demand. Apply a growth multiplier based on your month-over-month growth rate. If you are growing at 10% per month, multiply your moving average by 1.1 to get your adjusted forecast: 130 x 1.1 = 143 units.
Step 4: Add seasonal adjustments. If you have 12+ months of data, calculate seasonal factors by comparing each month to the annual average. If December typically sells 1.8x your average month, multiply your base forecast by 1.8 for December. Without seasonal data, research industry seasonality patterns for your category and apply conservative estimates.
Safety Stock: Your Insurance Against Uncertainty
No forecast is perfect. Safety stock is the buffer that protects you from forecast errors and supply chain delays. The right amount depends on two factors: how variable your sales are and how reliable your supplier is.
The simple safety stock formula: Safety Stock = Average Daily Sales x Safety Factor x Lead Time Variability. For most Shopify stores, a safety factor of 1.5-2.0 works well. If you sell 5 units per day of a product, your supplier lead time varies by plus or minus 7 days, and you use a safety factor of 1.5, your safety stock is: 5 x 1.5 x 7 = 52.5 units (round up to 53).
Increase safety stock for best sellers. The cost of stocking out on your top 20% of products (which likely drive 80% of revenue) is disproportionately high. Use a higher safety factor (2.0-2.5) for your best sellers and a lower factor (1.0-1.5) for slower movers.
Setting Reorder Points and Order Quantities
Your reorder point tells you when to place a new order. Your order quantity tells you how much to order. Together, they keep your inventory flowing smoothly.
- Reorder Point = (Average Daily Sales x Lead Time) + Safety Stock. If you sell 5 units per day, your supplier lead time is 21 days, and your safety stock is 53 units, your reorder point is: (5 x 21) + 53 = 158 units. When your inventory hits 158 units, it is time to reorder.
- Economic Order Quantity (simplified): Order enough to cover your forecasted demand for the period until your next order, plus safety stock. If you want to order monthly: Monthly Forecast + Safety Stock – Current Inventory = Order Quantity. If your forecast is 143 units, safety stock is 53, and current inventory is 80, order 116 units.
- Factor in minimum order quantities. Many suppliers have MOQs that may exceed your immediate needs. If your MOQ is 200 units but you only need 116, you have two choices: order the MOQ and accept higher inventory levels, or negotiate a lower MOQ (often possible for established relationships). Calculate whether the extra inventory cost is offset by better per-unit pricing at higher volumes.
- Review and adjust monthly. Forecasting is not set-and-forget. Review your forecasts against actual sales monthly, adjust your growth factors, and recalculate reorder points. The more cycles you go through, the more accurate your forecasting becomes.
Tools That Make Forecasting Easier
If spreadsheets feel too manual, several Shopify-integrated tools can automate demand forecasting. Inventory Planner (now Sage) is the gold standard for Shopify inventory forecasting — it analyses your sales history, calculates optimal reorder points, and generates purchase orders automatically. Stocky (Shopify’s own inventory management tool, available on Shopify POS Pro) handles basic demand forecasting and purchase order management. For larger stores, tools like Brightpearl or TradeGecko (now QuickBooks Commerce) offer full inventory management with forecasting built in.
Forecast to Grow, Not Just to Survive
Good inventory forecasting does more than prevent stockouts — it frees up cash, reduces waste, and gives you the confidence to scale your marketing knowing the inventory will be there to fulfil the orders. It is one of those operational improvements that quietly makes everything else in your business work better. Start with the moving average method, add safety stock for your best sellers, and set reorder points that account for supplier lead times. Within 2-3 months, you will wonder how you ever managed inventory without a system.
Inside the eCommerce Circle, inventory management and forecasting is part of our Product pillar. We help members build forecasting spreadsheets, set up inventory tools, and plan for seasonal demand spikes so they never miss a sale due to stockouts. If your inventory feels like a guessing game, our coaching brings the data-driven structure your business needs.