You look at your Shopify dashboard and see revenue climbing. Orders are up. Your ads are working. Everything looks great — until you check your bank account and wonder where all the money went.
What’s in This Article
This is the unit economics problem. And it quietly kills more Aussie ecommerce brands than bad ads, ugly websites, or slow shipping ever will. The median direct-to-consumer brand nets just 3 to 10% after all expenses are accounted for — and most store owners have no idea where the other 90% disappears to.
The brands that scale profitably aren’t the ones with the highest revenue. They’re the ones who know exactly what every single order costs them — and they’ve built their entire operation around improving that number. Here’s how to do the same.
Why Gross Margin Is Lying to You
Most Shopify store owners calculate their margin the same way: take the selling price, subtract the product cost, and call the difference “profit.” If you’re buying a product for $15 and selling it for $50, that looks like a 70% margin. Feels good, right?
But that number is dangerously incomplete. It ignores the packaging that costs you $3.50 per unit. The $9.95 shipping you’re subsidising. The 2.9% plus 30 cents Shopify takes on every transaction. The $8 it costs to process a return. And the $45 to $70 you spent acquiring that customer through Meta or Google ads in the first place.
When you stack all of these real costs against that $50 order, your “70% margin” can shrink to single digits — or even go negative on first-time orders. That’s not a pricing problem. It’s a visibility problem. You can’t fix what you can’t see, and most Shopify stores are flying completely blind on their true per-order costs.
The 7 Hidden Costs Inside Every Order
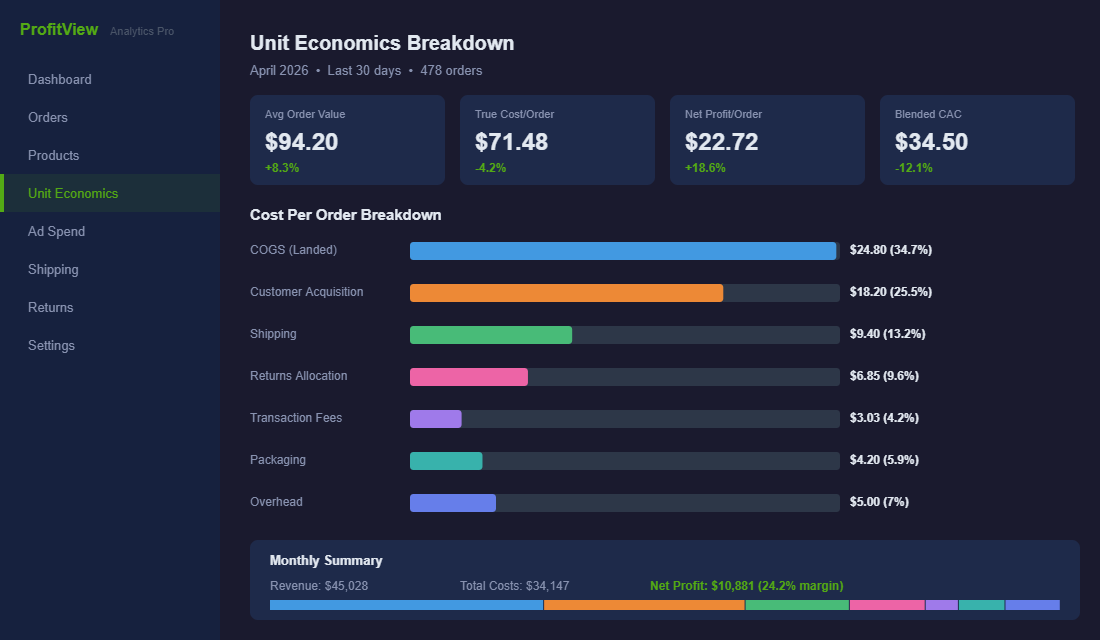
To understand your real unit economics, you need to account for every cost that touches an order. Not just the obvious ones — all of them. Here are the seven cost layers that determine whether your business actually makes money.
1. Cost of Goods Sold (COGS)
This is your landed product cost — what you pay your supplier, plus inbound freight, customs duties, and any import taxes. For Australian brands importing from Asia, tariff increases through 2025 and 2026 have pushed landed costs up significantly. Your COGS isn’t just the number on your supplier’s invoice. It includes everything it takes to get that product sitting in your warehouse, ready to ship.
2. Packaging and Fulfilment
Branded mailers (and knowing when to outsource fulfilment to a 3PL), tissue paper, thank-you cards, stickers, bubble wrap, and the labour to pick, pack and ship each order. If you’re using a 3PL, this is a line item on their invoice. If you’re doing it yourself, you need to calculate the real cost of materials plus your time (or your team’s hourly rate). Most brands underestimate this by 30 to 50% because they forget about the small stuff that adds up fast.
3. Outbound Shipping
Whether you offer free shipping (absorbing the full cost), flat-rate shipping (absorbing the difference), or pass the cost through to customers, shipping still hits your unit economics. Australian domestic shipping through Australia Post or Sendle typically runs $8 to $15 for standard parcels, depending on weight and zone. Carrier surcharges from major providers have raised average per-shipment costs further in 2025 and 2026. If you’re offering free shipping on orders over $80, you’re eating $10 or more on every qualifying order.
4. Transaction and Payment Processing Fees
Shopify charges payment processing fees of 2.4% to 2.9% plus 30 cents per transaction, depending on your plan. If you’re using a third-party payment gateway instead of Shopify Payments, you’ll also cop an additional 0.5% to 2% transaction fee on top. On a $100 order, that’s $3.20 to $5.20 gone before you’ve done anything else. Over thousands of orders, this quietly compounds into tens of thousands of dollars per year.
5. Returns and Exchanges
Returns are the silent margin killer in ecommerce. Each return generates costs across five layers: return shipping ($5 to $15), processing labour ($8 to $15), restocking and refurbishment ($2 to $10), potential write-off on unsaleable inventory, and customer service time ($2 to $5 per interaction). At a 25% return rate with $35 average processing cost, the per-order returns allocation on a $75 average order value works out to roughly $8.75 — even on orders that don’t get returned. You need to spread this cost across all orders to see the true picture.
6. Customer Acquisition Cost (CAC)
This is the big one — and it’s getting more expensive every year. The average ecommerce customer acquisition cost now sits between $45 and $70 for direct-to-consumer brands, though it varies wildly by vertical. Pet products average around $23, beauty sits at $42, food and beverage at $51, and supplements can run as high as $89 per customer acquired.
The trend isn’t improving either. Customer acquisition costs have increased by 263% over the past nine years, driven by iOS privacy changes, ad auction inflation from mega-retailers, and rising CPCs across Google and Meta. Meta’s CPM hit $10.88 in 2025 — up 19.2% year-over-year. If you’re not factoring this into your per-order costs, you’re massively overstating your profitability.
7. Overhead Allocation
Your Shopify subscription, app stack, email platform, warehouse rent, insurance, and software tools all need to be divided across your order volume. If you’re paying $400 per month in Shopify apps and processing 500 orders, that’s 80 cents per order. Seems small, but stack that on top of everything else and it matters. Most brands run 10 to 20 Shopify apps and have no idea what they’re actually paying in total.
How to Calculate Your True Cost Per Order
Here’s the formula that gives you the real number — not the comfortable one your gross margin suggests:
True Cost Per Order = COGS + Packaging + Shipping + Transaction Fees + Returns Allocation + CAC + Overhead Allocation
Let’s run through a realistic example for an Australian Shopify brand selling a physical product at $85 average order value:
- COGS (landed): $22.00 — product cost plus inbound freight and duties
- Packaging and fulfilment: $4.50 — branded mailer, tissue paper, pick and pack labour
- Outbound shipping: $9.50 — Australia Post standard parcel (subsidised free shipping)
- Transaction fees: $2.77 — Shopify Payments at 2.9% plus $0.30 on an $85 order
- Returns allocation: $5.25 — based on a 15% return rate with $35 average return cost
- Customer acquisition cost: $38.00 — blended CAC across Meta, Google, and organic
- Overhead allocation: $3.20 — apps, software, and fixed costs spread across order volume
Total true cost per order: $85.22
On an $85 order, this brand is actually losing 22 cents per order on first-time customer purchases. That “healthy” gross margin of 74% has evaporated entirely. The only way this business survives is if customers come back and buy again — because the second and third orders don’t carry the CAC burden.
This is why unit economics matter more than revenue. A store doing $50,000 per month can be less profitable than a store doing $20,000 — if the smaller store has tighter unit economics and better repeat purchase rates.
The Benchmarks You Should Be Hitting
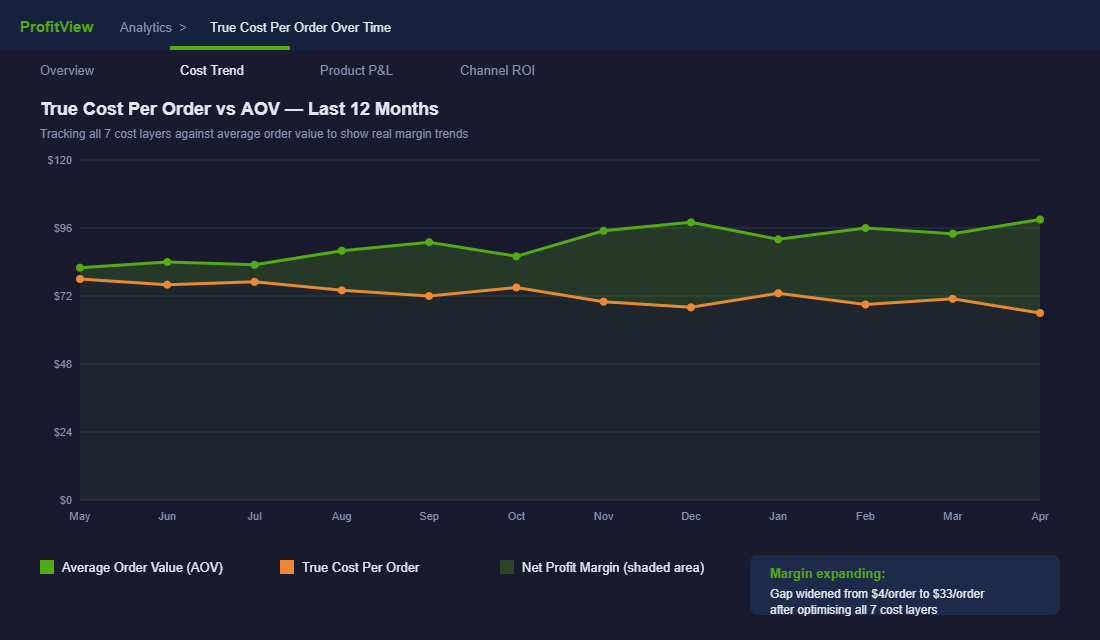
Once you’ve calculated your true cost per order, you need something to measure it against. Here are the benchmarks that separate profitable Shopify brands from those slowly bleeding cash:
- COGS as a percentage of revenue: Aim for 25 to 40%. If your COGS is above 50% of your selling price, your margins are too thin to absorb the other cost layers.
- Blended CAC-to-AOV ratio: Your customer acquisition cost should be no more than 30 to 40% of your average order value. If CAC exceeds AOV, you’re paying more to get the customer than they spend.
- Return rate: Industry average sits around 20 to 30% for fashion and apparel, 5 to 15% for most other categories. If yours is above average, fixing returns (better sizing guides, better product descriptions, better photography) has a direct impact on unit economics.
- Net profit per order: After all seven cost layers, aim for $8 to $15 net profit per order on first purchase, or at minimum break-even with a clear path to profitability through repeat orders.
- LTV-to-CAC ratio: The gold standard is 3:1 or higher. If a customer’s lifetime value is $150, your CAC should be under $50. Below 2:1, you’re on borrowed time.
The average Shopify store converts at 1.4% to 1.8%, which means you’re paying for a lot of traffic that doesn’t buy. Top-performing stores in the 90th percentile hit 4.7% or higher — and that conversion rate improvement alone can cut your effective CAC in half without spending an extra dollar on ads.
How to Track This Without a Spreadsheet Nightmare
Calculating unit economics manually is painful. You’d need to pull data from Shopify, your ad platforms, your shipping provider, and your accounting software — then reconcile it all in a spreadsheet that breaks every time you update it.
The better approach is to use a dedicated profit tracking app that automates the heavy lifting. The standout option for Shopify stores in 2026 is TrueProfit.
TrueProfit connects directly to your Shopify store and automatically syncs ad spend from Meta, Google, and TikTok. It tracks COGS, shipping costs, transaction fees, and custom expenses — then calculates your real net profit per order, per product, and per day in a live dashboard. No CSV imports, no manual reconciliation.
Here’s how to set it up:
- Step 1: Install TrueProfit from the Shopify App Store and connect your store.
- Step 2: Link your ad accounts (Meta Business Manager, Google Ads, TikTok Ads) for automatic spend syncing.
- Step 3: Enter your COGS per product — either manually or via bulk CSV upload. Set your landed cost including duties and inbound freight.
- Step 4: Add your fixed expenses (Shopify plan, apps, software subscriptions, warehouse costs) so they’re allocated across your order volume automatically.
- Step 5: Set up your shipping cost rules — either flat rates per zone or connect your carrier account for actual costs.
Within 24 hours, you’ll have a real-time profit dashboard that shows you exactly what every order, every product, and every ad campaign is truly earning you. For brands also wanting deeper lifetime value and cohort analysis, Lifetimely (now part of the Amp platform) pairs well with TrueProfit — giving you both the per-order and the per-customer profitability view.
Five Moves That Improve Your Unit Economics Fast
Once you can see your true cost per order, you can start pulling the right levers. Here are five high-impact moves that improve your unit economics within 30 to 90 days:
1. Increase Your Average Order Value
Many of your per-order costs are fixed or semi-fixed. Packaging costs roughly the same whether someone buys one item or three. Shipping might go up slightly, but not proportionally. Transaction fees scale linearly but CAC stays flat — you paid the same amount to acquire that customer whether they spend $60 or $120. Pushing AOV up through bundles, upsells, and free shipping thresholds is the single fastest way to improve unit economics because it spreads your fixed costs across more revenue.
2. Reduce Your Blended CAC Through Retention
If a customer buys from you three times instead of once, your effective CAC per order drops from $45 to $15. This is why email marketing and retention programs matter so much — not because they generate “nice to have” revenue, but because they’re the primary mechanism for making your unit economics work. A well-built post-purchase email sequence and loyalty program can improve repeat purchase rates by 25 to 40%, which directly slashes your blended cost per acquisition.
3. Negotiate Better Shipping Rates
Most Australian Shopify brands accept default carrier rates without negotiating. Once you’re shipping 100 or more orders per month, you have enough volume to negotiate directly with Australia Post’s eParcel program or platforms like Sendle, ShipStation, or Starshipit that aggregate volume across merchants. Even a $1.50 per-parcel saving across 500 monthly orders is $750 straight to your bottom line — every single month.
4. Fix Your Return Rate
Every percentage point reduction in your return rate improves unit economics twice — you save on return processing costs AND keep the original sale. The biggest return reduction wins come from better product photography (showing scale and detail), more specific sizing guides (with actual measurements, not just S/M/L), and honest product descriptions that set accurate expectations. Brands that invest in these areas routinely cut return rates by 20 to 30% within a single quarter.
5. Audit Your App Stack
Open your Shopify admin, go to Settings, then Billing, and look at your monthly app charges. Most store owners are shocked to find they’re spending $300 to $800 per month on apps — many of which overlap in functionality or aren’t being used at all. Cutting even three redundant apps at $30 each saves you $1,080 per year and directly reduces your overhead allocation per order. Do this audit quarterly.
The Compound Effect: When Unit Economics Work Together
Here’s where it gets exciting. None of these levers work in isolation — they compound on each other.
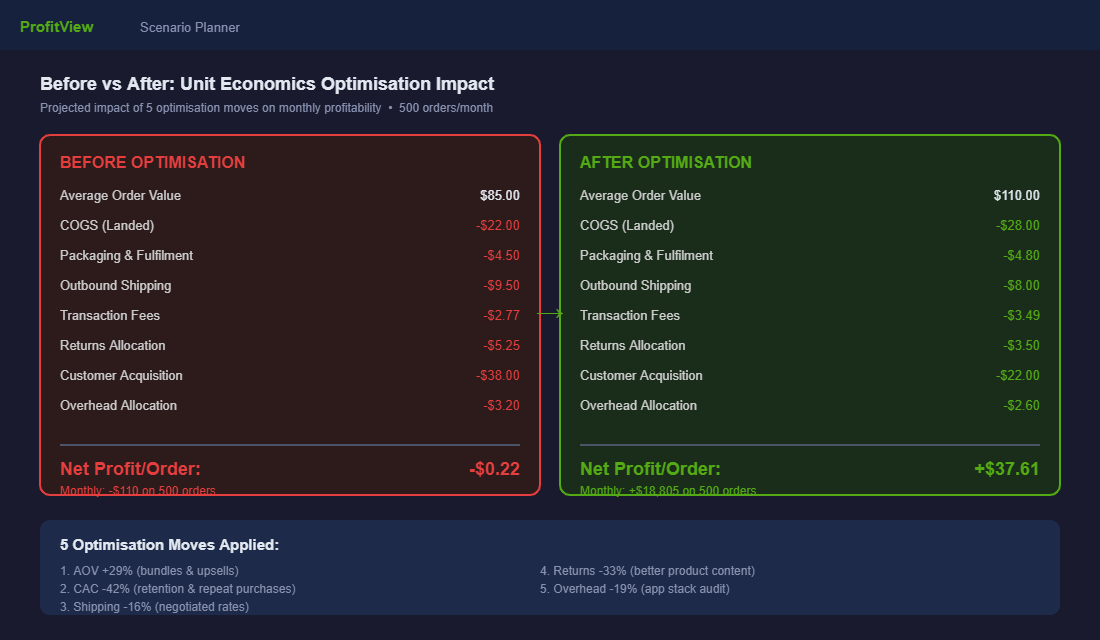
When you increase AOV from $85 to $110, your fixed costs (packaging, CAC, overhead) now represent a smaller percentage of each order. When you simultaneously improve repeat purchase rates from 20% to 35%, your blended CAC drops because returning customers cost almost nothing to acquire. And when you tighten returns and negotiate shipping, you’re pulling another few dollars of cost out of every order.
Let’s revisit our earlier example with modest improvements across all five levers:
- AOV increased to $110 (from $85 — through bundles and upsells)
- COGS: $28.00 (slightly higher for larger orders)
- Packaging: $4.80
- Shipping: $8.00 (negotiated rate)
- Transaction fees: $3.49
- Returns allocation: $3.50 (reduced return rate)
- Blended CAC: $22.00 (improved by 42% through repeat purchases)
- Overhead: $2.60 (trimmed app stack)
New true cost per order: $72.39
Net profit per order: $37.61
That’s a swing from losing 22 cents per order to making $37.61. Same business, same products, same market — just better unit economics. At 500 orders per month, that’s the difference between bleeding cash and banking $18,805 in monthly profit.
This is what separates the Shopify brands that scale from the ones that stall. It’s not about spending more on ads or launching more products. It’s about understanding exactly what every order costs you — and systematically improving each cost layer until the maths works in your favour.
Your Unit Economics Action Checklist
Use this checklist to audit your unit economics this week. Print it, pin it to your wall, and revisit it monthly:
- ☐ Calculate your true COGS per product — include landed cost, duties, and inbound freight
- ☐ Audit packaging costs per order — materials plus labour, not just the mailer
- ☐ Document your real shipping cost per order — actual carrier charges, not what you charge customers
- ☐ Check your Shopify transaction fee tier — are you on the right plan for your volume?
- ☐ Calculate your return rate and per-return cost — spread across all orders, not just returned ones
- ☐ Calculate your blended CAC — total ad spend divided by total new customers
- ☐ Tally your monthly overhead — every app, tool, and fixed expense
- ☐ Add it all up — does your AOV cover your true cost per order?
- ☐ Install TrueProfit or Lifetimely — automate the tracking so you’re not guessing
- ☐ Set a monthly review cadence — unit economics change as your costs and volume shift
Build a Profit-First Ecommerce Business
Unit economics isn’t a spreadsheet exercise you do once and forget. It’s the foundation of every decision you make — what products to launch, how much to spend on ads, whether to offer free shipping, and when to hire your next team member.
Inside the eCommerce Circle, Profit is one of the 10 P’s we work through with every member. We help you map out your true unit economics, identify the biggest margin leaks, and build a plan to hit your profit targets — not just your revenue targets.
If you’re ready to stop guessing and start building a business that actually puts money in your pocket, let’s talk.