You have a hero product that works. It carries 60 or 70% of revenue, the ads are profitable, and the reorders are predictable. So the obvious next move is a second product. That is where a lot of good Aussie stores quietly lose a year and a big chunk of their cash.
What’s in This Article
The numbers are brutal. Around 30,000 new consumer products launch each year and only about 15% are still commercially viable after 24 months, which puts the failure rate somewhere between 70 and 85%. Nielsen’s read on why is the part that should worry you: most of those failures were not bad products. They failed on misread demand, weak positioning, or no real difference from what was already on the shelf.
Here is the pattern I see in Aussie stores doing 40k to 500k a month. The founder picks the second product from their own taste, a supplier catalogue, or a competitor’s bestseller list. They commit to a minimum order quantity of a few hundred units, wait 12 weeks for it to land, and then discover the thing their customers actually wanted was a refill pack of the product they already sell. The five filters below stop that happening.
Why Most Second Products Are Chosen Backwards
A first product usually gets chosen with real rigour. You had no revenue, no safety net, and you interrogated every assumption. A second product tends to get chosen the opposite way, because the business is working and confidence is high.
The three failure modes look like this:
- The founder-taste pick. You want it, so you assume they want it. Your taste got you here, which is exactly why it feels like evidence. It is not.
- The supplier-catalogue pick. Your factory already makes it, the MOQ is friendly, and the sample looks good on the shelf. Convenience is not demand.
- The competitor-copy pick. A rival launched something and it looks like it is selling. You cannot see their return rate, their contribution per unit, or the fact they are clearing it at cost.
Each of these skips the same step. Nobody asked what the existing customer base is already trying to buy and cannot. That is the only demand signal that comes with a warm audience, a proven ad account, and no new customer acquisition cost attached to it.
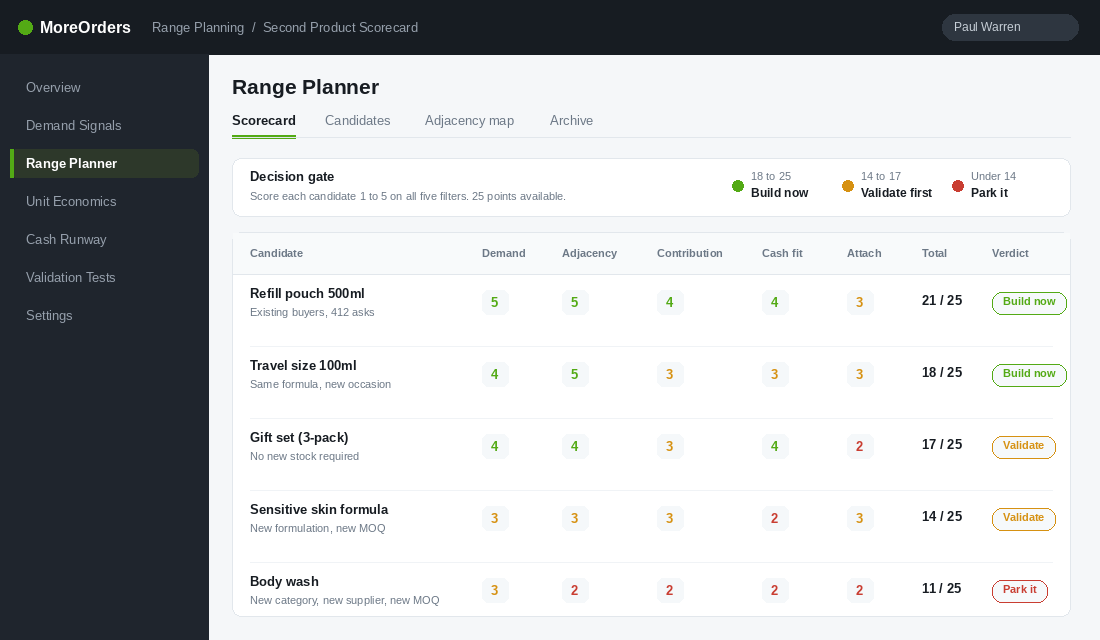
Run every candidate through five filters, score each one out of five, and you get a number out of 25 instead of a feeling. Anything at 18 or above is worth building. Anything from 14 to 17 gets validated before you spend. Below 14, park it and revisit in six months.
Filter 1: Demand, and Where the Signal Actually Lives
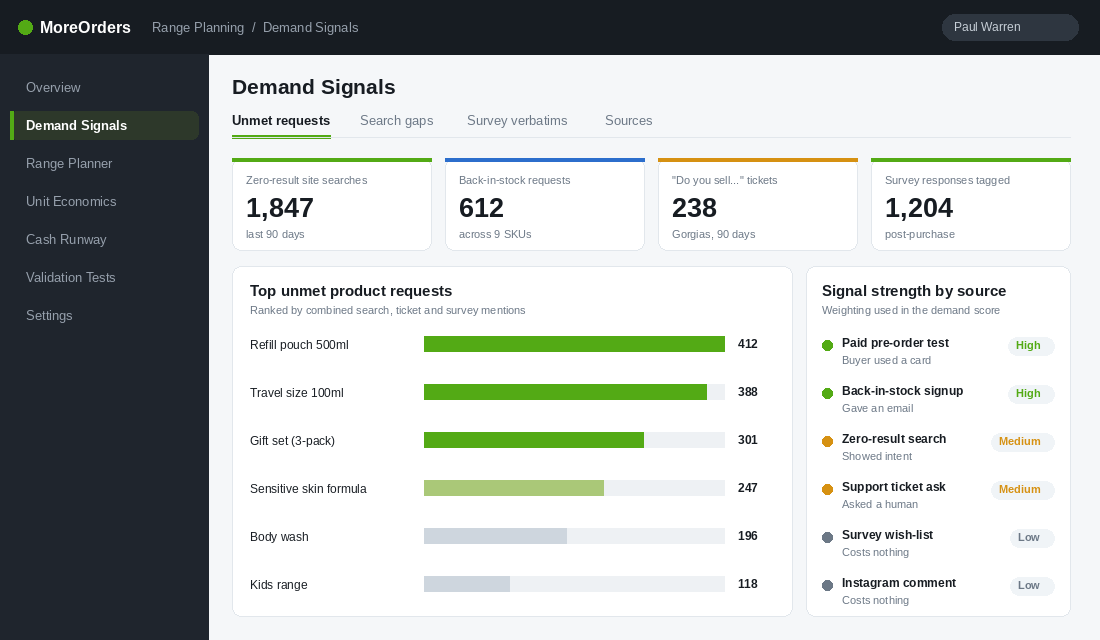
Your store is already collecting demand data for products you do not sell. Most founders never look at it.
Four sources, ranked by how much the signal cost the customer to send:
- Zero-result site searches. Someone typed a product name into your search bar and got nothing back. They were ready to buy and you had no answer.
- Back-in-stock and notify-me signups. They handed over an email address for a product that did not exist yet.
- Support tickets that start with “do you sell”. They cared enough to contact a human.
- Post-purchase survey answers. Cheapest signal of the four, but useful for confirming a theme you already suspect.
The tool for the first one is free and Shopify builds it. Install Search & Discovery from the Shopify App Store, then go to Apps, open Search & Discovery, and click the Analytics tab. You get two reports: “Top online store searches” and “Top searches with no results”. Set the range to the last 90 days and export both.
Read the zero-result list line by line and bucket it. Ignore misspellings of products you already stock. What you are hunting for is a repeated noun that is not in your catalogue: a size, a format, a refill, a bundle, a variant. Anything with 50 or more searches in a quarter on a store doing 40k a month is a genuine signal, not noise.
Then add a single question to your post-purchase flow in Klaviyo, sent three days after delivery: “What is the one thing you wish we sold that we do not?” Free text, no multiple choice. Multiple choice tells you which of your ideas they prefer. Free text tells you what they actually want.
Filter 2: Adjacency, or How Far You Are Really Moving
Every second product moves you along two axes: the customer, and the job the product does. How far you move on each one decides how much of your existing business you can reuse.
- Same customer, same job (score 5). A refill, a larger size, a travel format, a multipack. You reuse the audience, the creative, the reviews, the freight lane and the supplier.
- Same customer, adjacent job (score 4). A product the same person needs in the same routine. Bondi Sands moving from self-tan into a 12-piece skincare range in December 2021 is the textbook version. Same customer, same bathroom shelf, adjacent job.
- Same customer, new job (score 3). Same buyer, unrelated use. You keep the list and lose the positioning.
- New customer, anything (score 1 to 2). You are starting a second business inside your first one and paying customer acquisition cost twice.
Who Gives A Crap is the cleanest Australian example of the top row. They started with recycled toilet paper and extended into tissues and paper towels. Same customer, same purchase occasion, same subscription box, same pallet. No new audience to buy and no new story to tell.
Bondi Sands is worth studying because they respected the distance. Moving into skincare meant hiring a dedicated head of skincare formulations, standing up separate social accounts, and running an “Everyday Influencer” series with real people documenting results at 24 hours, one week and four weeks. That is the cost of a one-step move. Founders who assume a category jump is free are the ones who end up with 400 units in the garage.
Score adjacency honestly. If the answer requires a new supplier, new compliance, new photography and new positioning, it is not a 5 no matter how good the idea feels.
Filter 3: Contribution, Before You Fall in Love With It
Most founders model the second product on gross margin and stop there. Gross margin will not tell you whether the product survives a paid ad, a free shipping threshold and a 6% return rate.
Build the contribution stack per unit at the price you actually intend to charge, in AUD, landed:
- Landed cost per unit. Factory price plus freight, duty, GST handling and inbound 3PL receipt. Not the factory quote on its own.
- Outbound freight. The real average, including the metro and regional split. A bulky refill pack can cost more to ship than the hero product it supports.
- Payment and platform fees. Roughly 1.7 to 2.4% for domestic card rates once buy now pay later mix is blended in.
- Returns and replacements. Use your actual store rate, not a hopeful one.
- Pick, pack and packaging. Including any new carton or insert the product forces.
What is left is contribution per unit. Now ask the only question that matters: at your current blended customer acquisition cost, can this product carry a cold ad on its own, or does it only work as an attachment to an existing order?
Both answers are fine. They just lead to completely different launches. A product that only works as an attachment should never get its own campaign budget. It should live in the cart drawer, the post-purchase upsell and the replenishment flow. Getting this wrong is how founders conclude a good product “failed” when the truth is they pointed cold traffic at something that was never going to survive a 45 dollar acquisition cost.
Before you add anything, it is worth running the reverse exercise on your existing range. Our SKU rationalisation playbook walks through cutting the slow movers first, and most stores free up more cash by removing three products than by adding one.
Filter 4: Cash, and What the MOQ Really Locks Up
This is the filter that kills otherwise good businesses, and it has almost nothing to do with whether the product sells.
Across 11 public DTC brands filing 10-Ks, the median days of inventory on hand sits at 133 days, with the 25th percentile at 79 days and the 75th at 169. That is the benchmark you are joining when you place a purchase order. Meanwhile ASIC’s insolvency data shows inadequate cash flow or high cash use was cited in 52% of administrator reports, and roughly two thirds of small businesses entering insolvency had no formal cash flow forecast at all. Profitable stores go under. Cash-poor stores go under faster.
So model the cash before the revenue. Three numbers:
- Cash out. MOQ multiplied by landed cost, split into deposit and balance. A 30% deposit with the balance on shipment is standard and worth asking for even if you have always paid up front.
- Days to first sale. Production lead time plus sea freight plus 3PL receipt and listing. For most Aussie stores importing from Asia, that is 10 to 16 weeks before a single unit is sellable.
- Days to cash back. Your forecast sell-through, plus settlement. Shopify Payments in Australia settles in a minimum of two business days once your account is established, with weekend captures consolidated into a single payout.
Now set the rule that protects you: no second product may lock up more than 15% of your available cash before it has proven demand. If the MOQ breaches that, you have three moves. Negotiate a sample or trial run at a higher unit cost. Split the order across two shipments. Or fund it with customer cash through pre-orders, which our pre-order playbook covers step by step.
Paying 12% more per unit on a smaller first run is not a worse deal. It is insurance, and it is far cheaper than discounting 300 units to clear them in March.
Filter 5: Attach, or Will Your Own List Actually Buy It
A second product has one enormous advantage over your first: you already own the audience. The probability of selling to an existing customer sits around 60 to 70%, against 5 to 20% for a new prospect. Existing buyers convert at somewhere between three and 14 times the rate of cold traffic.
That advantage is only real if the product fits how they already buy. So work out the attach maths before you launch, not after.
Take your 12-month buyer count. Apply a realistic first-90-day attach rate, which for a genuinely adjacent product on a warm list lands between 4 and 9%. Multiply by contribution per unit. If that number does not cover the purchase order inside 90 days, the product is not paying for itself on warm traffic and you are betting on cold acquisition to save it.
Category matters here. Consumables run repeat purchase rates of 22 to 44%, fashion sits at 10 to 17%, and durables at 7 to 18%. If your category repeat rate is at the low end, your attach rate will be too, and the second product needs to work harder on its own.
One more lever most stores ignore: 50.8% of consumers say early access to new products matters to them. Give your existing buyers a genuine 48-hour head start before the public launch. It lifts the attach rate, it gives you a clean read on warm demand before ad spend muddies the data, and it costs nothing.
The 21-Day Validation Sprint
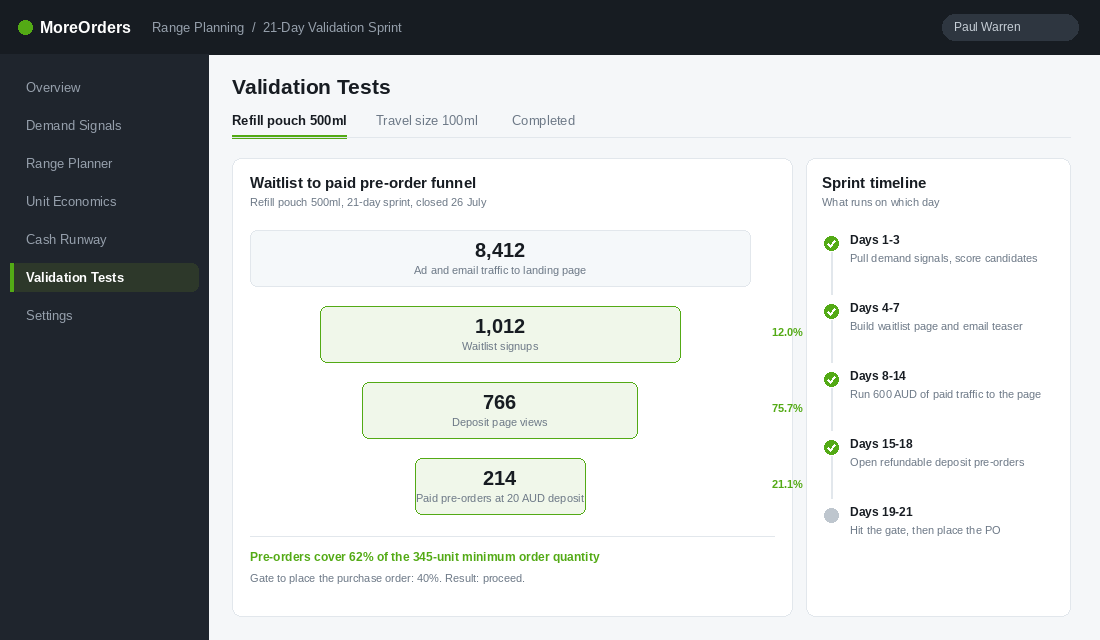
Anything scoring 14 to 17 does not get a purchase order. It gets a three-week test that costs about 600 dollars in traffic and answers the question with real money instead of opinions.
- Days 1 to 3. Pull the demand signals, score every candidate on all five filters, and pick one. Not three. One.
- Days 4 to 7. Build a single waitlist landing page. Real product name, real photography or a competent render, real price, real benefit copy. Email capture, no checkout yet.
- Days 8 to 14. Send it to a segment of past buyers, then put 600 dollars of paid traffic behind it. Two audiences: your customer list, and a lookalike. Keep them separate so you can read warm and cold demand independently.
- Days 15 to 18. Open a refundable deposit of 20 dollars against the full price. This is the moment the test becomes real. Emails are cheap and a card number is not.
- Days 19 to 21. Hit the gate or kill it.
The gate is simple: paid deposits must cover at least 40% of the minimum order quantity. Clear it and you place the purchase order with a third of it already funded by customers. Miss it and you have learned the same lesson for 600 dollars that most founders learn for 30,000.
Refund every deposit inside 48 hours if you do not proceed, and tell people plainly why. Handled well, a cancelled pre-order still buys you goodwill and a list of people who told you exactly what they want next.
How the Five Filters Compound Into a Range
Run this once and you have chosen a second product properly. Run it four times and you have something more valuable: a range with a shape.
Every strong catalogue I see in the Collective has four jobs covered, and each one is chosen on different filter weightings:
- The hero. Carries acquisition. Scores highest on contribution because it has to survive cold traffic.
- The attach. Lifts average order value in the cart and the post-purchase upsell. Scores highest on adjacency and attach. Never gets its own ad budget.
- The entry. Lowers the barrier for a first purchase. Trial sizes, samplers, single units. Thin contribution on purpose.
- The replenishment. Turns one order into a habit. Refills, multipacks, subscriptions. Scores highest on cash because it turns fastest.
Look at your catalogue against those four jobs. Most stores at 40k to 500k a month have three heroes and no attach, no entry and no replenishment. That is why average order value is flat and repeat purchase rate is stuck. The fix is not more products. It is the right four.
The compounding effect is real. A hero that acquires, an attach that lifts order value 15 to 30%, an entry that widens the top of the funnel and a replenishment that turns first orders into second ones does not just add revenue in four places. It raises what you can afford to pay for a customer, which reopens ad channels that were closed to you on the hero alone.
Your Second Product Scorecard
Copy this into a spreadsheet, put every candidate on its own row, and score each filter from one to five. No half marks and no arguing after the fact.
- Demand (1 to 5). 5 = 300 or more combined unprompted requests in 90 days. 3 = a clear theme but under 100 requests. 1 = your idea, nobody has asked.
- Adjacency (1 to 5). 5 = same customer, same job, same supplier. 3 = same customer, new job. 1 = new customer and new category.
- Contribution (1 to 5). 5 = survives cold traffic at your current acquisition cost. 3 = works as an attachment only. 1 = negative after freight and returns.
- Cash fit (1 to 5). 5 = MOQ under 5% of available cash or fundable by pre-order. 3 = 10 to 15%. 1 = over 20%.
- Attach (1 to 5). 5 = warm-list attach maths covers the PO inside 90 days. 3 = covers it inside 180. 1 = needs cold traffic to work.
Score 18 or above, build it. Score 14 to 17, run the 21-day sprint. Below 14, park it and write the date you will look again. Then pressure-test the supply side before you commit, because the best-scoring product in the world still fails if the supplier does. Our product sourcing playbook covers vetting properly.
The point of the scorecard is not precision. It is that it forces the argument to happen before the money leaves, in a room with numbers in it, instead of after the pallet arrives.
Inside eCommerce Circle, range decisions are one of the core pillars we work on with every member, because a badly chosen second product costs more than a bad ad account ever will. If you want a second opinion on what you are about to launch, let’s talk.