You know your best seller. You could name it in your sleep, and it probably sits at the top of your collection page, eats most of your ad budget and shows up first in every campaign you run.
What’s in This Article
Here is the uncomfortable question almost nobody asks: of the customers who bought that product first, how many ever came back? Most Aussie founders cannot answer that. They track repeat rate as one blended number for the whole store, which is a bit like judging your health by your average body temperature. The average ecommerce repeat purchase rate sits around 28.2%, but the range runs from 9.9% in luxury to 65.2% in grocery, so a single store-wide figure tells you almost nothing about what to actually change on Monday.
The brands that compound are the ones that worked out something specific: the product a customer buys first is the single biggest predictor of whether they buy again. Not the email flow. Not the loyalty app. The entry product. Get it right and your second-order rate lifts across every channel at once. Get it wrong and you are paying Meta to fill a bucket with a hole in the bottom.
What an Entry Product Actually Is (and Why Your Best Seller Might Be the Wrong One)
An entry product is whatever a first-time customer puts in the cart on order one. Not what you wish they bought. What they actually bought.
Most stores have three or four products doing the heavy lifting on acquisition, and they are rarely the same products that show up on order two. A discounted bundle can drive enormous first-order volume and produce almost no repeat customers, because the person who bought it was shopping for a discount, not for you. A gift box can convert beautifully in November and never return, because the buyer was never the user.
This matters more than it used to. Australians spent a record $69 billion online in 2024, up 12% on the year before, but the average basket dropped to $95, the lowest in a decade. More people are buying more often, in smaller amounts, and comparing harder. Winning a first order is getting cheaper and less meaningful at the same time. What you do with that first order is where the profit lives.
The economics are brutal and simple. Repeat buyers typically make up around 21% of an ecommerce customer base but generate roughly 44% of revenue, and the top 5% of customers can account for 35% of the total. Retaining a customer costs about five times less than acquiring a new one. So the entry product is not a merchandising detail. It is the front door to your entire retention system.
Step 1: Pull Your Real Entry Product Report
You do not need another app for this. Shopify gives you the two reports you need for free, and the whole exercise takes about 40 minutes the first time you run it.
Build the first-order product list.
- In Shopify admin, go to Customers and click Segments, then Create segment.
- Use the filter
number_of_orders is equal to 1combined withfirst_order_date betweenyour chosen window. Start with the 12 months ending 90 days ago, so every customer in the set has had a fair chance to return. - Save it as “First order only, trailing year”. Export to CSV.
- In a second segment, change the filter to
number_of_orders is greater than 1with the same date window. Save as “Repeated, trailing year”. Export. - Open both in a spreadsheet and match on customer ID. You now have, for every acquired customer, whether they returned.
Attach the first product. Export your orders for the same window (Orders then Export, include line items), sort by customer and date, and keep only each customer’s earliest order. The top line item on that order is your entry product. If a customer’s first order had multiple items, use the highest-value line, since that is the item that carried the decision.
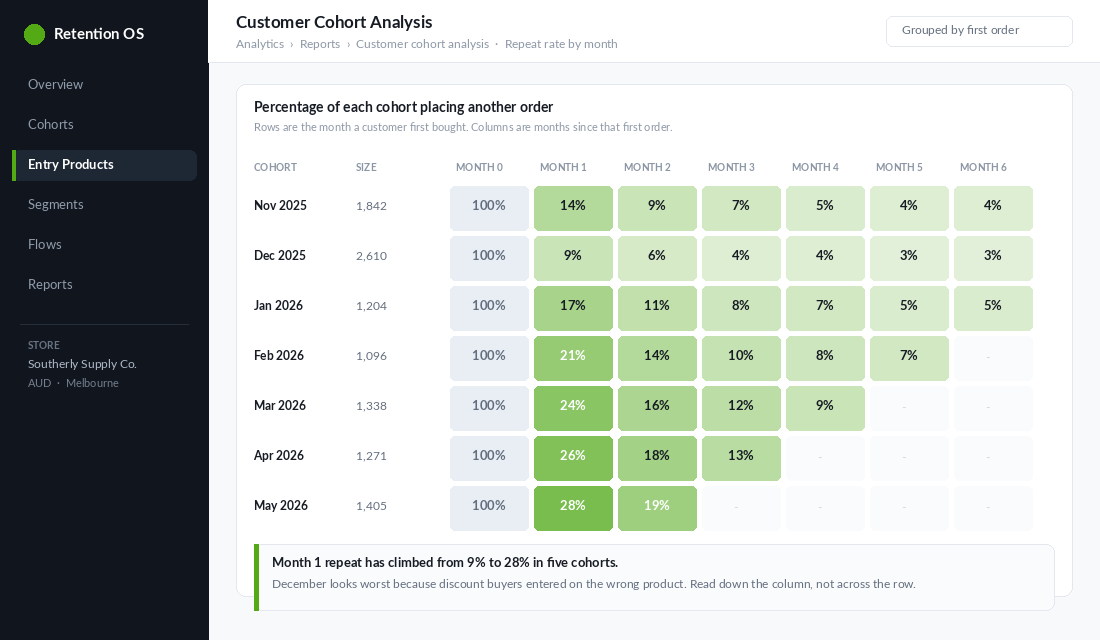
Then run the cohort report. Go to Analytics, then Reports, then Customer cohort analysis. Shopify groups buyers by the month of their first purchase and shows the percentage placing another order each month afterwards. It is free on every plan and it is the fastest sanity check you have. If you want the entry-product split done for you rather than in a spreadsheet, Lifetimely and Peel both slice retention by first product purchased out of the box, but do the manual version once first so you understand what the numbers mean.
Set a minimum sample of 200 first-time customers per entry product. Below that you are reading noise, and you will talk yourself into killing a good product on the strength of 40 orders.
Step 2: Score Every Entry Product on Four Signals
Repeat rate alone is not enough, because a product can produce loyal customers who each spend very little. Score every entry product with more than 200 first-time buyers on all four of these.
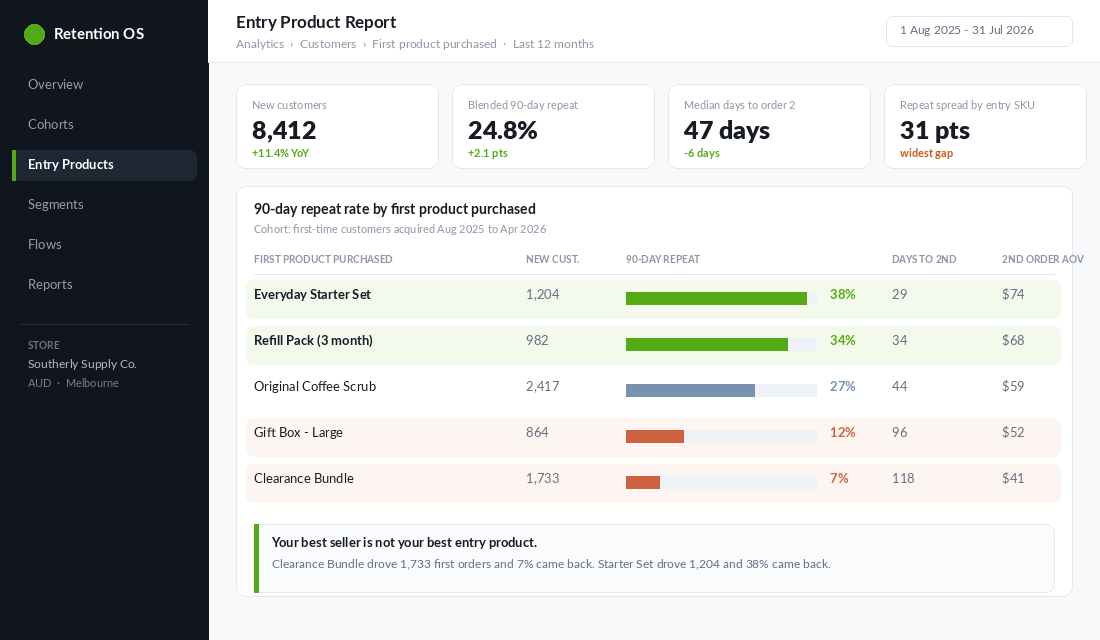
- 90-day repeat rate. What share of people whose first order contained this product placed a second order inside 90 days? This is your headline signal. Anything below your store blended average is a problem worth naming.
- Days to second order. The median gap between order one and order two for that entry product. Faster is better, and it tells you exactly when your follow-up should land.
- Second-order value. The average order value of order two. Some entry products produce customers who return but trade down forever. That is a pricing and positioning problem, not a retention one.
- Contribution runway. What is left after cost of goods, shipping and payment fees on order one. An entry product that loses money on the first order is fine if the repeat rate is strong. It is fatal if it is not.
Now sort by 90-day repeat rate and look at the spread. In most stores we work through, the gap between the best and worst entry product is 20 to 30 percentage points. That spread is the finding. It means your retention problem is not evenly distributed, and you can fix a large slice of it by changing what you put in front of cold traffic.
For benchmarking, a 12-month retention rate of roughly 25% to 35% is typical for ecommerce overall. Consumables such as supplements, skincare and food commonly reach 35% to 50%. Durables such as furniture and electronics sit closer to 15% to 25%. Use the band for your category, not the average of all categories.
Step 3: Read the Cohort Grid Down the Column, Not Across the Row
This is where most founders misread their own data. They look across a single row, watch the numbers decay from 100% to 5%, and conclude retention is bad. Every cohort decays. That is what cohorts do.
The signal is in the columns. Take the Month 1 column and read it top to bottom. If November was 14%, January 17%, March 24% and May 28%, your retention is genuinely improving and something you changed is working. If that column is flat or falling while revenue grows, you are not growing. You are renting customers.
Two things to watch for when you read it:
- The promotional cohort dip. Your November and December cohorts will almost always look worse. That is not seasonality being unfair to you. It is a signal that your discount entry products attract a different buyer. Segment those months out and score them separately.
- The channel overlay. Rebuild the same grid filtered by first-touch channel. Customers acquired on branded search and email almost always retain better than customers acquired on a broad prospecting campaign. If the gap is large, your blended cost per acquisition is hiding two very different businesses.
If you want the full method for turning these curves into a lifetime value number you can plan against, we walked through the calculation in the Shopify Customer Lifetime Value Playbook.
Step 4: Fix a Bad Entry Product With One of Three Levers
Once you have found an entry product with high volume and weak repeat, you have three moves. Pick one and commit for a full quarter, because entry product changes take a cohort cycle to show up.
Lever one: re-route the traffic. The cheapest fix. Stop pointing cold traffic at the weak product. Change the landing page on your prospecting campaigns, swap the featured product on the homepage hero, and reorder the collection page so the strong entry product sits in the first two positions on mobile. You are not deleting anything. You are changing which door people walk through.
Lever two: repackage the offer. If the weak product is genuinely your best introduction to the brand, the issue is usually format, not the product. Build a smaller trial size, a two-item starter set, or a bundle that pairs the acquisition product with the item most commonly bought on order two. You are compressing two purchases into one and using the second product to create a reason to return.
Lever three: reprice or restrict. Deep discount entry products often need a floor, not a rebuild. Cap the discount at a level that still leaves contribution on order one, move the offer behind an email signup so you at least capture the address, or restrict it to returning customers only. If a clearance bundle produces a 7% repeat rate, it is not an acquisition tool. It is inventory clearance, and it should be marketed to your existing list rather than to cold traffic.
One warning. Do not test all three at once across the whole store. Pick your single worst high-volume entry product, apply one lever, and hold everything else steady for 90 days so you can read the next cohort cleanly.
Step 5: Engineer the Second Order Inside 90 Days
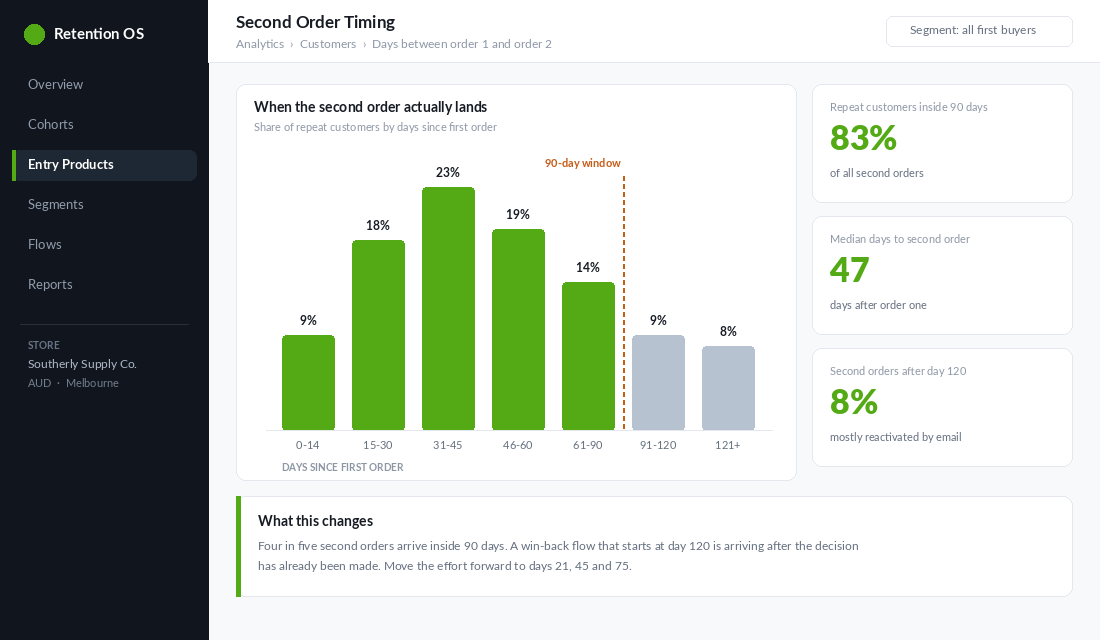
Here is the number that should reframe how you spend your time. After a first purchase, a customer has roughly a 27% chance of coming back. Once they place a second order, the probability of a third jumps to about 54%. The second order is the hinge. Everything after it gets easier and cheaper.
So build the follow-up around your actual median days-to-second-order, not a generic 30 day flow. If your median is 47 days, your sequence should look something like this.
- Day 3 to 5: usage, not selling. How to get the most out of the thing they bought. No offer. This is the email that decides whether they open the next four.
- Day 14: the natural next product. Not your best seller. The product that customers who bought this entry product actually buy second. Pull it from your own order data, one line of analysis per entry product.
- Day 30: social proof plus a reason. Reviews from customers who own the same item, paired with a specific use case. Still no discount.
- Day 45 to 50: the nudge. This is where a modest incentive earns its place, because you are sitting on the median. Free shipping or a small bundle beats a percentage off, because a percentage teaches people to wait.
- Day 75: last touch before lapse. After this the customer moves into your lapsed segment and a different sequence takes over.
The mechanics of the flows themselves, including segment definitions and send logic, are covered in the Shopify Repeat Purchase Playbook. And for the customers who slip past day 120 anyway, the Shopify Win-Back Playbook handles reactivation without torching your discount discipline.
Two Aussie Brands That Got the Entry Product Right
Frank Body. Five friends in Melbourne launched in 2013 with under $10,000 and one product: the Original Coffee Scrub. That single item became the entry point for an entire body care range. Everything else in the catalogue was built to be the second, third and fourth purchase for someone who had already tried the scrub. The lesson is not that you need a cult hero product. It is that Frank Body knew exactly which product started the relationship and merchandised everything else behind it.
Who Gives A Crap. The Australian toilet paper brand launched in 2012 and made the entry product a subscription box rather than a single pack. That one decision removes the second-order problem almost entirely, because order two is scheduled at the point of order one. Not every category can pull this off, but every consumable category should be asking the question. If your product runs out on a predictable schedule and you are still selling it one unit at a time, you are creating a repurchase decision you did not need to create.
Both brands are doing the same thing in different ways: making the first purchase carry the weight of the second.
The Compound Effect: Why This Beats Installing Another Retention App
Most retention work happens after the fact. You acquire whoever the algorithm sends, then try to rescue the relationship with email, SMS, loyalty points and a win-back offer. That work is worth doing, and it is also downstream of a decision you already made when you chose what to advertise.
Entry product work is upstream. When you shift cold traffic from a 7% entry product to a 34% one, every flow you have already built starts performing better without you touching a single email. Your welcome sequence converts higher because the audience is better. Your loyalty program gets more enrolments because more people reach order two. Your paid media looks more efficient on a 90-day view because the customers coming in are worth more.
That is the compounding. A five percentage point lift in retention is commonly associated with a 25% to 95% lift in profit, and the entry product is one of the few levers that can move retention by more than five points in a single quarter. It costs nothing to implement beyond the analysis and a merchandising change. If you are tracking this weekly, it belongs on the same dashboard as the rest of your numbers, which we set up in the Shopify Weekly Scorecard Playbook.
The Entry Product Scorecard: Copy This
Build this as a five column table in a spreadsheet, one row per product with more than 200 first-time buyers in your trailing year. Run it quarterly.
- Column 1: Entry product. The product name and the number of first-time customers it acquired.
- Column 2: 90-day repeat rate. Percentage who placed a second order within 90 days. Colour anything below your store average.
- Column 3: Median days to order two. Sets the timing of your follow-up sequence for that product.
- Column 4: Second order value. Average order value on order two, so you can spot products that create loyal low spenders.
- Column 5: Verdict and lever. One of four: Scale, Hold, Re-route, or Retire. Plus the single lever you are applying this quarter.
Then the four rules that turn the scorecard into decisions:
- Scale any entry product where the 90-day repeat rate beats your store average and there is contribution left on order one. Give it more budget and better placement.
- Hold anything within a few points of average. Leave it alone and spend your attention elsewhere.
- Re-route high-volume products with weak repeat. Stop sending cold traffic there before you consider changing the product itself.
- Retire from acquisition any product with high volume, weak repeat and no contribution. Sell it to your existing list instead.
Run this once and you will find at least one product you have been actively paying to acquire the wrong customers with. Run it every quarter and you will slowly rebuild your acquisition mix around customers who stay.
An entry product lives or dies on how it photographs, because it is usually the first thing a new customer sees. If your images are the weak link, the DIY product photography setup will get you most of the way there without a studio budget.
The Merchandising Audit: Where Your Entry Product Should Appear (And Where It Should Not)
Identifying a good entry product is half the job. The other half is making sure new customers actually meet it first, and that existing customers do not get pushed back into it. Most stores get this backwards, because the merchandising was set up before anyone knew which product predicted retention.
Put it in position one or two on your main collection page. Not position seven. Eye-tracking and click data on Shopify collection pages consistently show the first two tiles taking 40 to 55% of all product clicks, with the tail past position six collecting single digits. If your best entry product is buried below the fold, you are relying on customers to find their way to the right first purchase on their own.
Make it the default answer in your product quiz or finder. If you run a quiz, check what it actually recommends most often. Plenty of Aussie brands discover their quiz has been steering new customers toward the highest-margin product rather than the one with the best repeat behaviour. Margin on order one matters far less than whether order two ever happens.
Feature it in the welcome flow, not the best seller. Your Klaviyo welcome sequence is talking to people who have never bought. Send them to the product that produces repeat customers, not the one with the biggest sales count. A welcome flow should be converting 5 to 10% of new subscribers, and the product you point it at determines whether those conversions become customers or one-off transactions.
Keep it out of your retargeting for existing customers. Nothing wastes budget faster than paying to show a repeat buyer the product they already own. Exclude purchasers of that SKU from the relevant Meta audiences and point returning customers at the natural second purchase instead. This is where a proper cross-sell structure earns its keep.
Do not discount it into the ground. An entry product on permanent sale trains customers to value the whole catalogue at the discounted price. If you need a lower entry point, build a genuine smaller size or a trial version rather than running 30% off the same SKU every month. Bundling it with a complementary item usually lifts average order value more than a discount does, and it introduces the second product early, which is exactly what you want.
Run this audit the same day you run the entry product report. The scoring tells you which product deserves the traffic. The merchandising decides whether it gets it.
Inside eCommerce Circle, entry product economics is one of the first things we look at with every member, because it usually explains a retention problem people have been trying to solve with email for a year. If you want a second opinion on yours, let’s talk.