Ask ten Shopify founders what their customer lifetime value is and nine will give you a number off the top of their head. Ask them how they calculated it and the room goes quiet. LTV has become the most quoted and least understood metric in ecommerce. It sits in pitch decks, gets thrown around in mastermind chats, and quietly justifies every dollar of ad spend, yet most of the brands using it have never actually worked it out.
What’s in This Article
Here is why that matters. Acquiring a new customer costs five times more than retaining one you already have, and depending on your category that figure stretches to 25 times (Invesp). The probability of selling to an existing customer sits at 60 to 70 percent. For a brand new prospect it is 5 to 20 percent. If you do not know your real lifetime value, you are flying your acquisition strategy blind and almost certainly leaving the most profitable part of your business untouched.
This playbook walks you through the five parts of a working LTV system: how to calculate the real number, how to read it against acquisition cost, how to set up the reporting, the three levers that actually move it, and the operating rhythm that keeps it climbing. By the end you will have a metric you can defend, not just quote.
What LTV Actually Is (And the Number Most Founders Get Wrong)
Customer lifetime value is the total profit a customer generates across their entire relationship with your store. The word doing the heavy lifting in that sentence is profit. Most founders quote a revenue figure and call it LTV, which is how you end up confidently overspending to acquire customers who never pay you back.
There are two versions of the number you need to know. Historic LTV looks backwards at what your existing customers have actually spent. Predictive LTV uses purchase patterns to forecast what a new customer will be worth over the next 12 or 24 months. You want both, but if you are starting from zero, begin with historic. It is grounded in real orders, not assumptions.
The other distinction that trips people up is gross versus net. Gross LTV is revenue per customer. Net LTV strips out cost of goods, shipping, payment fees, and returns to show what the customer is genuinely worth to your bank account. Net is the only version that should ever sit next to your acquisition cost. If you have not nailed down your unit economics yet, work through your contribution margin first, because it feeds directly into this calculation.
Part 1: Calculate Your Real Lifetime Value
There are two ways to get to your LTV. The quick version uses three inputs you already have in Shopify. The accurate version uses cohorts. Start with the quick version so you have a working number today, then graduate to cohorts once you trust the process.
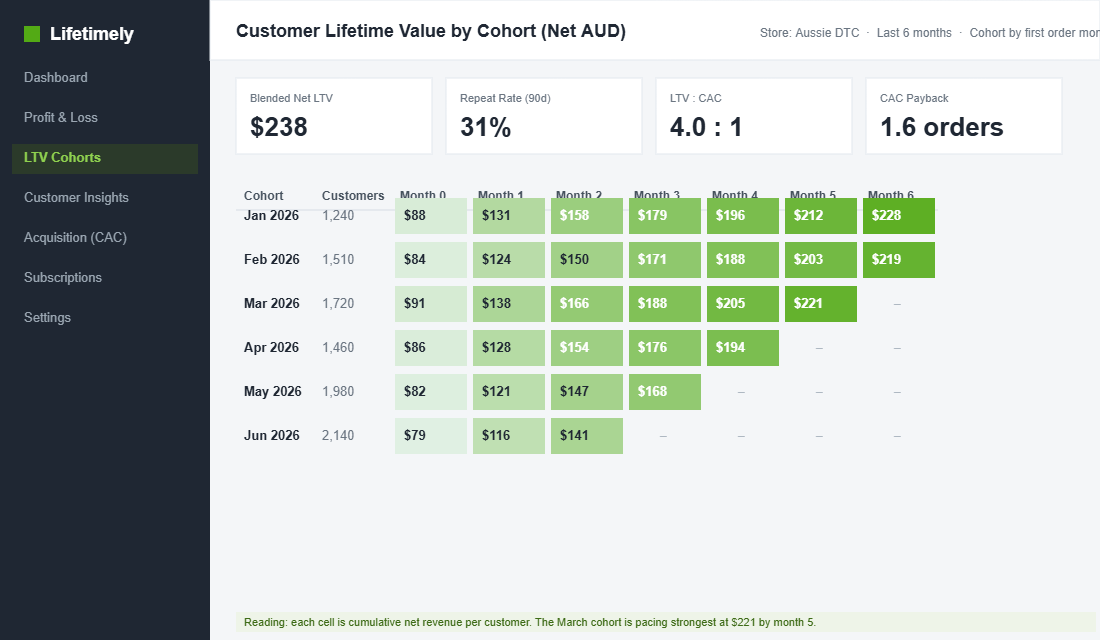
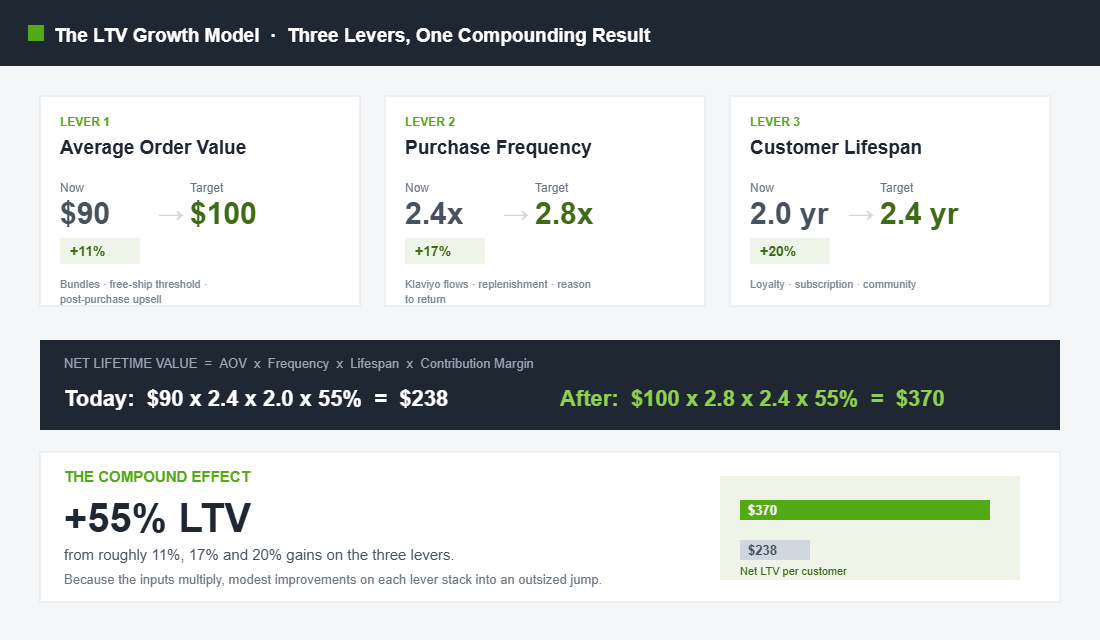
The simple formula is: Average Order Value x Purchase Frequency x Customer Lifespan x Contribution Margin %. Say your average order is 90 AUD, a customer orders 2.4 times a year, your average customer stays active for 2 years, and your contribution margin is 55 percent. That is 90 x 2.4 x 2 x 0.55, which gives you a net LTV of roughly 238 AUD. Now you have a real number to work with.
You can pull every input from Shopify Analytics. Average order value lives in your Reports. Purchase frequency is total orders divided by unique customers over the same window. Lifespan is harder to eyeball, so use the rough rule that lifespan equals 1 divided by your churn rate. If 40 percent of customers do not come back each year, your lifespan is around 2.5 years.
Here is the benchmark to hold yourself against. The average ecommerce repeat purchase rate is 28.2 percent, and repeat customers make up roughly half of all transactions for established stores (Rivo). Most ecommerce businesses land on a lifetime value between 100 and 300 AUD. If your number is well under that, your problem is almost never traffic. It is the back half of the customer journey.
- Pull your AOV. Shopify Analytics, last 12 months, all sales channels.
- Work out frequency. Total orders divided by unique customers for the same period.
- Estimate lifespan. One divided by your annual churn rate.
- Apply your contribution margin. Never quote a gross figure to your acquisition team.
The accurate version trades the single average for cohorts. Instead of one blended lifespan, you group customers by the month they first ordered and track what each group spends month after month. A January cohort might hit 180 AUD of cumulative revenue per customer by month six, while a discount-heavy June cohort stalls at 95 AUD. The blended formula hides that gap. Cohorts expose it, and the gap is usually where your real growth decisions live.
Part 2: Benchmark LTV Against What It Costs to Acquire
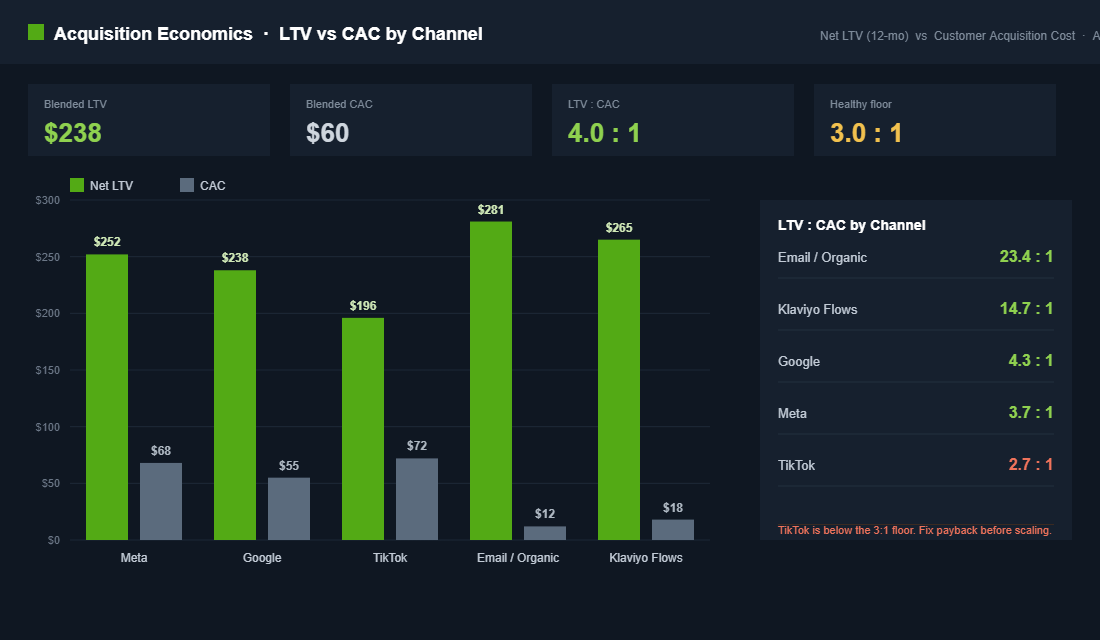
An LTV number on its own is a vanity metric. It only becomes useful the moment you put it next to your customer acquisition cost. The relationship between the two is the single most important ratio in your business.
The widely accepted healthy threshold is a 3:1 ratio. Every customer should be worth at least three times what you paid to acquire them. At 3:1 you have room for overheads, software, your team, and profit. Drop below it and you are buying revenue, not building a business. Push above 5:1 and you are almost certainly underinvesting in growth and leaving market share for a competitor to take.
The second number to watch is payback period, the time it takes for a customer to repay their acquisition cost. If your net LTV is 238 AUD and your acquisition cost is 60 AUD, your ratio is a healthy 4:1, but the real question is whether that 60 AUD comes back on the first order or only after the third. The faster the payback, the less working capital you tie up funding growth, which links straight into your cash conversion cycle.
This is also why retention is worth fighting for. A 5 percent lift in retention can grow profit by 25 to 95 percent, a finding from Bain and Company that has held up for decades (Harvard Business Review). Small movements in the back half of the journey compound into very large movements in profit.
The maths behind that is not abstract. Existing customers already generate around 65 percent of a typical company’s revenue, and brands that lift their repeat customer rate to 40 percent tend to see roughly 50 percent more revenue than brands stuck at 10 percent (Rivo). When you grow LTV, you are not just adding profit per customer. You are widening the gap between what you can afford to spend and what your competitor can.
Part 3: Set Up Reporting You Will Actually Look At
A formula in a spreadsheet gets calculated once and forgotten. To run LTV as a living metric you need reporting that updates on its own and breaks the number down by cohort. The tool most Aussie operators reach for here is Lifetimely by AMP, a Shopify app built specifically for lifetime value and profit analytics.
What makes Lifetimely worth the setup is its cohort reporting. You can segment customers by first purchase date, the first product they bought, acquisition channel, geography, and discount code used, then watch cumulative revenue, repeat purchase rate, and payback period play out over time for each group (Lifetimely by Amp). That last point is the gold. It tells you which products and which channels produce your highest value customers, so you stop optimising for cheap first orders and start optimising for valuable ones.
- Install and connect your data. Add the app from the Shopify App Store, then plug in your ad spend and cost of goods so the profit numbers are real, not gross.
- Enter your COGS. Per product or as a blended margin. This is the step most people skip, and it is the step that makes the number honest.
- Build your first cohort view. Break customers down by first purchase month and read the repeat rate at 30, 60, and 90 days.
- Add the channel breakdown. Compare LTV by acquisition source so you can see which traffic actually pays off.
- Schedule the daily email report. Get the headline numbers landing in your inbox so the metric stays in front of you.
If you are not ready for a paid app, Shopify’s native customer reports will give you repeat customer rate and AOV, and Klaviyo carries a predicted CLV field you can segment on. Start with what you have. The discipline of looking matters more than the tool.
Part 4: The Three Levers That Actually Move LTV
Look back at the formula and you will see there are only three things you can change to grow lifetime value: how much customers spend per order, how often they order, and how long they stay. Every retention tactic you have ever read about rolls up into one of these three levers. Pull on them deliberately instead of chasing random tactics.
Lever one is average order value. Bundles, free shipping thresholds, and post-purchase upsells lift the value of each transaction. Apps like Rebuy and Upcart make this almost set-and-forget, surfacing the right add-on at the cart and after checkout. Existing customers already spend up to 67 percent more than new ones, so AOV gains compound fastest on people who already trust you. A 10 AUD lift on a 90 AUD order is an 11 percent jump in LTV before you have changed anything else.
Lever two is purchase frequency. This is where Klaviyo email and SMS flows, replenishment reminders timed to your product cycle, and a genuine reason to come back do their work. A first-time buyer who makes a second purchase is far more likely to make a third and a fourth, so the jump from one order to two is the hardest and most valuable transition in the whole journey. That is why your repeat purchase system deserves as much attention as your acquisition funnel.
Lever three is customer lifespan. Loyalty programs, subscriptions, and community keep customers active for longer. Frank Body, the Melbourne skincare brand, runs secret restocks that make buyers feel like insiders, manufacturing the anticipation that brings people back drop after drop. Who Gives A Crap, another Australian success story, built a subscription model around an everyday replenishable so reorders happen on autopilot rather than relying on a fresh marketing push every cycle.
The brands that win do not pick one lever. They run all three at once, and because the inputs multiply rather than add, even modest gains on each produce an outsized jump in lifetime value.
Part 5: Build a 90-Day LTV Operating Rhythm
LTV is not a number you check once a quarter when the board asks. It is a metric you run on a rhythm, because the data only tells the truth when you compare cohorts over time. A customer who joined in March behaves differently from one who joined during a Black Friday discount rush, and you only see that by tracking them side by side.
Set a monthly cohort review. Once a month, open your cohort report and ask three questions. Is the repeat rate at 60 days improving for newer cohorts? Is LTV by channel shifting, and should budget follow it? Are discount-acquired customers worth less than full-price ones, and if so, what does that say about your promotional habits? This is the same discipline behind proper cohort analysis, applied specifically to value.
Then pick one lever per quarter. Do not try to move AOV, frequency, and lifespan all in the same 90 days, because you will never know which change drove the result. Run a focused experiment on one lever, measure the cohort that experiences it, and only then move to the next. Slow is smooth, and smooth is how you build a number that climbs every quarter.
The Discount Trap That Quietly Caps Your LTV
One pattern shows up again and again when we look at member cohorts, and it is worth calling out because it undoes everything above. Customers acquired with a heavy first-order discount tend to have a materially lower lifetime value than customers who paid full price. They were trained to wait for the next sale, so they do, and they churn the moment the codes stop.
This does not mean discounts are bad. It means you have to measure the lifetime value of discount-acquired customers separately. If a 20 percent welcome code brings in customers worth 140 AUD while your full-price customers are worth 260 AUD, that code is not a growth tool. It is a margin leak dressed up as one. The only way to know is to break LTV down by discount code in your cohort report, which is exactly why the reporting setup in Part 3 matters so much.
The fix is rarely to kill discounts outright. It is to shift the incentive from price to value. Offer a free sample, a bonus product, or early access instead of a percentage off, and you attract a customer who came for the brand rather than the bargain. Those customers stay longer, order more often, and lift your blended lifetime value without ever touching your headline price.
Your LTV Scorecard
Before you close this tab, run your store through this scorecard. If you cannot tick all six, you have your next month of work mapped out.
- Net, not gross. Your LTV figure has cost of goods, shipping, and fees stripped out.
- The ratio is healthy. Your LTV to acquisition cost sits at or above 3:1.
- You know your payback. You can say how many orders it takes to repay acquisition cost.
- It is broken down by cohort. You can see LTV by first product and acquisition channel.
- It updates itself. The number lives in a dashboard, not a one-off spreadsheet.
- You are pulling a lever. One active experiment on AOV, frequency, or lifespan right now.
The Compound Effect: Why LTV Decides Who Wins
Here is how the pieces fit together. When you know your true net LTV, you know exactly how much you can afford to pay for a customer. When you grow that LTV through the three levers, your affordable acquisition cost rises with it. And when your affordable cost is higher than your competitor’s, you can outbid them on every ad platform, place better, and still make more profit per customer than they do.
That is the quiet advantage behind almost every brand that seems to come from nowhere and dominate a category. They are not smarter at ads. They have simply built a customer worth more, which lets them spend more to get the next one. Repeat customers generate up to 300 percent more revenue than first timers, and the brands that understand this stop treating retention as a nice-to-have and start treating it as their acquisition engine.
Most founders spend 90 percent of their energy on the top of the funnel and wonder why growth feels like running uphill. Flip that. Calculate the real number, set the rhythm, and pull the levers. The store with the highest sustainable lifetime value almost always wins the category.
Inside eCommerce Circle, lifetime value is one of the core pillars we work on with every member, because it touches profit, retention, and how aggressively you can grow. If you want a second opinion on yours, let’s talk.