Most Shopify store owners are making product decisions, marketing decisions, and customer experience decisions based on assumptions. They think they know what their customers want. They think they know why people buy — or do not buy. But they have never actually asked.
What’s in This Article
Customer surveys are one of the most underused growth tools in ecommerce. A well-designed survey takes 10 minutes to set up, costs almost nothing to run, and delivers insights that would take months to figure out through trial and error. The brands that systematically collect and act on customer feedback consistently outperform those that guess.
But most brands either do not survey at all, or they send out a generic “How was your experience?” email that generates useless data. Here is the survey framework that actually produces actionable insights — the kind that directly inform product development, marketing messaging, and customer experience improvements.
The Post-Purchase Survey: Your Most Valuable Feedback Loop
The post-purchase survey should be your primary feedback mechanism. Send it 7-14 days after delivery (not purchase — after delivery, when the customer has actually used the product). This timing captures the authentic experience while it is still fresh.
Keep it to 5-7 questions maximum. Completion rates drop dramatically after 7 questions. Each question should serve a specific strategic purpose — no filler, no “just curious” questions. Here are the five essential post-purchase survey questions:
- “How did you first hear about us?” This is your attribution goldmine. Most analytics tools cannot accurately track word-of-mouth, podcast mentions, influencer discovery, or in-store recommendations. This single question often reveals that your highest-value acquisition channel is one you are not even measuring in Google Analytics.
- “What almost stopped you from buying?” This is the most powerful question in the entire survey. It reveals your conversion barriers directly from the people who overcame them. Common answers include shipping cost concerns, sizing uncertainty, return policy worries, and trust issues. Each answer is a conversion optimisation opportunity.
- “How would you describe our product to a friend?” This tells you how customers actually perceive your brand — in their words, not yours. Use their language in your marketing copy. If customers describe your product as “luxurious and soft” but your website says “premium quality fabric,” you are missing a resonance opportunity.
- “What product would you love us to make next?” Crowdsource your product development roadmap. When 50+ customers request the same thing, you have validated demand before spending a dollar on development. This is dramatically cheaper and more reliable than guessing.
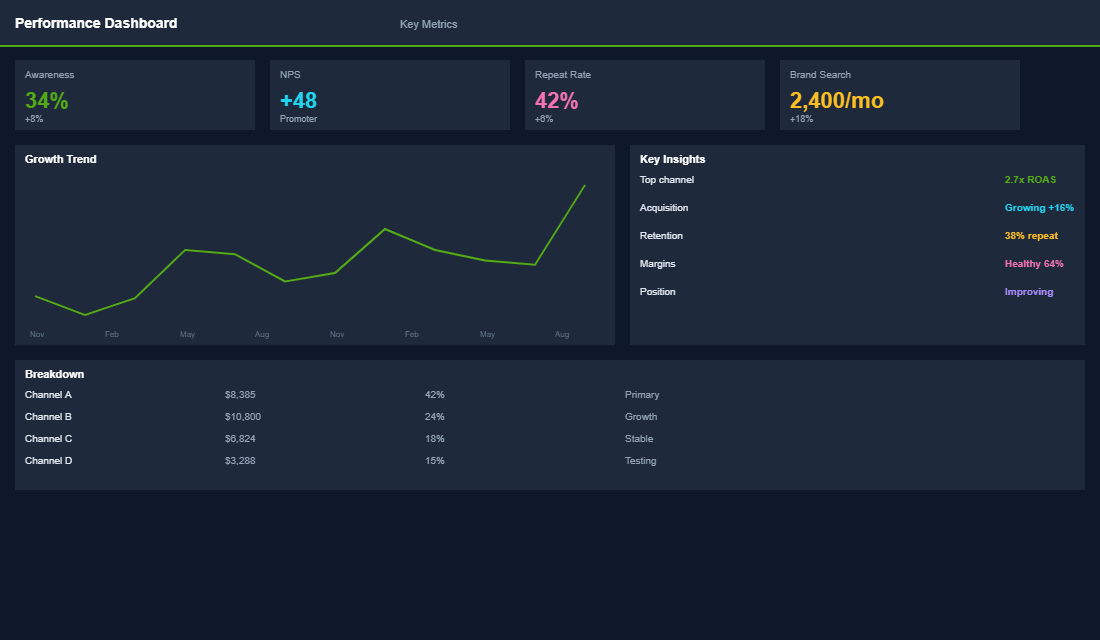
- “On a scale of 0-10, how likely are you to recommend us to a friend?” This is your Net Promoter Score (NPS) question. It is the single best predictor of customer loyalty and word-of-mouth growth. Track it monthly and segment it by customer type, product category, and acquisition channel.
Pre-Purchase Surveys: Understanding Why People Do Not Buy
Post-purchase surveys only capture people who already bought. What about the 97% of visitors who leave without purchasing? Exit-intent and on-site surveys help you understand their barriers.
Use a simple one-question exit survey that triggers when a visitor moves their cursor toward the browser close button (on desktop) or after 60 seconds of inactivity (on mobile). The question: “What is stopping you from purchasing today?” with pre-set options like “Just browsing,” “Price too high,” “Need more product info,” “Shipping costs,” “Not sure about sizing,” and an “Other” text field.
Tools like Hotjar, Typeform, or the KnoCommerce Shopify app make this easy to implement. Even 50-100 responses per month will reveal clear patterns in your conversion barriers. If 30% of respondents say “Not sure about sizing,” that is a loud signal to improve your size guide, add model measurements, or offer a fit guarantee.
NPS: The One Number That Predicts Growth
Your Net Promoter Score is not just a vanity metric — it is the leading indicator of organic growth. Brands with NPS above 60 typically grow 2-3x faster than those below 40, because promoters (9-10 ratings) actively refer new customers while detractors (0-6) damage your reputation.
Track NPS monthly and segment it aggressively. Your overall NPS might be 55, but when you break it down you discover that repeat buyers score 78 while first-time buyers score 42. That tells you your product is excellent but your first-purchase experience needs work — maybe your packaging, unboxing experience, or post-purchase communication is underwhelming.
The most valuable data comes from the follow-up question: “What is the primary reason for your score?” Promoters tell you what to double down on. Detractors tell you what to fix urgently. Passives (7-8) tell you what would push them to become promoters. Read every single response — patterns emerge quickly.
Aim for these NPS benchmarks: above 50 is good for ecommerce, above 60 is excellent, and above 70 puts you in the top tier. If your NPS is below 30, you have a fundamental product or experience problem that needs urgent attention.
Turning Survey Data Into Product Decisions
Collecting data is pointless if you do not act on it. Build a quarterly review process where you analyse survey responses and make specific decisions based on the findings.
Create a simple tracking document with three columns: Insight (what the data says), Action (what you will do about it), and Timeline (when it will be done). For example: “38% of customers mention fast shipping as a positive” leads to “Feature shipping speed more prominently on product pages and in ads” with a 2-week implementation timeline.
For product development, use a threshold approach. When 50+ customers request the same product or feature, it moves to your evaluation list. When 100+ request it, it becomes a priority. This prevents you from chasing every suggestion while ensuring genuine demand signals get attention.
Share survey insights with your entire team. Your marketing team should use customer language from surveys in ad copy and email subject lines. Your customer service team should know the most common concerns. Your product team should see the requests and complaints. Survey data is too valuable to sit in one person’s inbox.
Tools and Implementation
You do not need expensive survey software. Here are the best tools for Shopify stores at different stages:
- Klaviyo or Omnisend. Both email platforms support embedded surveys directly in your post-purchase email flows. Simple, no extra cost, and the responses are automatically linked to customer profiles.
- KnoCommerce. Purpose-built for Shopify post-purchase surveys. It embeds on the order confirmation page (highest response rates) and includes attribution, NPS, and custom question types.
- Typeform. Beautiful, engaging survey forms that work well for longer surveys like annual brand perception studies. The free plan is sufficient for most needs.
- Hotjar. Best for on-site surveys and exit-intent questions. The visual heatmap data combined with survey responses gives you a complete picture of visitor behaviour.
The Survey Tool Stack: What to Use at Each Stage
Most Aussie Shopify founders waste money on the wrong survey tool for their stage. Here is the stack we recommend our coaching members based on store revenue and survey use case.
Under $50K/month revenue. Start with Klaviyo’s built-in survey blocks for post-purchase NPS and KnoCommerce’s free tier for the post-purchase attribution survey. Klaviyo lives inside the email tool you already pay for, so there is no extra cost. KnoCommerce gives you 200 free responses per month, which is plenty when you are doing under 300 orders. Combine those two and you have post-purchase coverage and attribution data without spending another dollar.
$50K to $200K/month revenue. Upgrade KnoCommerce to a paid plan (around $89 AUD/month) so you can run unlimited responses, A/B test questions, and segment responses by customer LTV. Add Hotjar Basic ($39 AUD/month) for on-site exit intent surveys on cart and product pages. This combo will tell you not just why people buy but also why people leave.
$200K/month and above. You need attribution survey data feeding into your reporting stack. Move to PostScript Surveys or KnoCommerce Pro (around $300 AUD/month) and pipe survey responses into Klaviyo profiles so you can segment future emails by what they said. Add Typeform Business for your quarterly brand perception study, and use Delighted for your weekly NPS sample. At this revenue your data is now a competitive moat — and you should be running at least 4 survey touchpoints across the customer journey.
Survey Benchmark Numbers That Tell You If Your Program Is Working
If you do not measure your survey program, you cannot improve it. These are the benchmarks Aussie Shopify stores should be hitting once a feedback loop is in place. If your numbers are well below these, the issue is usually question design, send timing, or incentive — not customer apathy.
- Post-purchase survey response rate: 25-40% (single question), 8-15% (3-5 questions). Below 8% means your question is too long or your send timing is wrong.
- NPS survey response rate: 15-25% via email, 30-45% via post-purchase page. Aim for at least one NPS data point per 50 customers.
- NPS benchmark for Aussie Shopify stores: 40+ is good, 50+ is excellent, 70+ puts you in the top 5% of DTC brands. The Australian DTC average sits around 35.
- “Why did you buy?” attribution survey response rate: 35-55% when shown on the order confirmation page. This is the highest response rate touchpoint in your entire stack — use it.
- Exit-intent survey response rate: 2-5%. Sounds low, but at 1,000 daily sessions that is still 20-50 honest answers per day from people who chose not to buy.
- Customer interview show-up rate: 60-80% when you offer a $50 store credit incentive, 30-50% with no incentive. Always pay them — your time is worth more than the credit.
Track these monthly. If your response rates drop, your customer happiness probably is too — surveys are a leading indicator of churn before it shows up in your repeat-purchase data. For more on stopping churn before it happens, see our guide on customer retention and why the second sale matters more than the first.
The 5 Survey Mistakes That Kill Response Rates (And How to Fix Them)
We audit member survey programs every month and the same five mistakes show up over and over. Fix these and you will roughly double your response rates inside 30 days.
1. Sending the survey too late. Post-purchase surveys sent 7+ days after the order get less than 10% response. Send your “Why did you buy?” survey on the order confirmation page (right after they click Pay) and your product satisfaction survey 3-5 days after delivery. Timing is everything.
2. Asking too many questions. Every additional question drops your completion rate by 10-15%. If you need to ask 5 questions, split them across 2 surveys or use conditional logic so respondents only see the questions relevant to them. The data you actually use beats the data you wish you had.
3. Leading the witness. Questions like “How amazing was your experience?” get useless data. Use neutral language: “How would you describe your experience in 1-2 sentences?” Open-ended questions in customers’ own words are gold — that is your future ad copy.
4. No incentive for longer surveys. If your survey takes more than 90 seconds, offer something. A $10 store credit, free shipping on next order, or entry into a $200 monthly draw all work. The incentive cost is trivial against the value of the data — most members recover the cost on a single insight.
5. Never closing the loop. When a customer leaves negative feedback, reply within 24 hours. When you ship a product change customers asked for, email the ones who suggested it. This single behaviour increases future response rates by 30-50% because customers know their voice actually moves the needle. It also turns detractors into your most loyal advocates — see our framework on turning customer service into a growth engine for more on this.
The Compound Effect of Listening to Your Customers
When you systematically collect and act on customer feedback, every part of your business improves. Your product development hits more often because you are building what customers ask for. Your marketing resonates more deeply because you are using their language. Your conversion rate improves because you are addressing the exact barriers that stop people from buying. Your retention increases because customers feel heard and valued.
One eCommerce Circle member discovered through surveys that 42% of new customers found them through Instagram — a channel they had almost stopped investing in because Google Analytics showed it as a low converter. That insight saved a channel that was driving nearly half their customer acquisition. Another member used product request data to launch a kids collection that became 30% of revenue within six months.
Customer voice is one of the foundational pillars we work on inside the eCommerce Circle. We help members design survey systems, interpret results, and turn insights into action plans. If you are making decisions based on assumptions instead of data, we can help you build the feedback loop that changes that. Let us chat about what that looks like for your brand.