There are two ways inventory quietly bleeds a Shopify store, and you only ever feel one of them. You feel the stockout. Your best-selling product flips to sold out halfway through a campaign, the ads are still running, the traffic is still landing, and every click hits a dead page. The other leak you never feel, because it looks like an asset. It is the pallet of slow movers sitting in your 3PL, dressed up as stock on hand, quietly eating your cash.
What’s in This Article
Both are expensive. Inventory distortion, the combination of stockouts and overstock, cost retailers around 1.77 trillion US dollars in 2023, roughly 7.2% of all retail sales. Stockouts alone account for about 40% of sales that never convert, and 51% of products hit at least one stockout in a given year. When a customer lands on an out-of-stock page, 69% go and buy from a competitor and 91% will not wait around for a restock.
Most founders forecast on gut feel and a spreadsheet they only update when something runs low. That is reactive, and it is exactly why so many brands stall between one and ten million dollars in revenue. The ones that punch through treat inventory as a system, not a panic. Here is the five-step forecasting playbook we run with members, built for Aussie operators dealing with long freight lead times and seasonal cash crunches.
Inventory Is the Stock Foundation, and It Taxes You Twice
In the More Orders Operating System, Stock is one of the four foundations alongside Story, Store, and Strategy. Story and Store get all the love. They are the fun parts, the brand and the website. Stock is the unglamorous foundation where your actual cash lives, and it is the one most founders manage by feel.
The reason inventory is so dangerous is that it taxes you on both sides. Run too lean and you pay the stockout tax: lost sales, ad spend wasted driving traffic to a sold-out hero, and customers handed straight to a competitor who happened to have stock. Run too heavy and you pay the overstock tax: carrying costs of 20 to 30% of inventory value every year, plus the eventual markdown to clear what never sold.
Forecasting is not about predicting the future perfectly. No model survives a viral TikTok or a freight delay. The goal is to be roughly right on demand, react fast when reality moves, and never let either tax run unchecked. That starts with knowing your numbers cold.
Step 1: Build a Demand Baseline From Real Sell-Through
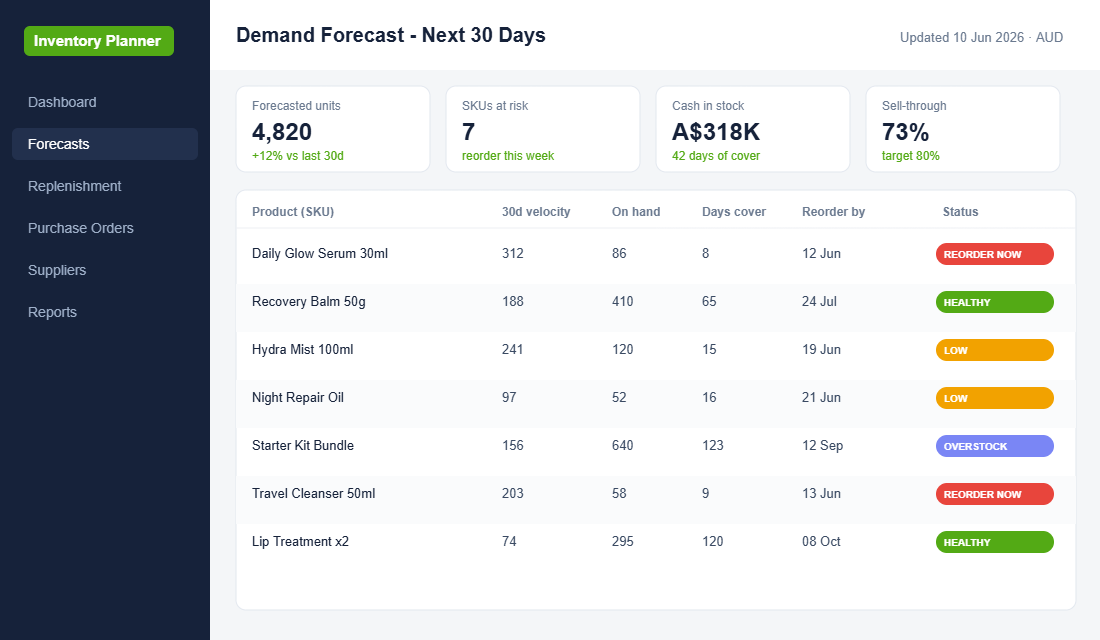
Your baseline is the foundation everything else sits on, and it has to be built on units, not revenue. Revenue hides what is actually moving. Start with velocity per SKU: the average units sold per day over a trailing 30, 60, and 90 day window. Compare the three and you can see whether a product is accelerating or fading.
From velocity you get the single most useful number in inventory: days of cover. Divide units on hand by daily velocity and you know exactly how long until you hit zero. A hero serum selling 10 units a day with 80 on hand has eight days of cover. That is a fire, not a forecast.
Then check sell-through rate, the percentage of a buy that sells within its cycle. Aim for around 80% sell-through before the next order lands. Consistently under 50% means you are overbuying and funding your own overstock tax.
- Pull the data from Shopify. Analytics, then Reports, then Sell-through rate and ABC product analysis. No extra app needed to start.
- Segment your SKUs A, B, and C. Roughly 20% of your products drive 80% of revenue. Forecast your A-items weekly, B-items fortnightly, and C-items monthly.
- Track velocity in units per day, every week. A 30% drop in velocity on an A-item is an early warning worth a marketing response, not a reorder.
Make it concrete. Say you bought 500 units of a new candle and sold 360 in the eight-week cycle before the reorder lands. That is a 72% sell-through, healthy, and worth reordering at a similar level. Sell only 180 and you are sitting at 36%, a clear signal to halve the next order and protect your cash rather than double down on a product the market is lukewarm on.
Step 2: Set Reorder Points That End the Panic Orders
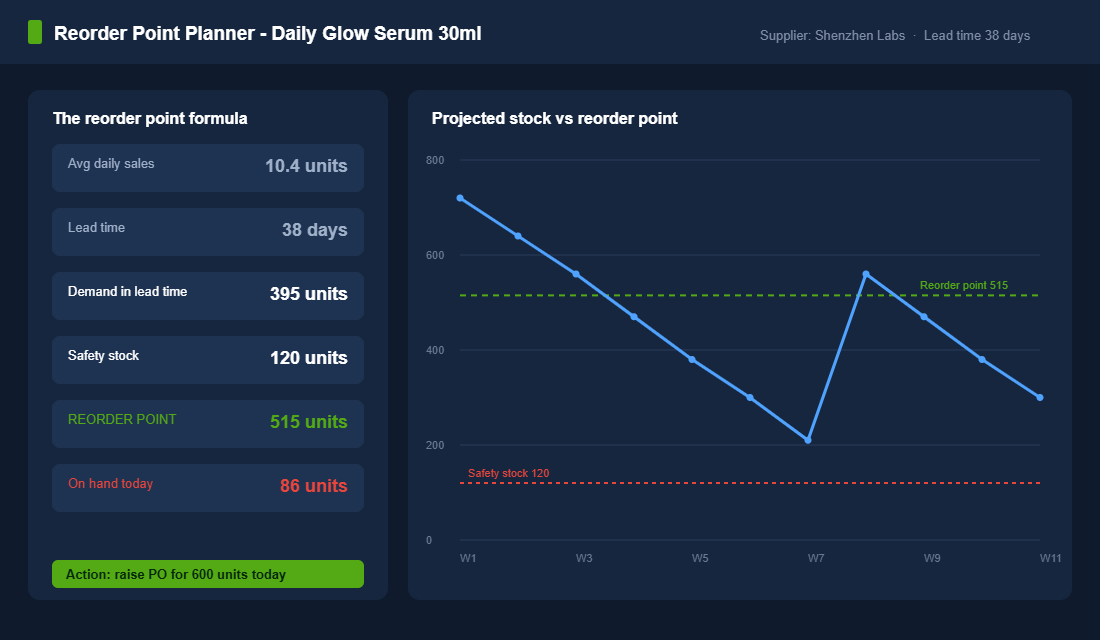
A reorder point is the stock level that triggers a new purchase order. Set it right and you never scramble. The formula is simple: reorder point equals average daily sales multiplied by lead time in days, plus your safety stock.
Safety stock is the buffer that absorbs both a demand spike and a slow supplier. Calculate it as (maximum daily sales times maximum lead time) minus (average daily sales times average lead time). It is the difference between a normal cycle and a worst-case one, held as insurance.
Work a real example. The Daily Glow Serum sells 10.4 units a day. Lead time from the supplier is 38 days. Demand across that lead time is about 395 units. Add 120 units of safety stock and your reorder point is 515. With only 86 on hand today, you are well past the trigger and need a purchase order out the door now, not next week.
- Calculate a reorder point for every A and B SKU. C-items can run on a simpler min and max rule.
- Load reorder points into a tool. Inventory Planner by Sage sits on top of Shopify and flags every SKU that crosses its trigger, so you are not eyeballing a spreadsheet at midnight.
- Review triggers weekly. Velocity moves, so a reorder point set in January is wrong by April. Recalculate monthly at minimum.
Knowing when to reorder is only half the job. How much to order is the other half. A simple rule that works: cover your lead time plus one full review cycle, then adjust for any promotions landing in that window. Order too little and you are back at the reorder point within weeks, paying freight twice. Order too much and you have just built next quarter’s overstock with your own cash.
Step 3: Respect Lead Time, and the Chinese New Year Trap
Lead time is the number founders get most wrong, because they think of it as freight time only. Real lead time is production plus quality control plus freight plus the days it takes to receive and put away at your 3PL. For most Aussie brands importing from China, that is 30 to 60 days, not the two weeks they quote you.
Then there is the trap that wrecks Q1 every single year: Chinese New Year. Factories shut for two to four weeks across late January and February, deliveries do not restart until late February, and backlogs push real arrivals into March. If you place your Q1 reorders in January, you are already too late. Place them before December, and budget for the production deposits that fall due right when your post-Christmas cash is tightest.
Build a supplier lead-time log and track actuals, not promises. Every brand has a supplier who says 30 days and delivers in 50. Your safety stock formula only works if the lead time you feed it is the real one.
- Log actual lead times per supplier. Record the date you paid the deposit and the date stock landed at the 3PL. The gap is your real number.
- Plan around Chinese New Year months ahead. Order Q1 stock before December and confirm your factory shutdown dates in writing.
- Weigh sea against air for your A-items. Air freight costs more per unit but can save a hero product from a six-week stockout that would cost far more in lost sales.
Build a receiving buffer into the timeline too. Stock landing at the port is not stock you can sell. Customs clearance, transport to the 3PL, and put-away can add a week or more, and during peak periods most 3PLs run behind. Treat the date stock is live and sellable as your real arrival date, not the day the container docks.
Step 4: Forecast for Promotions and Seasonality, Not Just Flat Demand
A baseline forecast quietly assumes demand stays flat. It never does. A single hero discount can lift velocity five to ten times for a week, and if your reorder point was set on normal demand, that promotion is also your next stockout.
The fix is a marketing event calendar that feeds your forecast. Every planned promotion, launch, and seasonal peak should adjust the demand number for the weeks around it. Tools like Cogsy build this in, letting you drop a promo onto a calendar and watch the forecast and reorder recommendations shift automatically.
For Aussie brands, June is the big one. The end of financial year sale period is a genuine demand event, and running out mid-sale is the most expensive stockout of the year. Plan your EOFY stock the same way you plan the campaign itself. Our EOFY sale campaign playbook covers the promotional side, but the inventory has to be locked in well before the emails go out.
- Pull last year’s promo lift as a multiplier. If your last EOFY sale tripled velocity on heroes, forecast this year at three times baseline for those SKUs.
- Order promotional stock against the peak, not the average. Then plan how you will clear whatever is left so the buffer does not become dead stock.
- Map the full calendar. EOFY, Black Friday Cyber Monday, Boxing Day, product launches, and any influencer drops that could spike demand.
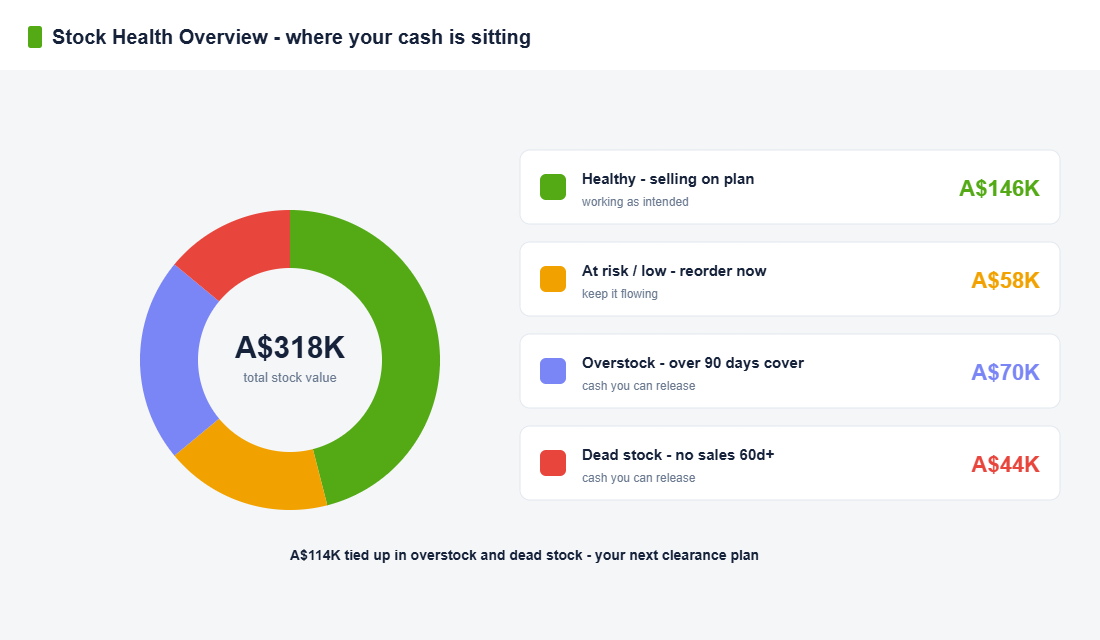
Step 5: Free the Cash Trapped in Dead Stock
Dead stock is anything that has not sold in 60 days or more. Overstock is anything carrying more than 90 days of cover. Both are cash you have already spent, sitting idle, charging you 20 to 30% a year to hold while it slowly loses value. That capital cannot buy more of your winners, which is the real cost.
You do not need to eat the loss. You need a recycling plan that turns slow stock back into cash and customers. Bundle slow movers with a hero product to lift them out the door, a tactic our product bundling playbook breaks down. Clear genuine dead stock during your EOFY or Boxing Day sale. And on the front end, fund your next purchase order with customer cash by taking pre-orders, which our pre-order playbook walks through step by step.
The two failure modes are easy to see in the wild. Who Gives A Crap, the Melbourne B Corp, famously sold out of toilet paper in March 2020 when demand spiked overnight, the stockout tax in its most public form. On the other side, Allbirds told investors in its public results that excess inventory forced margin-denting markdowns to clear, the overstock tax in action. Same coin, two sides, and a forecasting system is what keeps you off both.
When you do clear dead stock, sequence it to protect brand and margin. Start quietly: bundle slow movers with a hero or add them as a gift with purchase so units move at full perceived value. Only then drop to a clearance discount, and keep it time-boxed so you are not training customers to wait for the next markdown. The goal is to turn idle stock into cash and new buyers, not to torch your pricing.
The Three Forecasting Mistakes That Cost Aussie Founders the Most
Even with a system in place, the same mistakes show up again and again when we audit a member’s stockroom. Each one is quietly expensive, and each one is avoidable.
The first is forecasting in revenue instead of units. A price rise can make a fading product look healthy on a revenue chart while units quietly collapse underneath it. Always forecast in units first, then convert to cash. Units are the truth, dollars are the story you tell about them.
The second is treating every SKU the same. Spending the same planning effort on a twelve-units-a-month accessory as on your number one hero is exactly how A-items slip into stockout while you fuss over the long tail. Let effort follow the Pareto split, and protect the products that pay the bills.
The third is ignoring the cash-flow timing of a purchase order. A perfect reorder point is useless if the deposit falls due the same week as rent, your BAS, and a payroll run. Forecast the cash as carefully as the units, and stagger large orders so a single landing does not drain the account. A fourth trap sits underneath all of these: forecasting once and forgetting. A plan built in January describes a business that no longer exists by April, so revisit the numbers on a fixed cadence.
The Compound Effect: How the Five Steps Work as One System
Each step is useful alone, but the power is in the loop. Your demand baseline tells you what is moving. Reorder points turn that into automatic triggers. Lead time sets the timing so orders land before zero. The promo calendar bends the forecast around your campaigns. And the dead-stock review recycles trapped cash back into the products that actually sell.
Run that loop and the numbers move. Brands that layer AI-assisted forecasting on top see roughly 15% fewer stockouts and 20% lower excess inventory carrying costs. Inventory Planner by Sage is the mature choice for analytics-heavy brands, while Cogsy, from around 199 US dollars a month, leans into demand planning and what-if scenarios for fast-growing DTC stores. The tool matters less than the discipline.
The payoff is the thing every founder actually wants: the confidence to place a big purchase order without a knot in your stomach, the cash to back your winners, and the certainty that your next launch will not be wrecked by a sold-out hero on day two.
Your Inventory Forecasting Checklist
Run this cadence and inventory stops being a fire drill. Print it, pin it above the desk, and work it weekly.
- Weekly: update velocity in units per day for every A-item and flag any SKU under 14 days of cover.
- Weekly: review reorder-point triggers and raise purchase orders for anything past the line.
- Monthly: recalculate reorder points and safety stock as velocity shifts.
- Monthly: update your supplier lead-time log with actual landed dates, not quoted ones.
- Quarterly: map the promo and seasonal calendar and adjust forecasts around each event.
- Quarterly: run a stock health review, identify overstock and dead stock, and build the plan to release that cash.
Inside eCommerce Circle, Stock is one of the core foundations we work on with every member, because it is where the cash hides. If you want a second opinion on your forecasting and a plan to free the cash stuck in your stockroom, let’s talk.