Your Shopify dashboard tells you the store did 21% net margin last month. That number is a lie of averaging.
What’s in This Article
Not a deliberate one. A blended margin takes your best orders and your worst orders, adds them up, divides by the total, and hands you back a single figure that describes no actual order in your business. Buried inside that average is a cluster of orders you effectively paid a customer to accept.
Median net profit margin for a DTC ecommerce brand sits at roughly 3%, and the average brand keeps about 8.8% after everything is paid. At those levels, the gap between a good year and a bad one is rarely your ad account. It is the shape of the orders sitting underneath the average, and almost no Aussie founder has ever looked at them one by one.
Across hundreds of Aussie Shopify founders, the same thing happens when we run this audit for the first time. Somewhere between 8% and 15% of orders turn out to be break-even or worse. The founder’s first reaction is always the same: “I had no idea we were shipping those at a loss.”
Why Your Margin Report Is Hiding the Problem
Shopify Analytics is built to report on products and channels. It is not built to report on orders as economic units. So the costs that vary most wildly between one order and the next are the exact costs Shopify never attributes back to the order that caused them.
Think about what actually changes order to order. Freight to Alice Springs against freight to Surry Hills. A customer who ordered once and kept it against a customer who has returned four of their last six orders. An order that shipped complete against one that went out in three parcels from two locations because your inventory was split.
For the average DTC brand, shipping and returns together consume around 17% of revenue. Product cost takes roughly 35% and acquisition another 25%. That means about three-fifths of your revenue is gone before a single operational cost lands, and the most volatile remaining slice, the shipping and returns slice, is the one you are reporting on as a flat average.
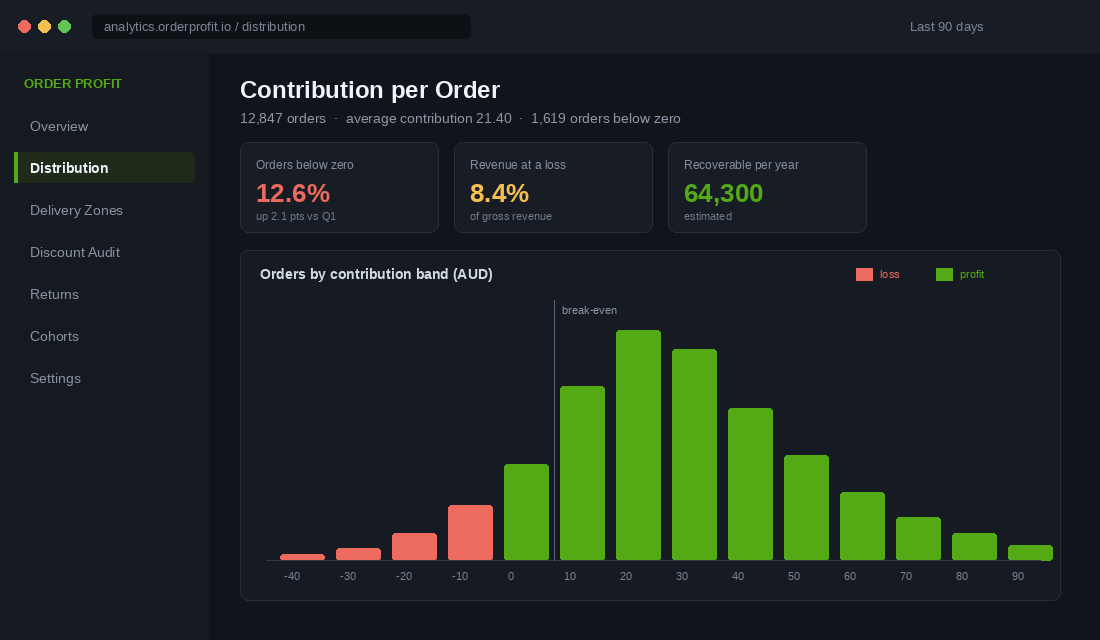
The fix is not more reporting. It is one calculation, applied to every order you shipped in the last six months.
The One Calculation That Replaces Blended Margin
Order-level contribution is what is left after every cost that only exists because that specific order exists. Not overheads. Not your rent or your Klaviyo subscription. Only the costs that would disappear if the order disappeared.
Order contribution = revenue collected, minus landed cost of goods, minus actual carrier charge, minus pick and pack labour, minus payment processing, minus the discount applied, minus a returns provision for that order profile, minus any support cost attached to the order.
Two of those inputs are where founders get lazy, and both matter more than the rest.
- Actual carrier charge, not your quoted rate. Pull it from the carrier invoice, not from your shipping settings. Dimensional weight, fuel levies and remote-area loadings mean the invoiced figure is routinely 20% to 40% above what the rate card implied.
- Landed cost, not supplier cost. Freight in, duty, GST treatment, inbound handling and FX all belong in the unit cost. If you have not rebuilt this recently, start with the landed cost playbook, because everything downstream inherits the error.
A healthy target contribution margin for a DTC brand is 35% to 60%. Below 30% you will struggle to scale, because there is not enough left over to fund acquisition and inventory at the same time. If you have not built this at the product level yet, the contribution margin playbook covers the per-product version. This article is the per-order version, and they surface different problems.
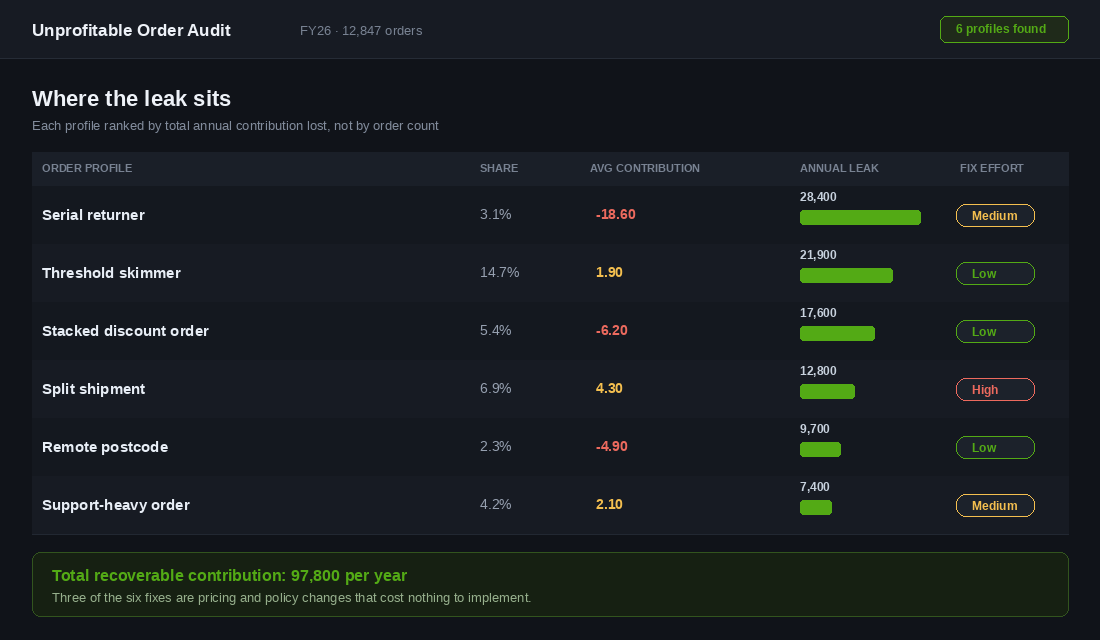
Once you have contribution on every order, sort ascending. The bottom decile will cluster into recognisable shapes. There are six that show up in almost every Australian store.
Profile 1: The Remote Postcode Order
Australia is the hardest country in the developed world to run a flat shipping rate in. Rural and remote deliveries attract a 15% surcharge on base postage with Australia Post, and where distance travelled exceeds 15km a further per-kilometre charge applies. On 1 July 2026 parcel post rates rose an average of 4.95%, which quietly pushed another slice of orders under water for anyone who did not reprice.
The commercial couriers do not solve it either. CouriersPlease, Aramex and Sendle all carry postcode exclusions or remote loadings, so a multi-carrier setup that looks cheap on metro volume can be your most expensive option on the 3% of orders heading past the ranges.
Two Australian brands have already made this decision publicly, and both are worth copying. Who Gives A Crap offers free shipping to over 70% of the Australian population and charges roughly 8 dollars to the rest, because the freight economics genuinely differ by geography and they chose to say so rather than absorb it. Koala goes further: they decline delivery to some remote and rural postcodes entirely, on the stated basis that transit costs far outweigh what they can reasonably charge, and they calculate regional charges based on the specific address and cart rather than a flat rule.
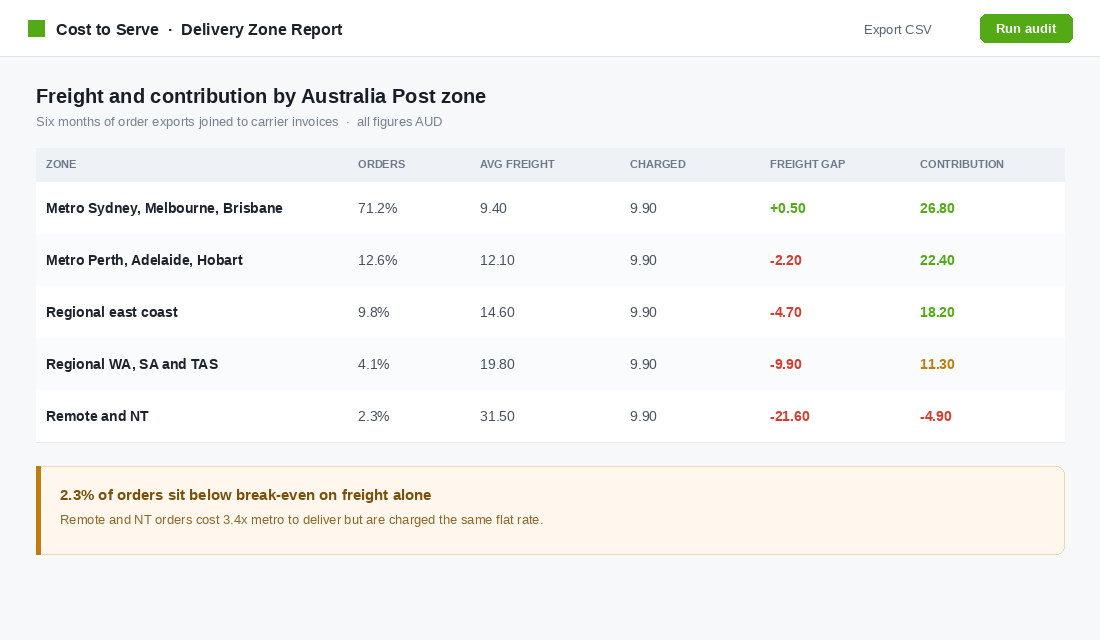
The fix. Build a postcode zone map from your own carrier invoices, not from the carrier’s marketing zones. Group into metro east, metro west, regional and remote. Then choose one of three positions per zone: charge the real cost, raise the free shipping threshold for that zone, or accept the loss deliberately as a market-development cost. Any of the three is fine. Not knowing is not.
Profile 2: The Threshold Skimmer
This is the largest profile by volume in most stores, and the one founders defend hardest. The threshold skimmer is the customer who adds items until the cart clears your free shipping bar by a few dollars, then checks out.
The behaviour is real and it is strong: 58% of shoppers add extra items to qualify for free shipping, and 56% of Australian online shoppers rank free shipping as their top delivery preference. Stores running a progress bar see 12% to 18% higher AOV. So the mechanic works.
The problem is where the bar sits. If your threshold is set 15% above AOV, which is the most commonly repeated advice, a skimmer who clears it by two dollars is handing you an order that carries full freight, full pick and pack, full processing, and almost none of the incremental gross profit needed to cover them. For Australian brands carrying local freight costs, the threshold usually needs to sit closer to 1.8 to 2.2 times AOV before the maths holds.
The fix. Isolate every order that landed within 10% above your threshold and calculate contribution on that cohort alone. If it comes back thinner than your store average, your bar is too low. Raise it in one move, not incrementally, and watch AOV and order count for four weeks. The free shipping threshold playbook has the full margin-safe method, including how to set the bar per zone rather than nationally.
Profile 3: The Stacked Discount Order
A welcome code, a loyalty reward, a sitewide sale and free shipping were each modelled in isolation. None of them were modelled together. Then a customer finds all four, and the order clears checkout at a price no one in your business ever approved.
Shopify now allows combined discounts by design, which is useful and also exactly how this leak forms. The orders are individually small so they never trip an alarm, and because they are concentrated during promotional periods they get filed mentally as “sale margin” rather than as a policy failure.
The fix. Run a discount audit across the last twelve months and flag every order with two or more discount mechanics applied. Then set a hard floor in Shopify: a maximum total discount percentage per order, free shipping disabled once total discount exceeds a set level, and welcome codes excluded from sale periods. Write the floor down as a rule, because promotional decisions get made quickly in November and nobody recalculates in the moment.
Profile 4: The Serial Returner
Australian return rates have climbed to between 20% and 30% in 2026, and apparel can run as high as 40%. At an average processing cost of around 26 dollars per return, spread across a book of orders at a 20% return rate, returns alone eat roughly 7% of revenue before you have touched a single other cost.
But that 20% is not spread evenly across your customers, which is the entire point. In most stores a small group of customers accounts for a disproportionate share of returns. They order three sizes, keep one, and send two back on your return label. Their gross revenue looks healthy. Their contribution is deeply negative, and because they buy often, your CRM flags them as valuable.
The fix. Add a customer-level return rate field and segment on it. For customers above roughly 40% lifetime return rate, remove them from discount and free-returns campaigns and stop paying to reacquire them. Then attack the root cause: better size guidance, more accurate fit data on the product page and clearer photography. Cutting returns is almost always cheaper than absorbing them, and the returns reduction playbook walks through the levers that move the number without wrecking the customer experience.
Profile 5: The Split Shipment
One order, two or three parcels, because the stock sat across your warehouse and your 3PL, or because a pre-order item was bundled with in-stock items. The customer sees one order. You pay two or three times for freight, two or three times for pick and pack, and you double your exposure to a delivery exception.
Split shipments are the profile founders most often underestimate, because Shopify records the revenue once and the fulfilment cost never rolls up anywhere visible. A store shipping 7% of orders split at two parcels each is running an extra freight event on one order in fourteen, permanently.
The fix. This one is a genuine operations project, not a settings change, which is why it usually ranks as high effort. Start by measuring: what percentage of orders fulfilled in more than one shipment, and what did the second parcel cost. Then work the causes in order of size. Rebalance inventory so your fastest-moving SKUs sit in one location, stop bundling pre-order items with in-stock items at checkout, and set a minimum fill rule so an order waits 24 hours for a complete pick rather than splitting automatically.
Profile 6: The Support-Heavy Order
Some orders generate four tickets before they even ship. Where is it, can I change the address, can I add an item, can I split the payment. Each interaction has a real cost, somewhere between 4 and 12 dollars of loaded labour depending on whether it is your VA or you personally answering at 9pm.
Support cost is the one input founders skip because it feels unmeasurable. It is not. Export ticket counts by order number from your helpdesk, attach a flat internal cost per ticket, and join it to the order export. You will find the tickets concentrate around a small number of predictable triggers, most of them fixable with content rather than headcount.
The fix. Rank your top ten ticket reasons by volume. Anything appearing in more than 5% of orders is a page or a flow, not a conversation. Where-is-my-order questions usually mean your shipping confirmation or tracking page is doing too little. Change and cancellation requests usually mean your post-purchase window is too tight. Every ticket you remove is contribution recovered on the orders that were already thin.
Build the Audit in One Weekend
You do not need a data warehouse for this. You need three exports and a spreadsheet, or one app if you would rather not touch formulas.
The app route: Lifetimely by AMP. It plugs into Shopify and builds a P&L that goes down to order and product level, and the free tier is enough to see the shape of the problem before you commit to anything.
- Install from the Shopify App Store and authorise the sales, customer and order scopes.
- Enter cost of goods per variant. Use landed cost, not supplier invoice cost, or every number after this is wrong.
- Connect your ad accounts so acquisition cost is attributed rather than assumed.
- Add your fixed monthly costs in the expenses section so the P&L reconciles against your accounting file.
- Open the order-level view, export it, and sort ascending by contribution.
The spreadsheet route. Export orders from Shopify Admin under Orders, Export, All orders, and choose the plain CSV for Excel. Export your carrier charges from Starshipit, Shippit or your Australia Post business portal for the same date range. Export ticket counts from your helpdesk. Join all three on order number using a lookup, then add columns for landed cost, discount value, processing fee and a returns provision by category.
Six months of data is the right window. It is long enough to capture a promotional period and a quiet period, and short enough that your cost inputs are still accurate.
The Order Profitability Audit Checklist
Run this once a quarter. It takes a weekend the first time and about two hours every quarter after that.
- Step 1. Rebuild landed cost per variant. Freight in, duty, inbound handling, FX. Not the supplier invoice.
- Step 2. Pull actual carrier charges. From the invoice, not the rate card. Include fuel levies and remote loadings.
- Step 3. Calculate contribution on every order. Revenue minus landed COGS, freight, pick and pack, processing, discount, returns provision and support cost.
- Step 4. Sort ascending and tag the bottom decile. Assign each order to one of the six profiles.
- Step 5. Rank the profiles by total contribution lost, not by order count. The biggest leak is rarely the biggest group.
- Step 6. Fix the low-effort profiles first. Zone pricing, threshold height and discount stacking are policy changes you can ship this week.
- Step 7. Re-run in 90 days and compare the distribution. The target is not zero loss-making orders. It is a shorter tail.
Why This Compounds Faster Than Anything Else You Could Fix
Here is what makes order-level profitability different from almost every other growth project on your list.
Every dollar of contribution you recover is a dollar you did not have to acquire a customer to earn. At a 3% median net margin, recovering 20 dollars of contribution is worth the same as roughly 650 dollars of additional revenue. Three of the six fixes above are pricing and policy changes that cost nothing to implement and take effect on the next order.
It also changes what your other numbers mean. Once you can see contribution per order, your CAC ceiling becomes real rather than guessed, your free shipping threshold becomes a calculated number rather than a copied one, and your discount decisions in November stop being a leap of faith. Half the arguments founders have about ad spend evaporate the moment they know what an average order is actually worth to them.
And it protects you on the way up. Scaling a store with a 12% loss-making tail does not fix the tail. It multiplies it. Every extra dollar of ad spend buys you proportionally more of the orders you should not be taking, which is why brands can double revenue and watch their bank balance go backwards.
Start with the export. Sort ascending. Look at the twenty worst orders you shipped last quarter and ask what they have in common. In almost every store that answer is sitting in plain sight, and it has been costing you money every week you have not looked.
Inside eCommerce Circle, order-level profitability is one of the core pillars we work on with every member, because it is the fastest lever most stores have never pulled. If you want a second opinion on yours, let’s talk.