Most Aussie Shopify founders treat returns like a customer service problem. A ticket comes in. A label gets emailed. The unit comes back. Someone re-tapes the box and puts it on the shelf. Done.
What’s in This Article
That is the most expensive mistake on your P&L, and you cannot see it from the Shopify dashboard. Your gross sales number stays the same. Your refunds line is buried three menus deep. And the actual cost of returns, the shipping, the inspection, the writedowns, the customer LTV impact, never shows up as a single line item.
Here is the reality. The average ecommerce return rate in 2026 sits around 19 to 20%, up from 11% in 2020. Apparel is closer to 25%. And in Australia, the Australian Circular Fashion Association estimates 30% of online purchases come back, with another 30% of those returns unable to be resold because of damage or seasonal timing. That is not a customer service problem. That is a profit problem hiding in plain sight.
The good news: you can drag your return rate down 20 to 40% inside one quarter without trashing your customer experience. The brands doing this well, the Iconic, Showpo, Cotton On, are not doing anything magical. They have built a system. This article is that system, broken into five stages you can implement before EOFY.
What Returns Actually Cost You (The Hidden P&L Hit)
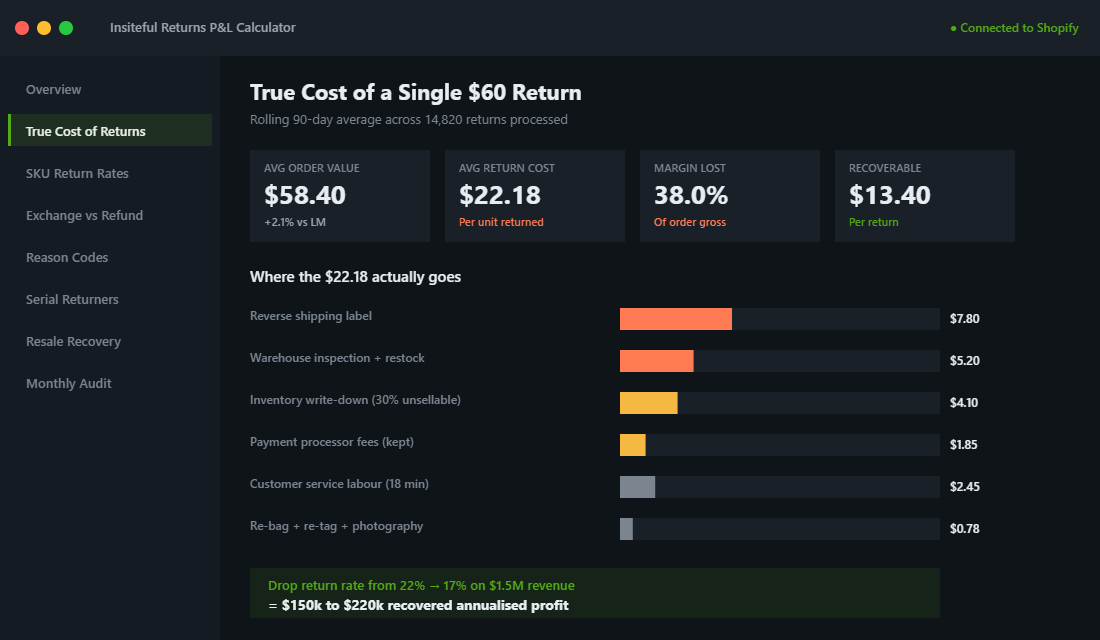
Start with the maths. The average cost to process a single ecommerce return runs between $10 and $40 when you add up the return shipping label, the warehouse inspection, the re-bagging, the relabelling, and the inventory write-down on damaged stock. On a $60 order that came back, you have already burnt 16 to 65% of the gross profit before the customer even asks for a refund.
Now layer in the iceberg costs most founders ignore:
- Reverse logistics shipping. If you offer free returns, every return is a second shipping label you pay for. On a $30 product, that alone is 10 to 15% of the order value gone.
- Inventory shrinkage. Around 30% of returns cannot be resold at full price because of damage, deodorant marks, missing tags or seasonal expiry. That is a markdown to outlet, gifting, or landfill.
- Payment processing fees. Stripe, Shopify Payments and Afterpay all keep their cut on the original transaction. You refund the customer, but the processor does not refund you.
- Marketing waste. You paid the CAC to acquire that order. A refund means your real CAC just doubled on every returned unit.
- Customer service overhead. Every return is 15 to 25 minutes of someone’s time. At 200 returns a month, that is a full week of labour.
Stack it up and a 20% return rate is quietly eating 5 to 20 percentage points of your net margin. For a Shopify store at $1.5M in revenue running 35% gross and 12% net, dropping return rate from 22% to 14% is worth roughly $90k to $140k in recovered profit per year. That is real money, and it shows up in the bank account, not the vanity metrics.
The 5-Stage Returns Reduction Framework
Here is the system we walk every eCommerce Circle member through when their return rate is north of 15%. It works because it stops thinking of returns as one decision (give the money back or not) and starts treating them as five distinct moments where a return either gets prevented, converted, or absorbed.
- Front-load confidence on the PDP. Stop the wrong-buyer purchase from happening in the first place.
- Engineer the post-purchase promise. Reduce buyer’s remorse between checkout and parcel arrival.
- Replace refunds with exchanges and store credit. Keep the revenue when a return is unavoidable.
- Layer in the right returns tooling. Automate the policy, screen out fraud, and route exchanges intelligently.
- Run the monthly returns audit. Find the SKUs and reasons driving the bulk of the cost, and fix them at the source.
Each stage compounds the one before it. Sequence matters. You cannot tool your way out of a bad PDP, and you cannot exchange your way out of a sizing problem you have not diagnosed. Run them in order.
Stage 1: Front-Load Confidence on the PDP
This is the single biggest lever for apparel, footwear, beauty, and any product where fit or expectation drives the return decision. Research by Reedmace and others puts size and fit at the root of 77% of fashion returns. If you cut size and fit confusion in half, you drop overall return rate by 8 to 15 percentage points on its own.
Here is what a confidence-loaded PDP actually contains, in order:
- Model height and size worn. Show it next to the size selector, not buried in an image caption. “Model is 175cm and wears a size S” lets the buyer instantly self-calibrate.
- Fit notes above the fold. Three words is enough. “Runs true to size”, “Take one size up if between sizes”, “Loose fit”. This single line shifts conversion 5 to 10% on apparel PDPs.
- Live size guide popup. Not a PDF link. A modal that loads measurements in cm and inches, plus a “How to measure yourself” diagram. Tools like Kiwi Sizing or Avada Size Chart make this a 20-minute install.
- Photo reviews with the customer’s height and size noted. A real Aussie customer at 168cm wearing the size you are considering is worth ten studio photos. The Iconic uses Fit Analytics for the same outcome and reports a 0.4 percentage point return rate reduction that translated to a 6% net revenue lift.
- Material and stretch callouts. “98% cotton, no stretch” tells the buyer not to expect forgiveness on a tight measurement. This is the one detail most product pages still skip.
- Honest product imagery. Studio photos, lifestyle photos, on-model photos at multiple angles, and at least one detail shot per material variation. Hidden zoom is not enough.
The mental model: every question a buyer might ask after the parcel arrives (“would this stretch?”, “what does the seam look like?”, “is this size 10 a true 10?”), get the answer on the PDP. The cheapest return is the one that never happens because the wrong buyer self-selected out at the product page. (For a fuller breakdown of PDP architecture, see our 5-block product description framework.)
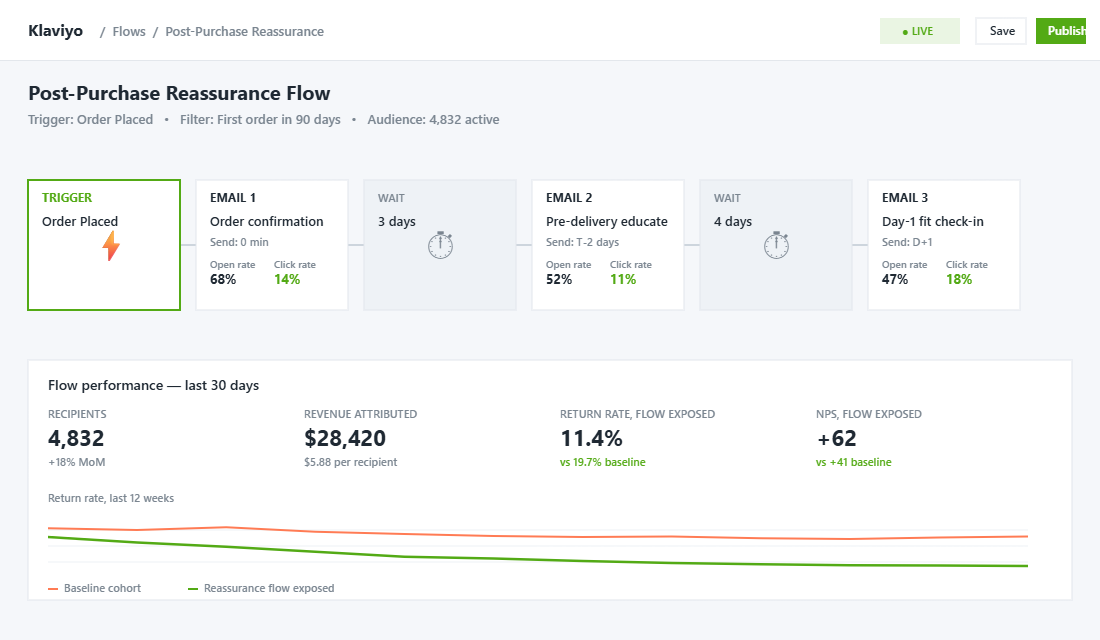
Stage 2: Engineer the Post-Purchase Promise
Buyer’s remorse peaks in the four to seven days between order and delivery. Most founders ignore this window. The brands that take returns seriously use it to reinforce the purchase decision so the parcel arrives to an excited customer, not a regretful one.
Three plays to run inside this window:
- Order confirmation that anchors the win. Most order confirmations look like a tax receipt. Yours should look like a high-five. Lead with “Great call, here is what to expect”, recap the product’s hero benefit, and pre-empt the most common worry (“Your size 10 was the right call because…”).
- A pre-delivery education email. Send a styling tip, an unboxing tease, or a how-to-use guide two days before delivery. This single email lifts product satisfaction scores noticeably and the customer arrives at the parcel primed to love it.
- Day-one post-delivery check-in. A short message asking how the fit went, plus a clear path to exchange (not refund) if it did not. Klaviyo can trigger this off the shipping carrier’s “delivered” event.
Packaging plays into this too. A premium unboxing experience materially reduces returns by triggering the endowment effect. The customer feels they already own a quality product, so the bar to send it back goes up. This is not airy-fairy branding talk. Aussie brands like Vush, Frank Body and Sand & Sky have all leaned heavily into unboxing precisely because it lowers the return rate while it lifts the gifting and UGC moment.
Stage 3: Replace Refunds With Exchanges and Store Credit
Some returns are inevitable. The customer’s body changed, the gift was wrong, the colour read different on a phone screen. Your job at that point is to keep the revenue inside the business. A refund is a customer leaving. An exchange or store credit is a customer staying.
Loop Returns publishes data that across their 5,000+ Shopify merchants, the platform retains 30 to 40% of revenue that would otherwise be refunded, by structuring the return flow to default to exchange or credit. Aftership Returns reports similar numbers on their merchant base. The technique is identical: make the exchange path easier than the refund path, and add a small incentive for credit.
The mechanics:
- Free return shipping for exchanges, paid for refunds. Standard pattern. Exchanges get a complimentary label. Refunds get a $7 to $12 return fee deducted. The customer self-selects to the option that costs them less.
- Bonus store credit. “Take a refund of $80, or take $92 in store credit”. A 10 to 15% bonus on credit captures roughly 40% of customers who otherwise would have refunded.
- Instant exchange shipping. Loop and Aftership both offer “ship the replacement now, before the original comes back”. This collapses the time gap, and the customer mentally treats the return as a sizing swap rather than a relationship-ending event.
- Shop the entire catalogue on exchange. Do not restrict exchanges to the same product in a different size. Let them swap a black hoodie for a navy jumper if that is what they want. The goal is keeping the revenue.
- “Final sale” gate on heavily discounted items. Items at 50%+ off should be marked final sale or store credit only. Discount shoppers return at 2 to 3 times the rate of full-price buyers, and the margin is thinnest precisely where returns hurt most.
One Aussie compliance note before you build this. The Australian Consumer Law requires you to offer a refund or replacement when a product has a major fault, is unsafe, is unfit for purpose, or does not match the description. You cannot dodge that with a store credit rule. The exchange-first flow only applies to change of mind returns, which the ACL does not mandate. Build the policy clearly so the two paths do not get confused, and read the ACCC’s guidance on consumer guarantees if you have not already.
Stage 4: The Tooling Layer
You can run a manual returns process up to a certain volume. Once you cross roughly 50 returns a month, the spreadsheet falls over and you need software. Three tools dominate the Shopify returns space in 2026.
- Loop Returns ($29 to $375 per month). The clear leader for exchange-focused returns. Best for apparel, footwear and any brand where size exchanges are common. The “shop now” exchange flow inside Loop is the closest you get to turning a return into a second sale. If your return rate is over 15% and apparel-heavy, Loop earns its price tag inside one month.
- AfterShip Returns ($11 to $239 per month). The better-balanced option for stores with mixed product types and tighter budgets. Strong fraud-screening rules, custom return windows per product, and a returns portal that does not need a designer to brand. Around 4.7 stars on the Shopify App Store across 2,400+ reviews.
- Returnly / Narvar / Shopify’s native returns app. Useful at the lower end. Shopify’s own returns flow has improved noticeably in 2026 and is worth running if you are sub-50 returns a month and want zero extra app cost.
Whichever you choose, configure it for the policy you want, not the default. Specifically:
- Set the return window to 30 days for full-price, 14 days for discounted, and zero for final sale.
- Require photo upload for damage claims to filter fraud.
- Flag high-frequency returners (more than three returns in 12 months) for manual review.
- Auto-issue store credit for any return reason coded as “change of mind”.
- Route every “wrong size” return into an exchange flow first, refund second.
Stage 5: The Monthly Returns Audit
This is where most stores stop. They install Loop, write a policy, and then never look at the returns data again. That is leaving the biggest improvement on the table. The audit is what turns returns from a recurring cost into a structured improvement loop.
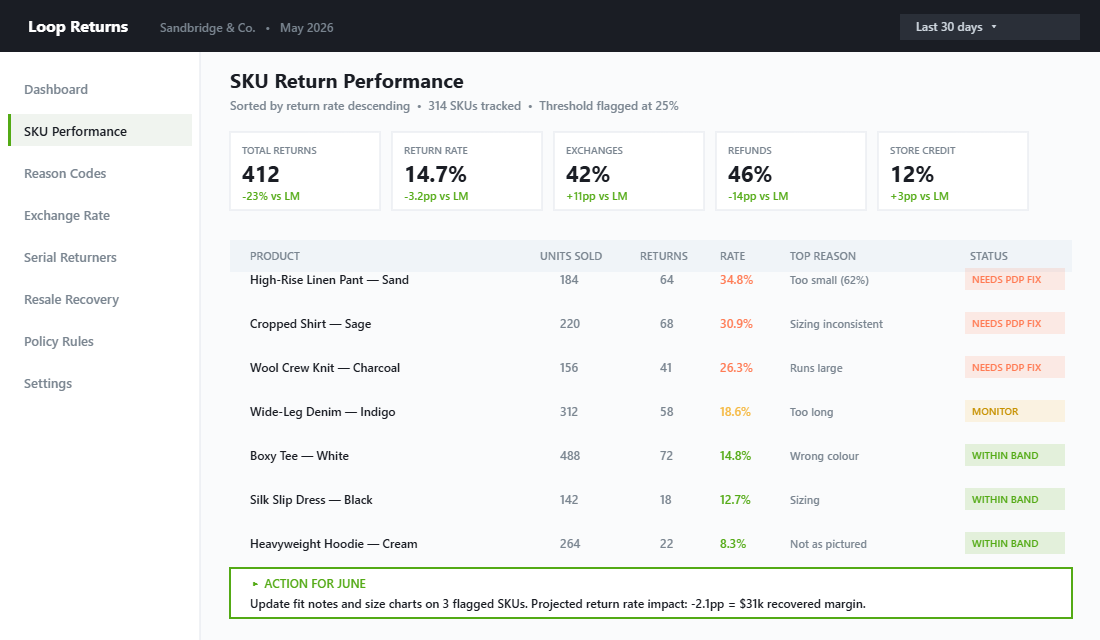
Run this audit on the first business day of every month. Block 45 minutes. Pull the last 30 days of return data and answer five questions:
- Which SKUs are returning above 25%? Sort by return rate descending. Anything over 25% is a problem product. Look at the photos, the fit notes, the reviews. Fix the PDP or pull the SKU.
- What return reasons dominate? Loop and Aftership capture reason codes. If “too small” is the top reason on three SKUs, your sizing is off in those styles. Update the size chart, add the fit note, and watch the rate drop next month.
- Are there serial returners? The top 1% of return-frequency customers often drive 10 to 15% of total returns. Decide if you want to keep them: some are valuable VIPs, some are wardrobing. Flag and treat accordingly.
- What is the exchange rate vs the refund rate? Your goal is 40%+ of returns becoming exchanges or store credit. If you are below 25%, the exchange flow needs more incentive, not more policy changes.
- What is the resale rate? Of the units that came back, what percentage went back on the shelf at full price? If under 50%, you have a packaging, inspection or quality issue upstream.
Action one fix per month. By month four, return rate is materially down. By month twelve, you have built an institutional muscle most competitors do not have. (This is exactly the cadence we recommend inside our contribution margin audit, where returns are one of the four line items most Aussie founders are misreading.)
The Compound Effect: What a 5-Point Drop Actually Looks Like
Worked example. Imagine an Aussie Shopify store doing $1.5M a year at a 22% return rate and 35% gross margin. Run the framework for two quarters. Your return rate drops to 17%. Here is what happens:
- Direct refund savings: 5 percentage points of $1.5M is $75,000 in revenue that no longer leaves the business as a refund.
- Reverse logistics savings: At an average $20 processing cost per return on roughly 1,500 fewer returns a year, that is another $30,000.
- Inventory recovery: Fewer damaged units coming back through inspection. Conservatively another $10,000 to $15,000 in saved write-downs.
- Exchange revenue retention: Of the remaining 17% return rate, capturing 40% as exchanges keeps roughly $100,000 of revenue in the business that would otherwise have walked.
- LTV lift: Customers whose first order ends in a successful exchange repurchase at 2.4 times the rate of customers who refund. That is a compounding tailwind on every cohort going forward.
Bottom line on the worked example: somewhere between $150,000 and $220,000 in recovered annualised profit, plus a LTV lift you will feel for years. That is what an unglamorous, behind-the-scenes operations project looks like when it lands. No new ad creative. No new product launch. Just a tighter system around the unit economics you already have.
Your 14-Day Returns Reduction Sprint
If you have read this far, you have the framework. Here is the implementation cadence we run with members so it actually ships:
- Day 1 to 2: Pull a 90-day returns report. Calculate the true cost per return for your business. Get the number on a whiteboard so the team can see it.
- Day 3 to 5: Audit your top 10 SKUs by return rate. Update fit notes, size charts, photos and PDP copy on the worst three.
- Day 6 to 7: Install Loop, AfterShip or Shopify’s native returns flow. Configure exchange-first, store credit bonus, paid refund.
- Day 8 to 9: Build the three-email post-purchase reassurance sequence in Klaviyo (order confirmation, pre-delivery education, day-one check-in).
- Day 10 to 12: Rewrite the returns policy page so the consumer-friendly language stays compliant with the ACL but defaults to exchanges. Link it from the footer and the cart.
- Day 13 to 14: Schedule the monthly returns audit in the calendar. First Wednesday of every month, 45 minutes, recurring.
Two weeks of focused work. The returns line on your P&L starts moving inside 30 to 60 days as the new cohorts work their way through the post-purchase window.
The Brands Doing This Well
You do not need to invent any of this. Look at what is already working in the Aussie market:
- The Iconic. Uses Fit Analytics for predictive size recommendations. The case study they published shows a 0.4 percentage point return rate cut, which sounds tiny until you realise it lifted net revenue 6%. The lesson: tooling pays even at single-digit return rate movements when you have scale.
- Showpo. Heavy on photo reviews with model height and size noted. Aggressive use of “shop the look” with size cross-references. Their return policy defaults to store credit unless the customer actively clicks through to refund.
- Cotton On. Best-in-class size guides with body type filters. Returns flow defaults to in-store returns (free) over postal (paid), reducing reverse logistics cost significantly at the group level.
None of those moves are exotic. They are deliberate. The pattern across all three is treating returns as an operations and retention problem, not a customer service problem. That is the shift.
One last reframe before you close the tab. Returns are not a customer service KPI. They are a profit KPI. Move them out of the support team’s dashboard and into the founder’s weekly numbers review. The moment that happens, every other decision in the business starts to take returns seriously. (For more on building review collection into the same workflow, see our piece on the Shopify reviews engine, which doubles as a returns reduction tool.)
Inside eCommerce Circle, the returns reduction playbook is one of the operations levers we work on with every member. If you want a second opinion on yours, let’s talk.