Most Aussie Shopify founders are flying blind on attribution and they have no idea.
What’s in This Article
You open Meta Ads Manager, see 142 conversions at a $32 CAC, and think the channel is working. Shopify says you did $48,000 last month. Your accountant agrees the bank account looks right. So far so good. But ask the question that actually matters, the one Meta cannot answer, and the silence is deafening: where did those customers really come from?
Since iOS 14.5 dropped in 2021 and roughly 75% of Apple users opted out of cross-app tracking, Meta’s reported conversions on iOS have been underreported by 30 to 40%, and over-credited on the buyers it does see. The platform claims credit for sales it had nothing to do with, misses the ones it did, and your media buyer optimises into the fog. If you sell a wellness product to women between 30 and 55, the iOS exposure is even worse. You are scaling a black box.
There is a fix. It costs less than your Shopify subscription, runs on autopilot, and pulls zero-party data straight from the customer’s mouth at the moment of purchase. The post-purchase survey is the single biggest attribution upgrade most Aussie Shopify stores can make this quarter, and almost nobody runs it properly.
This is the playbook we use with eCommerce Circle members to take their attribution from “best guess” to “documented”, reroute ad budget by channel, and stop paying Meta for sales TikTok and word of mouth already drove.
Why your dashboard is lying (and getting worse)
Before we get to the script, you need to understand why this matters more in 2026 than it did three years ago.
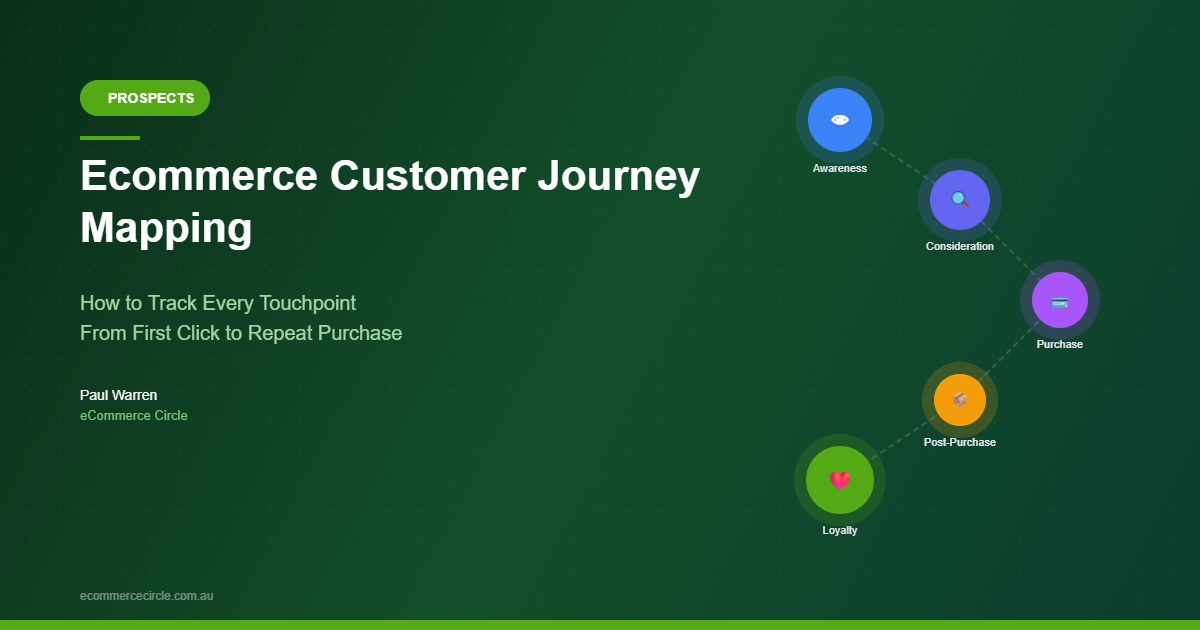
When a buyer clicks a Facebook ad, lands on your store, leaves, sees a YouTube ad, talks to a friend about you, gets a Klaviyo email, and finally buys two weeks later, three things happen. Meta claims the sale via modeled conversions. Google takes credit through GA4 last-click. Klaviyo logs the email click. You see the same sale claimed three times, and your true acquisition story (the friend) appears nowhere.
The structural numbers underneath this are brutal. Meta Ads Manager is currently overreporting conversions by 20 to 40% on iOS. Around 75% of iOS users opt out of App Tracking Transparency, which kills view-through attribution outright. Google’s GA4 default model leans heavily on last click and undercounts paid social. Your bank account knows the truth. Your dashboards do not.
The fix is not a new attribution platform, although those help. The fix is asking the customer. Direct, voluntary, zero-party data. According to the Supermetrics 2025 Marketing Data Report, only 16% of marketers actively collect and use zero-party data, which means this is one of the few attribution edges still available to a $40k to $500k per month Shopify operator without a six-figure data team.
What a post-purchase survey actually is
A post-purchase survey is a short questionnaire shown on the order confirmation page (or in the first 24 hours after checkout) that asks the customer about their experience and how they discovered you. Think two to five questions, maximum. Single-select multiple choice where possible. Free text only where it earns its place.
The flagship question is “How did you first hear about us?” Often shortened to HDYHAU in the attribution world. It captures the original spark of awareness, which is the touchpoint Meta and Google fight over and almost always misclaim. Word of mouth converts roughly 4x faster than a cold Meta ad, but neither platform can see it. The customer can. Ask her.
Response rates on properly placed HDYHAU surveys are not trivial. Fairing reports an average of 54 to 58% completion across stores running more than 1,000 surveys. Email-based survey response rates sit at 20 to 30% on a good day, so the post-purchase placement is doing serious work. The reason is timing. Buyer just paid, dopamine is firing, the discovery journey is fresh in memory. Wait 48 hours and recall collapses.
This is the cheapest, fastest signal you can put into your business. Most stores either skip it or run a generic 12-question survey that almost nobody finishes. Get the script right and you have a permanent stream of zero-party attribution data flowing into Shopify alongside every order. (If you want to pair this with deeper qualitative research, read our Founder-Led Customer Interview Playbook.)
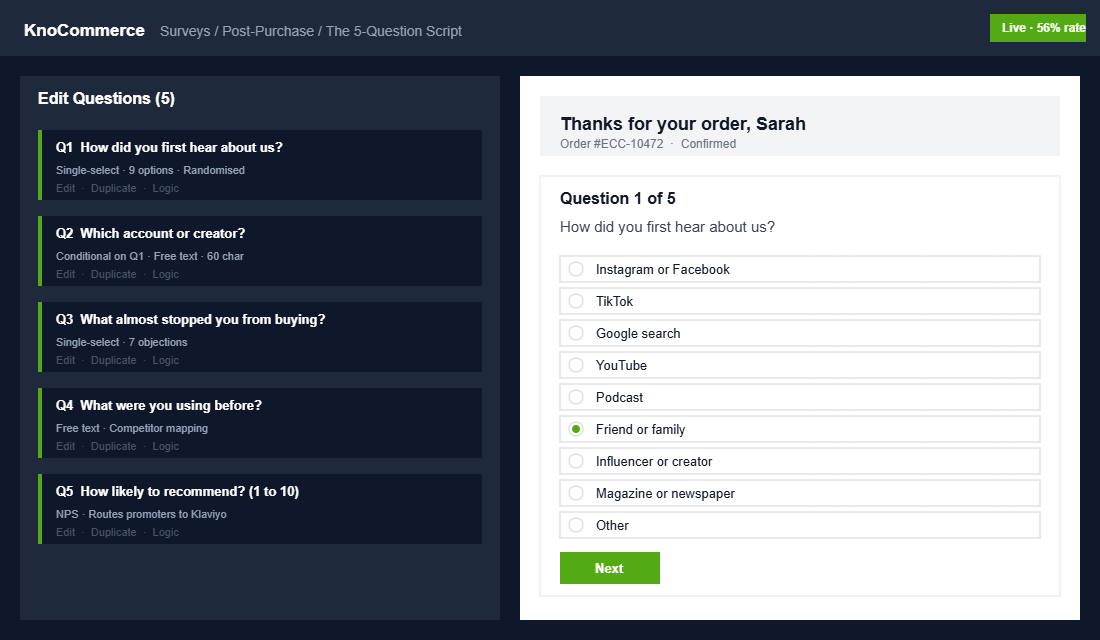
The 5-Question Post-Purchase Survey Script
This is the exact script we recommend to eCommerce Circle members starting from zero. Each question is engineered to answer a different operating decision. Resist the urge to add a sixth. Brevity is what drives the 50%+ response rate.
Question 1: How did you first hear about us?
Options (single-select, randomised order to avoid bias):
- Instagram or Facebook (paid or organic)
- TikTok
- Google search
- YouTube
- Podcast
- Friend or family
- Magazine, newspaper or TV
- Influencer or content creator
- Other (free text)
This is the core attribution question. The free-text “Other” is where the gold lives in the early months. We have seen Aussie founders discover entire channels they had no idea were driving revenue (one beauty brand found that 11% of buyers cited a specific RACV magazine feature from six months prior).
Question 2 (conditional on Q1 = social or influencer): Which account or creator?
Free text. Limit to 60 characters. This is what tells you whether your $4,200 paid partnership with a creator converted, or whether it was the unpaid micro-influencer with 8,000 followers who actually moved the needle. Match these answers back to your campaign list weekly.
Question 3: What almost stopped you from buying?
- Price
- Delivery time
- Lack of reviews
- Sizing or fit concerns
- Didn’t trust the brand yet
- Returns or refund policy
- Nothing, I was already convinced
This is your conversion-rate insurance policy. Every objection that ranks above 8% is a product page or trust-block fix waiting to happen. We have seen founders rebuild their PDP around the top two answers and lift conversion 18 to 25% in the next 60 days.
Question 4: What were you using before?
Free text or category list. Tells you who your real competitor is. Not the brand you assumed. The actual one your buyer was loyal to before she switched. This data informs ad creative, messaging hooks, and your win-back messaging for lapsed customers.
Question 5: How likely are you to recommend us to a friend? (1 to 10)
NPS. Two reasons. First, it gives you a continuous customer-satisfaction signal segmented by acquisition channel (Meta buyers might NPS at 6.3 while word-of-mouth buyers NPS at 9.1, a giant tell about which channel actually delivers fit). Second, you can route promoters (9s and 10s) straight into a referral flow.
Five questions. Under 90 seconds to complete. Fairing-style brands routinely hit 54%+ completion on this exact length. Adding a sixth question drops completion by 8 to 12 percentage points. Stop at five.
Where the survey lives, and why this matters
Placement decides response rate. Get this wrong and your data is biased before it arrives.
The right placement: the thank-you page (order status page). Trigger the survey on the confirmation screen immediately after checkout. The customer has just paid, the page already needs to load, and the survey is contextually invited rather than interrupting another task. Aussie completion rates we see on this placement: 48 to 62%.
The wrong placement: an email survey 24 hours later. Open rates of around 35%, click rates around 4%, completion rates around 1.5%. Useful only as a backup if the customer skipped the on-site version.
Never on the shipping confirmation page. By the time that email lands, the buyer is thinking about delivery, not how she found you. Recall has decayed and the response is mostly “Instagram” because Instagram is recent and top of mind. You will systematically over-credit Meta and miss long-tail discovery channels.
The other rule: only show the survey on the first order. Repeat customers already answered. Forcing them through it again degrades the experience and pollutes the dataset.
The tool stack: Fairing, KnoCommerce, or DIY
You have three real options. Pick based on store revenue and team capacity, not what an agency tells you.
Option 1: Fairing (formerly Enquire Labs). The premium pick. Built for Shopify Plus and fast-scaling Shopify brands. Native integrations with Klaviyo, GA4, Meta, TikTok, Shopify Flow, and 25+ other platforms. LTV and AOV segmentation by acquisition source out of the box. Pricing starts around US$199/month for 10,000 responses. If you are doing $200k+ per month in revenue, this is the tool. Setup is genuinely 15 minutes and the dashboard does not require an analyst to read.
Option 2: KnoCommerce. The smart-money mid-market pick. Sub-$100/month entry tier, advanced attribution modeling, breakdown of survey responses across 60+ Shopify attributes (AOV, products purchased, repeat status), pre-built templates. Slightly weaker LTV integration than Fairing, but for stores between $40k and $200k per month it is the right tool.
Option 3: DIY via Shopify Checkout Extensibility. Free, but engineering required. Build a custom checkout extension that captures the HDYHAU answer to an order metafield, then surface it in Shopify Analytics or pipe it to GA4 via custom dimensions. Works only if you have a developer and a clear analytics plan. Most founders should not start here.
For the average Aussie Shopify operator reading this, KnoCommerce is the default. Install today, go live tomorrow, see your first 100 responses inside a fortnight at most stores.
Setup steps for KnoCommerce (15 minutes):
- Install KnoCommerce from the Shopify App Store. Accept the Order Status page injection permission.
- Open the Survey Builder. Start with the “Marketing Attribution” template.
- Customise Question 1 with the Aussie-appropriate channel list above. Add TikTok and “Friend or family” as their own options (these are missing from some default templates).
- Add Questions 2 through 5 from the script. Keep all single-select where possible.
- Set targeting to “First-time customers only” and “All product categories”.
- Set display to “Order Status Page, immediate” (not the email fallback).
- Connect Klaviyo and GA4 in the Integrations tab. Map NPS responses to a customer property in Klaviyo so promoters auto-enroll in a referral flow.
- Turn it on. Walk away. Come back in seven days to review the first dataset.
How to read the data (and what to actually change)
Collecting the data is the easy part. Acting on it is where most stores stop.
A good post-purchase survey dashboard answers three questions in under five minutes of review per week:
1. Which channel actually drove this month’s revenue?
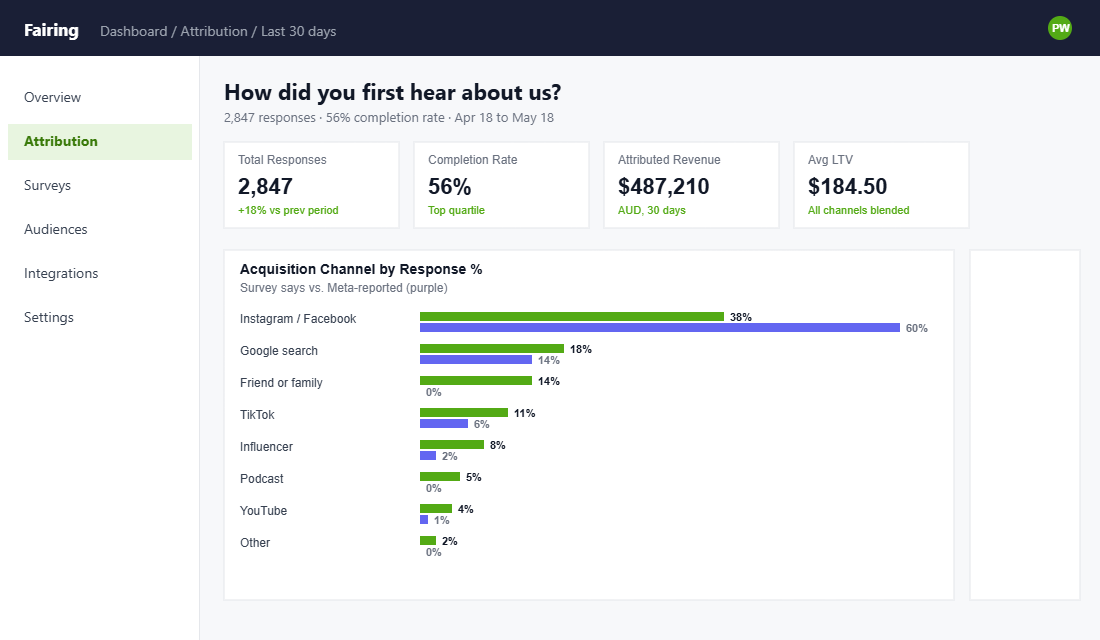
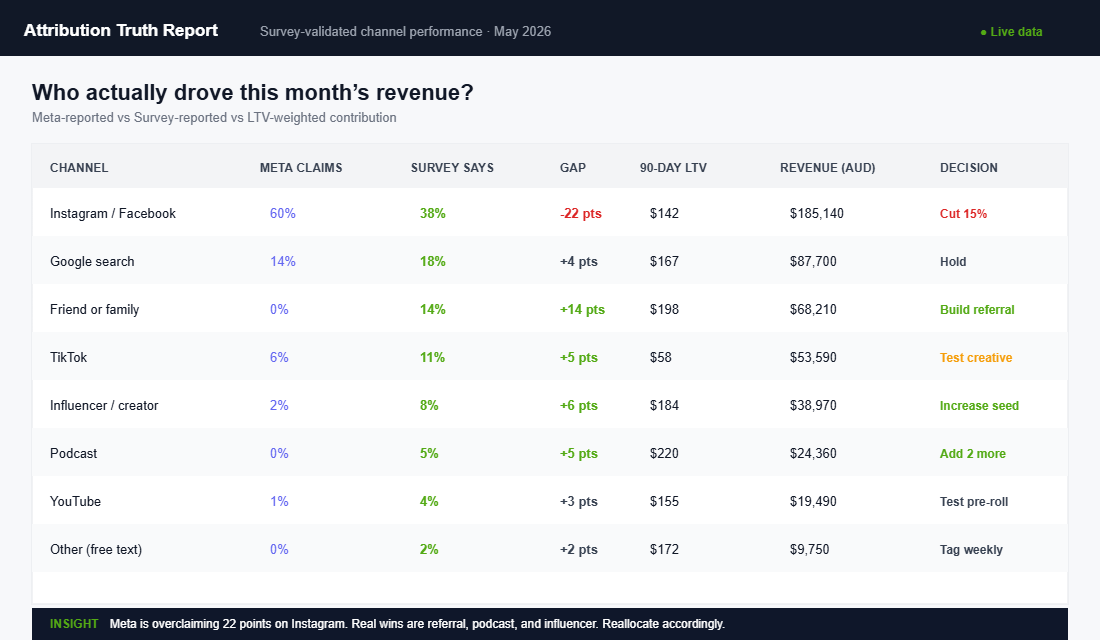
Look at HDYHAU responses weighted by AOV and customer count. Meta might claim 60 conversions in Ads Manager. Your survey might show that only 38% of buyers said Meta was where they first heard about you. That is a 22-conversion gap, often caused by branded search and word-of-mouth being miscredited to paid social. This gives you permission to test cutting Meta budget 15 to 20% and reallocating to the channels that actually surfaced in the survey.
2. What is the LTV by acquisition channel?
This is where Fairing and KnoCommerce earn their fee. If TikTok buyers have a 90-day LTV of $58 and Meta buyers have a 90-day LTV of $142, your CAC tolerance for those two channels is wildly different. Most founders treat all CACs equally. They should not. We have seen Aussie brands pause TikTok spending entirely once they discovered TikTok-acquired customers churned at 3x the rate of Meta-acquired customers. That is a five-figure-per-month decision driven by one column of survey data.
3. What is the conversion blocker for new buyers?
Question 3 (“What almost stopped you?”) is your conversion roadmap. Top objection over 15%? That is your A/B test for the next 30 days. We had a member discover 22% of buyers cited “sizing concerns” as the near-block. They added a video-based sizing guide on every PDP and lifted conversion 27% the following month. That insight cost $89/month in survey software and a Saturday morning’s filming work.
If you want to take this further, segment your full funnel by HDYHAU answer using the Marketing Efficiency Ratio (MER) framework, or layer it on top of geo-holdout incrementality tests to triangulate channel truth.
The five mistakes that kill survey accuracy
You will get garbage data if you make any of these. We see them every week.
- Too many questions. Anything over five drops completion below 30%. A two-question version often outperforms a 12-question one on net signal per dollar. Be ruthless.
- Question order bias. Always randomise the answer options on Q1, otherwise the top option (usually Instagram by alphabet) gets a 6 to 9% lift purely from listing position.
- Showing it to repeat customers. They already answered. Repeat exposure trains them to ignore it. Filter to first-time buyers only.
- Email-only delivery. As noted, response rates collapse, and worse, the responders skew older and more brand-loyal, which biases your channel mix toward whatever drives that demographic.
- Treating Other as throwaway. The free-text “Other” responses are often where the most actionable insight hides. Read them weekly. Tag them. New options usually emerge within the first 200 responses.
Run the survey for 90 days before you make big budget moves. Statistical significance on a 200-order-per-month store needs at least 8 to 10 weeks of data. We have seen founders panic-cut Meta after two weeks of survey data, only to discover the dataset was too small.
The compound effect: from data to decisions
Here is the part most playbooks skip. A post-purchase survey only matters if it changes how you operate. Three compound moves we see Aussie eCommerce Circle members make once the data is flowing:
Reallocate ad budget by survey-validated channels. When Meta claims 65% credit and the survey shows 41%, the 24-point gap is usually borrowed from word of mouth, podcasts, and influencer organic. You cannot scale word of mouth directly, but you can scale referrals. We routinely see brands shift 15 to 25% of Meta budget into a referral program, gifted creator seeding, and PR within 90 days of starting the survey.
Rebuild PDP and trust elements around objections. Question 3 answers are your conversion-rate roadmap. Top objection becomes Q1 of every PDP redesign brief. This is the single fastest way to lift store-wide conversion 15 to 30% in a quarter.
Route promoters into a referral flow. Buyers scoring 9 or 10 on NPS in Question 5 should land in a Klaviyo flow within 24 hours offering them a friend-referral incentive. Magic Spoon famously hit a 65% subscription rate by treating high-NPS buyers as their most valuable marketing channel. The same principle works for any Aussie DTC brand.
The compound math works like this. A store doing $80k per month, with a 3% Meta-reallocation lift, a 20% PDP conversion lift from objection-fixing, and a 5% referral-flow contribution from NPS promoters, adds roughly $15k to $22k per month in net new revenue inside 90 days. Survey software runs $89 to $199 per month. That is a 10x to 25x return on the tooling, before counting the time saved by no longer guessing.
Your 7-day rollout
If you have read this far, here is what to do this week.
- Monday: Install KnoCommerce or Fairing. Load the 5-question script above.
- Tuesday: Connect Klaviyo and GA4 integrations. Map NPS to a customer property.
- Wednesday: Soft-launch the survey to 50% of new orders. Watch completion rate. Aim for 45%+. If lower, the placement is wrong, not the script.
- Thursday: Build a “promoters” Klaviyo segment (NPS 9 or 10) and queue a referral email.
- Friday: Set a recurring Sunday-night 30-minute review block in your calendar. Review last week’s responses, tag the “Other” entries, log one decision based on the top objection.
- Weekend: Live with it for 30 days. Resist the urge to add questions.
- Day 30: First real budget decision based on data.
That is the entire system. No agency, no analyst, no extra headcount.
Pulling it all together
The brutal truth of Shopify attribution in 2026 is that Meta and Google are not going to give you a clean answer. The platforms have economic incentive to claim credit they did not earn. Apple’s privacy framework has made the underlying tracking unreliable for at least 75% of your iOS buyers. And the only attribution channel that is structurally getting more accurate, not less, is the one most stores ignore: the customer herself.
A 5-question post-purchase survey, properly placed, with the right tool, reviewed weekly, will tell you more about your real growth channels in 90 days than three years of dashboards. It is the single biggest unfair advantage available to a hands-on Aussie founder doing under $1m per month, and it costs less than your monthly Shopify Plus seat. If you only fix one thing this quarter, fix this.
Inside eCommerce Circle, attribution and customer research are two of the core pillars we work on with every member. If you want a second opinion on your post-purchase data (or whether you should even be running the survey yet), let’s talk.