You spent $42,000 on Meta last month. Ads Manager says you generated $168,000. A 4x ROAS. Your accountant pulls the P&L and the number does not match. Revenue grew $11,000 month on month. Not $168,000.
What’s in This Article
Welcome to the most expensive lie in eCommerce.
Reported ROAS is no longer real revenue. Since iOS 14.5 rolled out, Meta has been guessing at conversions it cannot see. Apple’s App Tracking Transparency means roughly 75 to 85 percent of iOS users opt out of cross-app tracking, so Meta loses visibility on most of your iPhone customers. Then in March 2026, Meta changed the click-through definition so engagement actions like likes, shares and saves no longer count, dropping reported ROAS by 15 to 30 percent overnight. Across 3,014 ecommerce advertisers tracked through Meta’s Andromeda rollout, average ROAS fell 7 percent. Prospecting ROAS fell 13 percent.
None of that reflects real sales. The sales were always there. The reporting just changed.
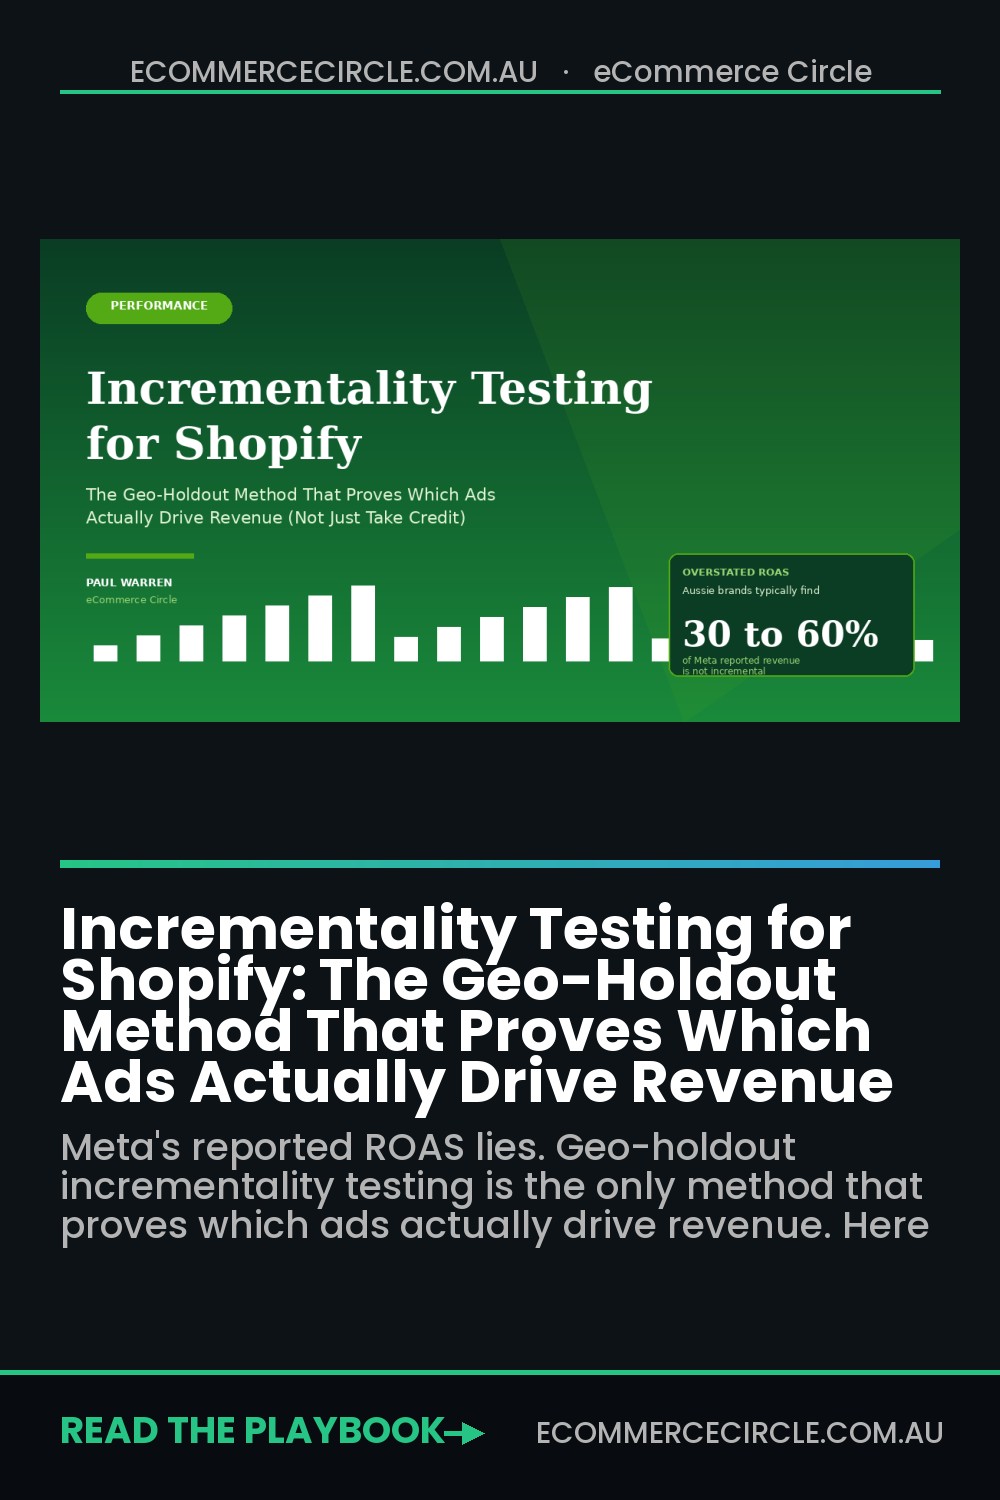
If you are still making spend decisions off Ads Manager ROAS, you are flying half blind on 60 percent of actual data. The fix is not another attribution tool. The fix is incrementality testing, and the cleanest version of it for Aussie Shopify brands is a geo-holdout. It is the only method that gives you a defensible answer to the question every founder is asking right now: “If I switched off this channel tomorrow, how much revenue would I actually lose?”
Why Multi-Touch Attribution Cannot Answer That Question
Multi-touch attribution (MTA) is what every dashboard tool sells you. Triple Whale, Polar, Northbeam, Rockerbox. They stitch together pixel data, server-side events, UTM tags, and probabilistic modelling, then assign credit across touch points. It is useful. It is also fundamentally a correlation engine, not a causation engine.
MTA can tell you “this customer saw a Meta ad before they bought”. It cannot tell you whether they would have bought anyway. If your top brand-search Google campaign converts at 11x ROAS, MTA gives it 11x of credit. Incrementality testing gives it whatever percentage of those sales would not have happened without the ad. Often that number is 20 percent. Sometimes it is zero.
A widely cited test by a major US grocery chain switched off all non-branded paid search across 12 test markets. The geo-holdout measured the sales lift at exactly 0 percent. The campaign that Ads Manager said was driving millions in revenue was driving none of it. Customers were finding them anyway through organic search.
A specialty retailer ran the same test on its catalog program. The vendor claimed a 40 percent contribution to revenue. The incremental lift was 14 percent. The other 26 percent was paid credit for sales that were always going to happen.
This is the gap incrementality testing closes. Attribution tells you who got the touch. Incrementality tells you what the touch actually caused. For brands spending more than around $30,000 a month on paid acquisition, that gap is usually the difference between profitable and unprofitable.
What Incrementality Testing Actually Is
Incrementality is the percentage of conversions that would not have happened without the marketing intervention. The cleanest way to measure it is to run a controlled experiment. You expose one group to the marketing, hold another group out, and compare results.
There are four practical methods Aussie Shopify brands use:
- Platform-native conversion lift studies. Meta and Google offer these for free. You provide a target audience, they split it into test and holdout, and report incremental conversions over a few weeks. Useful at smaller spend. Limited because Meta is grading its own homework.
- Geo-holdout tests (geo-lift). You pick a set of postcodes, states or DMAs, you turn ads off in those regions for a defined window, and compare revenue against matched control regions. Causal. Defensible. Works for any channel. This is the method that scales.
- Marketing mix modelling (MMM). Statistical regression across years of spend and revenue data. Great for board-level decisions but slow, expensive, and useless for week-to-week trading.
- Synthetic control modelling. A 2025 to 2026 evolution. Instead of one holdout region, the algorithm builds a synthetic version of your treated market by weighting many similar regions together. Dramatically reduces noise and false positives.
For Aussie founders running $50k to $500k a month on Meta and Google, the workhorse method is geo-holdout. It is the right blend of statistical rigour and operational simplicity. The rest of this article walks through how to run one properly.
The 7-Step Geo-Holdout Framework
Here is the exact framework I run with eCommerce Circle members when we sit down to plan a test. Each step matters. Skip one and you get a result you cannot trust.
Step 1: Pick the channel to test. Test one channel at a time. Most Aussie Shopify brands start with Meta because it is usually the largest line item and the one with the biggest gap between reported and real ROAS. If Meta represents more than 40 percent of your paid budget, that is where the most uncertainty lives, so that is where the test pays off.
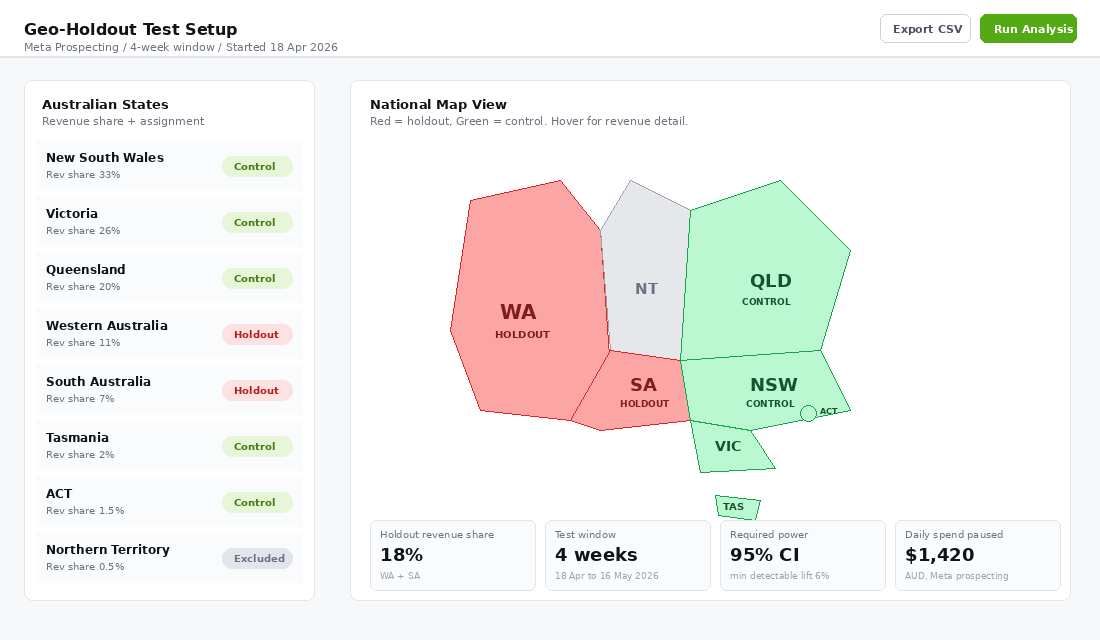
Step 2: Define the question precisely. “Does Meta work” is not a question. “If we paused all Meta prospecting in Western Australia and South Australia for four weeks, how much revenue would we lose?” is a question. Specificity makes the test designable.
Step 3: Choose the geography. In Australia, state-level holdouts are usually the cleanest unit because each state has enough volume to produce statistical power. WA and SA together typically account for 18 to 22 percent of national ecommerce revenue, which is a reasonable holdout size. Brands with smaller spend can run postcode-cluster tests, grouping ten to fifteen postcodes that match their treatment regions on demographics and historical revenue.
Step 4: Set the test window and budget. Run for at least four weeks. Two is not enough for statistical power on the kind of revenue volumes most Aussie brands see. Hold all other marketing levers flat in both regions. No promo changes. No new product launches. Just one variable.
Step 5: Set up tracking before you start. This is where most tests fall over. You need clean revenue data segmented by region. The minimum stack: Shopify orders pulled by shipping state, GA4 audience segmented by region, and an export of Meta and Google spend by geo. Hooking this into a server-side setup makes the data far cleaner. If you have not done that yet, our server-side tracking guide for Shopify walks through it.
Step 6: Run the test and resist the urge to peek. The hardest part. When revenue dips in your holdout regions in week two, the temptation to switch ads back on is enormous. Do not. The whole point of the test is to measure the dip. Pull the trigger early and you have no result, only a guess.
Step 7: Read the result with confidence intervals. Do not just compare topline revenue. Compare revenue per session, conversion rate by region, and AOV. Calculate lift as (treatment revenue minus control revenue) divided by control revenue. Then check whether the result is statistically significant at a 90 or 95 percent confidence interval. A 4 percent lift sounds nice, but if the noise band is plus or minus 8 percent, you have not learnt anything.
Real Numbers: What Aussie Brands Are Finding When They Run the Test
The benchmark data from 2024 to 2026 across DTC ecommerce brands is humbling. Here is what tends to come back when brands run their first proper incrementality test.
- Meta prospecting incremental lift typically lands between 12 and 25 percent. Not the 4x ROAS Ads Manager reports. The dollars are still real, but they are about a third to a half of what the dashboard claims.
- Meta retargeting incremental lift is often under 10 percent and sometimes near zero. Most retargeted customers were already going to buy. This is the spend that quietly destroys margin in fashion and beauty brands.
- Branded Google search incremental lift is often under 15 percent. A big chunk of those customers find you through organic. One Australian beauty brand we worked with cut branded search spend by 60 percent after a geo-lift and saw national revenue drop by less than 4 percent. Net contribution improved.
- TikTok lift is usually higher than Meta when measured properly. TikTok’s pixel under-reports more aggressively than Meta’s, so reported ROAS understates real impact. Brands often find genuine 30 to 50 percent lift on TikTok prospecting.
- YouTube and Pinterest tend to show small but real lifts, in the 5 to 12 percent range, that almost never show up in last-click reports.
These ranges are why founders flip from “Meta is our hero channel” to “TikTok is our hero channel” within one test cycle. The hero channel was just the one with the best self-reporting pixel.
A 25 percent incremental lift from a refreshed prospecting strategy is the upper end of what is realistic. One US-based DTC apparel brand documented exactly that, an eight-week geo-lift that drove a 25 percent increase in incremental revenue. Aussie brands at $1m to $5m annual revenue are seeing similar effects when they take the test seriously.
The Tool Stack: What to Use at Each Stage
You do not need enterprise software to start. You need the right tool for your scale.
Under $50k a month in paid spend. Run Meta and Google’s free native conversion lift studies. Add a manual geo-holdout twice a year using Shopify and a spreadsheet. The maths is not complicated. The discipline of running the test is what matters.
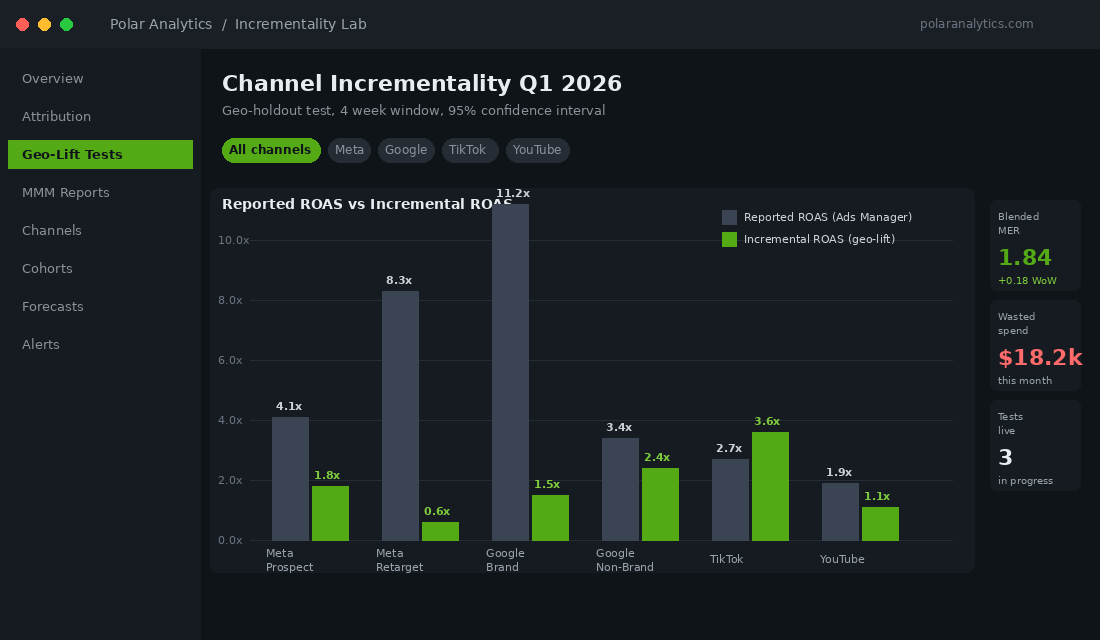
$50k to $150k a month. This is where dedicated geo-lift tooling pays for itself. Polar Analytics has built-in GeoLift causal testing using the open-source Meta methodology, and pricing typically sits around $1,000 a month for a $6m GMV brand, depending on integrations. The advantage over a spreadsheet is the synthetic control modelling, which gives you cleaner reads on less data.
$150k a month and up. Northbeam runs around $1,500 a month for the Starter tier and $2,500 for Professional. Includes MTA, MMM, and incrementality in one dashboard. Haus is the specialist for $1m to $3m monthly spend, running geo-experiments as their core product and integrating with most ad platforms.
Enterprise and Plus. MMM plus incrementality plus a clean data warehouse, usually built on Snowflake or BigQuery. You are running tests continuously, not occasionally, with a dedicated analyst owning the calendar.
Most Aussie founders we work with at eCommerce Circle land in the Polar Analytics bracket. The combination of GeoLift, dashboards, and a Shopify-native data warehouse is the sweet spot for a brand doing $3m to $15m annually. Pair it with our Marketing Efficiency Ratio framework and you have a measurement stack that will actually survive Meta’s next attribution change.
Reading the Output: The 4 Verdicts a Geo-Holdout Produces
Every geo-holdout ends in one of four verdicts. Knowing how to act on each is what turns the test from interesting to profitable.
Verdict 1: Strong incremental lift. Lift is comfortably above zero with tight confidence intervals. Action: increase spend on this channel. The reported ROAS in Ads Manager is a directional signal of a real revenue driver.
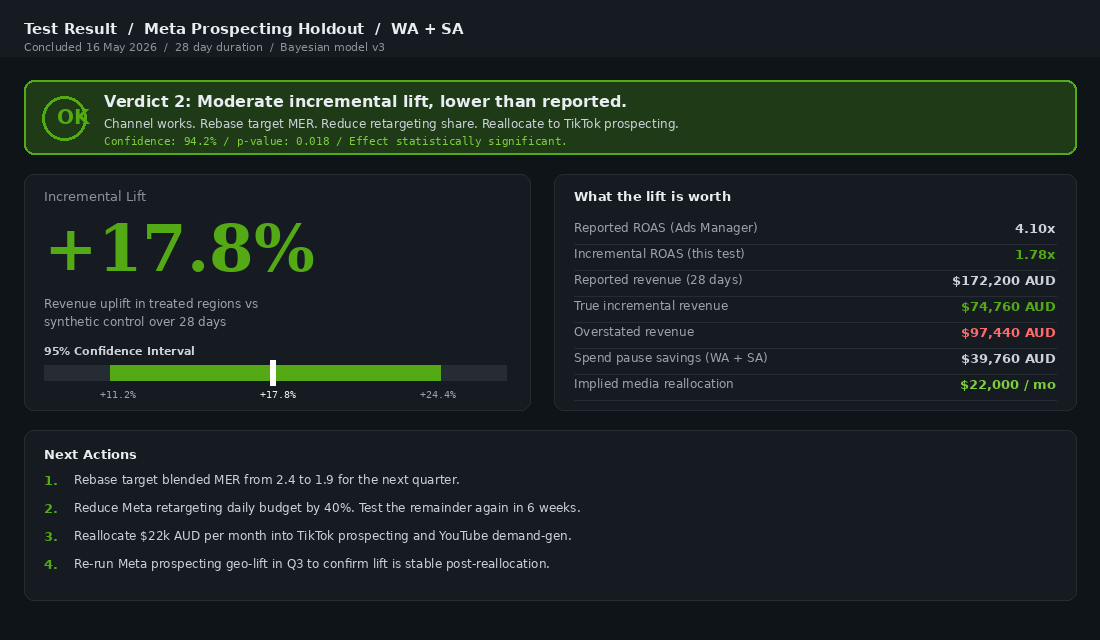
Verdict 2: Moderate incremental lift but worse than reported. Lift exists, but it is 30 to 50 percent of what the platform claims. Action: rebase your blended ROAS expectations downward and reset your target MER. The channel still works. It just does not work as well as the dashboard sells it.
Verdict 3: No measurable lift. Lift sits inside the noise band. The channel might be doing something, but you cannot prove it. Action: cut spend by 30 percent, run the test again at the lower level. If lift stays zero, kill or shrink the channel. The savings are pure margin.
Verdict 4: Negative or near-zero lift on a “winner”. Your highest reported-ROAS channel turns out to be all credit, no causation. This is the conversation that changes the business. Most brands find this in branded search and retargeting. Reallocating that spend into prospecting on TikTok, YouTube or Meta cold audiences is often the single biggest revenue lever they pull all year.
The verdict you fear most is verdict 4. The verdict that pays best is also verdict 4.
The Compound Effect: Why One Test Cycle Rewrites Your Entire Media Mix
Here is what happens when a brand runs its first proper incrementality test cycle.
Month one: you set up the test. You feel slightly anxious because you are about to switch off a chunk of spend in a region. The team pushes back. You hold the line.
Month two: results come in. You discover that 22 percent of your reported Meta revenue was not real. You also discover that TikTok is materially under-reported and YouTube has a small but real incremental lift you had been ignoring.
Month three: you reallocate $18,000 a month of spend out of retargeting and branded search, into TikTok prospecting and YouTube demand-gen. Total spend stays flat. Real revenue lifts 9 percent. Net contribution lifts more because the new mix is profitable rather than cannibalistic.
Month four onward: you run a new test every quarter. Every cycle finds one more piece of wasted spend or one more underweighted channel. By the end of year one, you have rebuilt your media mix around what actually causes revenue rather than what gets credit for it.
This is the work the brands that scale past $5m annually are doing, and the brands that stall at $2m are not. The difference is not creative. The difference is they know what is actually working. Pair the test results with the Profit-Per-Visitor framework and you get a complete picture of which channels drive profit, not just clicks.
Your 30-Day Action Plan
If you are spending more than $30k a month on paid acquisition and you have never run a geo-holdout, here is the order of operations.
- Week 1. Audit your current measurement. Pull blended MER for the last 90 days. Pull Meta and Google reported ROAS. Note the gap. Set up clean state-level revenue reporting in Shopify if you have not already.
- Week 2. Pick the test. Most brands start with a Meta prospecting holdout in WA and SA. Document the question, the geography, the window, and the success criteria before you touch anything.
- Week 3. Run a free Meta conversion lift study while you set up the geo-holdout. It will give you a directional baseline before the main test starts.
- Week 4. Begin the geo-holdout. Switch off Meta prospecting in WA and SA for four weeks. Hold everything else flat.
- Weeks 5 to 8. Run the test. Do not peek. Keep all other marketing levers steady.
- Week 9. Analyse the results. Compare against confidence intervals. Make the spend reallocation decision based on the verdict.
If you are not at the spend level to justify Polar or Northbeam yet, a clean spreadsheet, Shopify analytics, and Google Sheets is enough to start. Discipline beats software at this stage. The tool buys you precision later.
The Bottom Line
The brands that win the next five years of paid media are not the ones with better creative. They are the ones who actually know what is working. Incrementality testing is the unsexy, unglamorous work that separates founders running a real performance operation from founders managing a dashboard.
Inside eCommerce Circle, this kind of measurement discipline is one of the core pillars we work on with every member. If you want a second opinion on your media mix before you spend another quarter optimising the wrong numbers, let’s talk.