Your Shopify store loads in 4.2 seconds on mobile. The shopper you spent $42 to acquire on Meta gives you 3 seconds. Forty percent of them are gone before your hero image finishes painting, and you never see them in your analytics because they never made it to a page view that counts.
What’s in This Article
This is the quietest tax on Aussie ecommerce. Most founders treat speed as a technical problem for “later”, something the developer should look at when there is time. They obsess over creative, offers, and ad targeting while their LCP sits at 4.8 seconds and their checkout abandon rate climbs every month. Then they wonder why their CPA keeps creeping up.
Speed is not a tech problem. Speed is a margin problem. Every 0.1 second you shave off mobile load time lifts conversion by roughly 8.4% according to a Google and Deloitte study of 30 million sessions. Get from 4 seconds to 1.5 seconds and you can quietly add 20 to 35% to mobile revenue without spending another dollar on ads. This article is the 6-lever audit we run on every Aussie Shopify store inside eCommerce Circle.
Why Page Speed Is the Hidden Tax on Most Aussie Shopify Stores
The numbers are brutal once you actually look at them. Shero Commerce benchmarked 1,000 real Shopify stores in early 2026 and found only 48% pass all three Core Web Vitals on mobile. Hyperspeed audited 1,166 stores and found the average PageSpeed score sits at 30 out of 100. Your competitors are not faster than you. They are all slow together. The brand that breaks out of the pack wins.
Here is the gap that matters. Stores that load in under 2 seconds convert at 2.4%. The Shopify average is 1.4%. The fastest 10% of stores convert between 3.2 and 5.2%. If your mobile conversion rate is 1.2% and you do $80K a month, a jump to 2.4% means you are doing $160K a month from the same traffic. That is not a marketing line. That is an arithmetic line.
Mobile is where this hurts most. Mobile drives 74 to 78% of Shopify traffic but only 55 to 62% of revenue. The gap is conversion. The gap is speed. Aussie shoppers on 4G in a regional area are not getting the same experience as you on your office wifi looking at the desktop preview. If you have never opened your store on a real phone with throttled 4G connection, you have no idea what you are actually shipping to customers.
Lever 1: The PageSpeed Insights Diagnostic (How to Read It Properly)
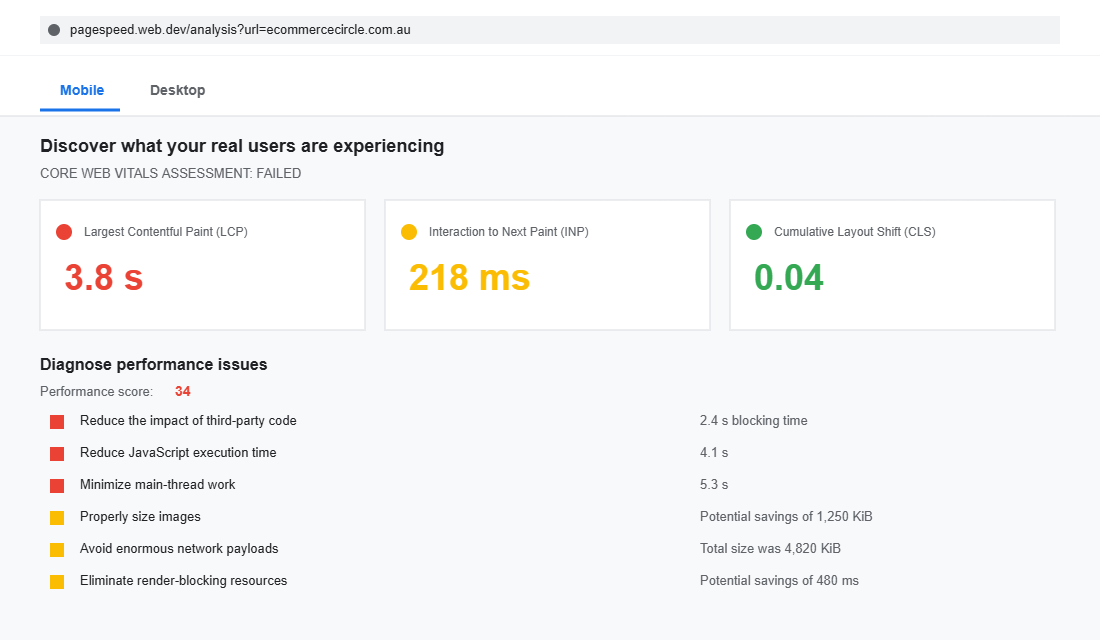
Every audit starts the same way. Open pagespeed.web.dev and paste your homepage URL, then your top-selling product page, then a collection page. Always run mobile first. The desktop score is a vanity metric on a Shopify store where 75% of traffic is mobile.
You are looking at two distinct sections. The top section is Core Web Vitals from real users, which is the data Google uses for SEO and rankings. The bottom section is the lab-based Lighthouse score from a single simulated load. Most founders fixate on the score number at the bottom. Stop doing that. The Core Web Vitals at the top are what matter.
Here are the three numbers you need to know and what counts as good:
- LCP (Largest Contentful Paint): Under 2.5 seconds. This is when your biggest visible element (almost always your hero image) finishes loading. The median Shopify store sits at 2.26 seconds, dangerously close to the fail line.
- INP (Interaction to Next Paint): Under 200 milliseconds. This measures how snappy the store feels when a shopper taps. The median Shopify store sits at 153ms, which is okay but apps push this up fast.
- CLS (Cumulative Layout Shift): Under 0.1. This measures how much the page jumps around as it loads. The Shopify median is excellent at 0.01, but custom theme work and lazy-loaded images can wreck it overnight.
You also want to scan the diagnostics in the “Performance” and “Best Practices” sections. The diagnostic phrases to circle are: “Reduce JavaScript execution time”, “Reduce the impact of third-party code”, “Minimize main-thread work”, “Properly size images” and “Avoid enormous network payloads”. These five phrases will appear on 90% of Shopify audits, and they tell you exactly which of the next 5 levers to pull.
Lever 2: The App Stack Audit (The 60-80% Issue)
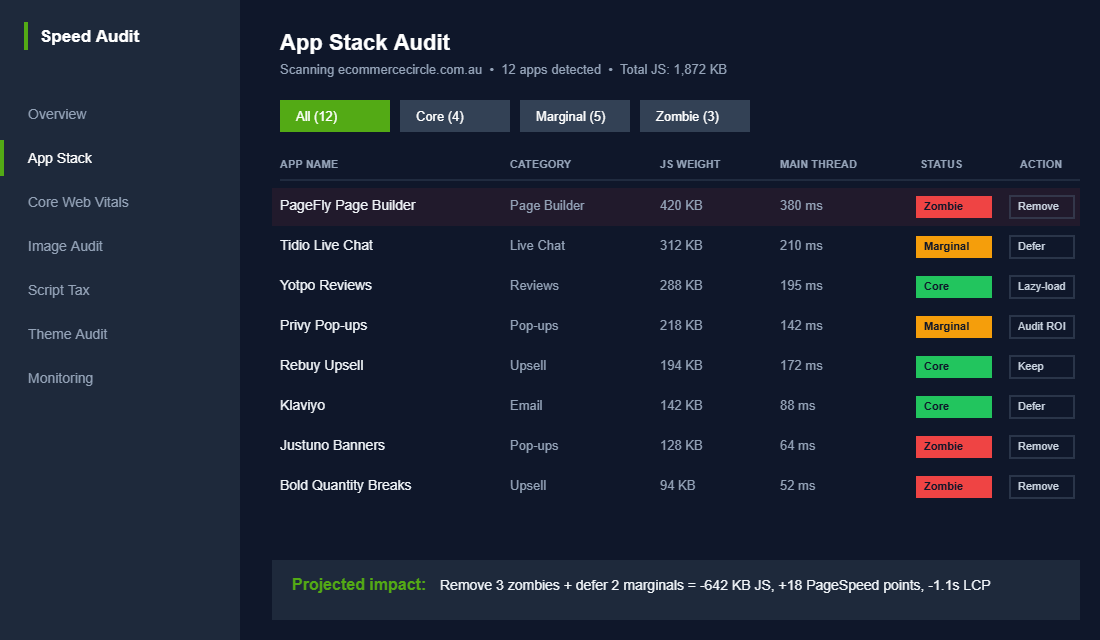
This is the biggest single lever and the one most founders avoid because it means uninstalling apps they think they need. Third-party scripts account for 62% of total JavaScript on the average Shopify store. App scripts cause 60 to 80% of Shopify slowdowns. A clean Dawn or Horizon theme scores 90+ on PageSpeed. The same theme with 5 to 10 apps installed drops to 40 to 65. Apps are almost always the problem.
The biggest offenders, ranked by JavaScript weight:
- Page builders (200-600KB): PageFly, Shogun, GemPages. They inject JavaScript on every page even if you only built one landing page. Brutal for speed.
- Live chat widgets (200-400KB): Tidio, Gorgias chat, Tawk. They load on every page whether anyone uses them or not.
- Review apps with photo galleries (150-500KB): Yotpo, Judge.me, Stamped. Some load the entire review database on the PDP.
- Popup tools (100-300KB): Privy, Justuno, OptinMonster. They sit on every page waiting to fire.
- Upsell apps (100-250KB): Rebuy, Bold Upsell. Rebuy specifically blocks the main thread for 172ms on average, which is roughly 10x what Google Analytics does.
- Analytics scripts (100-250KB): Triple Whale, Northbeam, Lifetimely. Each one adds another layer.
Run this audit on a Saturday morning when traffic is lower. Open your Shopify admin, list every installed app, and put each one in one of three buckets: core (delivers revenue or stops fraud), marginal (used occasionally), or zombie (installed during a free trial and never touched). Uninstall everything in the zombie bucket. For marginal apps, document what they do and decide if a developer could replicate that functionality natively in the theme.
Then run PageSpeed Insights again. You will usually see a 10 to 25 point jump from app removal alone. Stores with a starting score of 25 to 35 can realistically reach 50 to 70+ from script reduction alone, before you touch a single line of theme code. This is also where you should look at your CRO test roadmap and decide which apps are actually pulling weight against your tests.
Lever 3: The Hero Image Fix (Your Single Biggest LCP Win)
Your hero image is almost always your LCP element. Fix the hero image and you usually fix your LCP score in one move. Most Aussie Shopify stores ship a 2 to 4MB JPEG as the homepage hero. The browser has to download that file, decode it, and paint it before the page is considered “loaded”. On a 4G connection in the Sydney suburbs, that single file can cost you 1.5 seconds.
Here is the five-step hero image fix:
- Resize before upload. No mobile screen needs an image wider than 1600px. Most need 1080px. Resizing a 4000px hero to 1600px usually cuts file size 70%.
- Convert to WebP. WebP delivers 25 to 35% smaller file sizes than JPEG at the same visual quality. Use Squoosh or TinyPNG. Free, browser-based, takes 30 seconds per image.
- Never lazy-load the hero. Lazy loading delays the LCP element and tanks your score. The hero image must use
loading="eager"andfetchpriority="high". If your theme is on Online Store 2.0, this is a setting in the hero section schema. If not, get your developer to add it. - Kill the carousel. Hero carousels download 3 to 5 large images at once, which inflates LCP and confuses the shopper with multiple messages. A single strong hero with one clear CTA outperforms a 5-slide carousel almost every time.
- Use Shopify’s image_url filter. Add
width: 1600and let Shopify’s CDN serve the right size to each device. Never hardcode a single image size for all viewports.
Kadam Haat is a public case study of this exact playbook. They cut their image weight from 8.2MB to 1.4MB, dropped mobile LCP from 4.8 seconds to 2.1 seconds, lifted PageSpeed to 82, and the mobile conversion rate went up 33% and organic traffic up 18%. The work took two days. That is the kind of return per hour you almost never see in DTC.
One more callout. If you have a product video on your PDP, the same rules apply. Compress aggressively, set a poster image, and load the video on user interaction not on page load. A 15MB autoplaying video on mobile is a conversion killer dressed up as a brand asset.
Lever 4: The Third-Party Script Tax (Reviews, Chat, Pixels, Pop-ups)
Even after you trim your app stack, you will still have third-party scripts running. Klaviyo. Meta Pixel. TikTok Pixel. Google Tag Manager. Reviews. Chat. These all phone home to other servers, and each one adds to your INP score. The fix is not to remove them. The fix is to manage how they load.
Three rules for tag management:
- Defer everything that does not need to fire on load. Add the
deferorasyncattribute to non-critical scripts. Klaviyo’s tracking script should defer. Meta Pixel should defer. Google Analytics should defer. The only scripts that need to fire immediately are those that affect what the shopper sees above the fold. - Load review widgets on intersection. The “verified buyer” carousel halfway down your PDP does not need to load when the page loads. Use an Intersection Observer (or your review app’s lazy-load setting) so the widget loads as the shopper scrolls toward it.
- Hide chat widgets behind a button. Most chat apps let you replace the floating bubble with a button that loads the chat script on click. You keep the customer-service channel and remove 200 to 400KB of JavaScript from every page load. The trade-off is almost always worth it.
One more tactic that almost no Aussie founder uses: conditional pixel firing. You do not need the TikTok pixel firing on every blog post page or every customer-account page. Use Shopify’s customer-events API or Google Tag Manager rules to fire pixels only on the pages where they actually drive conversion data (PDP, cart, checkout, thank-you). This single change can cut JavaScript execution time by 20 to 30%.
Lever 5: Font and CSS Optimisation (The Quiet Wins)
Fonts and CSS are the unsexy levers nobody talks about, but together they often deliver another 200 to 500ms of LCP improvement. If your theme loads 3 custom fonts (regular, medium, bold) and each one is 100KB, you just added 300KB of render-blocking weight for the privilege of looking on-brand.
- Limit custom fonts to two weights maximum. One for headlines, one for body. Use system fonts for the rest. Modern system fonts on iOS and Android look professional and ship free.
- Preload critical fonts. Add
<link rel="preload" as="font" type="font/woff2" crossorigin>for the fonts that appear above the fold. This tells the browser to fetch them earlier in the render chain. - Use
font-display: swapin your CSS. This makes the browser show fallback text immediately while the custom font loads, preventing the dreaded “invisible text” period. - Strip unused CSS. Most Shopify themes ship with 200 to 500KB of CSS, and 60% of it is unused on any single page. PageSpeed Insights flags this as “Reduce unused CSS”. A developer can split the CSS into critical and non-critical chunks. Worth doing if you are above $40K a month and serious about Lighthouse.
- Minify and combine theme assets. Most newer themes do this by default. Older themes (Brooklyn, Debut, Venture) often do not. If you are on an older theme, this alone can shave 100 to 300ms.
While you are in the theme, audit your mega menu too. Mega menus with 50+ items and hover images can add 100 to 200ms to your INP score. A clean, fast menu is a CRO lever and a performance lever in one move.
Lever 6: The 30-Day Performance Monitoring Loop
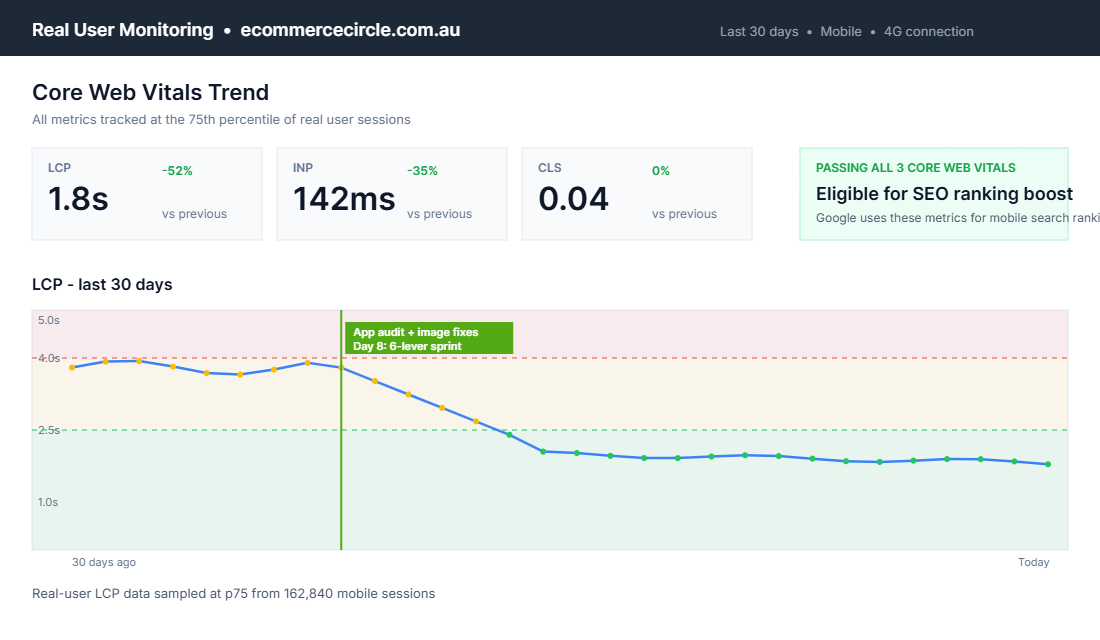
Most founders run one PageSpeed audit, make a few changes, see the score jump, then never check again. Six months later they have installed three more apps, a new chat widget, a TikTok pixel, and a fancy hero video, and the store is back to a 35. Speed is not a project. Speed is a discipline.
Set up this monitoring loop and put it in your calendar as a recurring weekly 15-minute slot:
- Weekly: Run PageSpeed Insights on your homepage, top-selling PDP, and top collection page. Track the mobile score, LCP, INP and CLS in a simple spreadsheet. If any metric moves into the red, investigate that week.
- Monthly: Check the Shopify Web Performance Report inside your admin (Analytics > Reports > Web performance). This pulls real-user data over 28 days and is the closest thing to what Google sees for SEO ranking.
- Monthly: Audit any new app installed in the past 30 days. If it added more than 10 points to your PageSpeed delta, decide whether the revenue justifies the weight.
- Quarterly: Use a real-user monitoring tool like DebugBear or web.dev measure to get a 90-day trend view. Free trials are usually enough for a one-off deep audit.
- Before every theme update: Run a full audit on the staging theme before pushing to production. A “small” theme change can wreck CLS in one deploy.
The Aussie founders who keep their PageSpeed above 70 long-term are not technical geniuses. They are operators who built monitoring into their weekly rhythm and treat a falling score the same way they treat a falling ROAS.
The Compound Effect: What Going From 4 Seconds to 1.5 Seconds Actually Looks Like
Run the math on your own numbers. Pull your last 30 days from Shopify analytics. Take your mobile sessions and your mobile conversion rate. Then model a 25% lift on the conversion rate, which is the conservative end of the range when you cut load time by half. That is what is sitting on the table.
Here is the example we walk through with members. Store doing $120K a month. Mobile is 75% of traffic and 60% of revenue, so $72K a month from mobile. Mobile sessions are 60,000. Mobile conversion is 1.6%. Average order value is $75. Now apply the 6 levers above and assume a 25% lift on conversion rate. Mobile conversion goes from 1.6% to 2.0%. Revenue from mobile goes from $72K to $90K. Annualised, that is $216K of extra revenue, with the same ad spend, the same email list, the same product range.
That is the compound effect. Speed is not one lever. Speed is the multiplier on every other lever you pull. Faster load times mean more sessions convert. Higher conversion rates mean lower CPA. Lower CPA means you can scale Meta and Google. Better Core Web Vitals mean Google ranks you higher in organic search, which brings more sessions, which compound again.
Your 6-Lever Page Speed Audit Checklist
Run this audit this week. Block 2 hours, open PageSpeed Insights, and work through every lever:
- Lever 1 (Diagnostic): PageSpeed Insights on homepage, top PDP, top collection. Record mobile score, LCP, INP, CLS. Note the top 5 diagnostic flags.
- Lever 2 (App stack): List every app. Bucket as core, marginal, or zombie. Uninstall zombies same day. Document marginals for review.
- Lever 3 (Hero image): Resize hero to 1600px max, convert to WebP, set
loading="eager"andfetchpriority="high", kill carousels. - Lever 4 (Third-party scripts): Defer non-critical scripts, lazy-load review widgets, hide chat behind a button, fire pixels conditionally.
- Lever 5 (Fonts and CSS): Limit to 2 font weights, preload critical fonts, font-display swap, audit unused CSS.
- Lever 6 (Monitoring): Weekly PageSpeed checks, monthly Web Performance Report, quarterly DebugBear, audit before every theme update.
Most stores will see a 15 to 30 point Lighthouse improvement and a 0.5 to 1.5 second LCP improvement from levers 1 through 4 alone, executed by one founder in a weekend with no developer. Levers 5 and 6 are where you bring in a Shopify developer for the deep work. The ROI on a $1,500 to $3,000 developer engagement on this is almost always a 5x return inside 90 days.
Inside eCommerce Circle, page speed is one of the core Platform pillars we work on with every member. If you want a second opinion on yours, let’s talk.