You finally hired the operations manager. You spent six weeks on the search, paid 18% above the SEEK midpoint, and made the offer with a fat sign-on bonus to get them across the line. Three months in, you are still in every Slack channel, still approving the supplier emails, still landing in their inbox at 11pm because the warehouse rang you instead of them. The team grew. Your time did not.
What’s in This Article
This is the most expensive moment in an Aussie DTC business. You have the headcount cost on the books, the customers expect a team, and the founder is still the bottleneck on every meaningful decision. The fix is rarely another hire. The fix is a performance management system that actually runs without you in the room.
Gallup’s 2026 State of the Global Workplace report just dropped a sobering stat. Manager engagement collapsed from 27% to 22% in a single year. And because managers account for 70% of the variance in team engagement, when the manager checks out, the team underperforms by a multiple. Inside best-practice organisations the same study found 79% manager engagement, almost four times the global average. That gap is not luck. It is a system. This is the 5-layer system we run with members inside the More Orders Operating System to lift team output 30 to 50% in 90 days.
Why the Annual Review Is the Most Expensive Lie in Aussie DTC
Most founders run reviews once a year. Some skip them entirely. The data on that approach is brutal. Employees who only get an annual review report a 14% motivation rate. Employees who get ongoing feedback report 77%. Employees getting daily or near-daily feedback are 3.6x more motivated than the annual-only group. Quarterly check-ins alone make people 90% more likely to be engaged and 2.1x more likely to rate the review as fair.
The cost of getting this wrong shows up in the P&L. ScaleSuite’s 2026 Australian SME benchmark puts the average cost to replace one employee at $45,000 when you do it cheap. The Australian HR Institute puts skilled roles at 1.5x annual salary, which is $120,000 to replace a $80,000 hire. Small Aussie businesses (2 to 19 staff) average 11% annual turnover, which means on a 7-person ecom team you lose someone every year by default. Lose two, and you have just spent $60,000 to $240,000 you did not budget for.
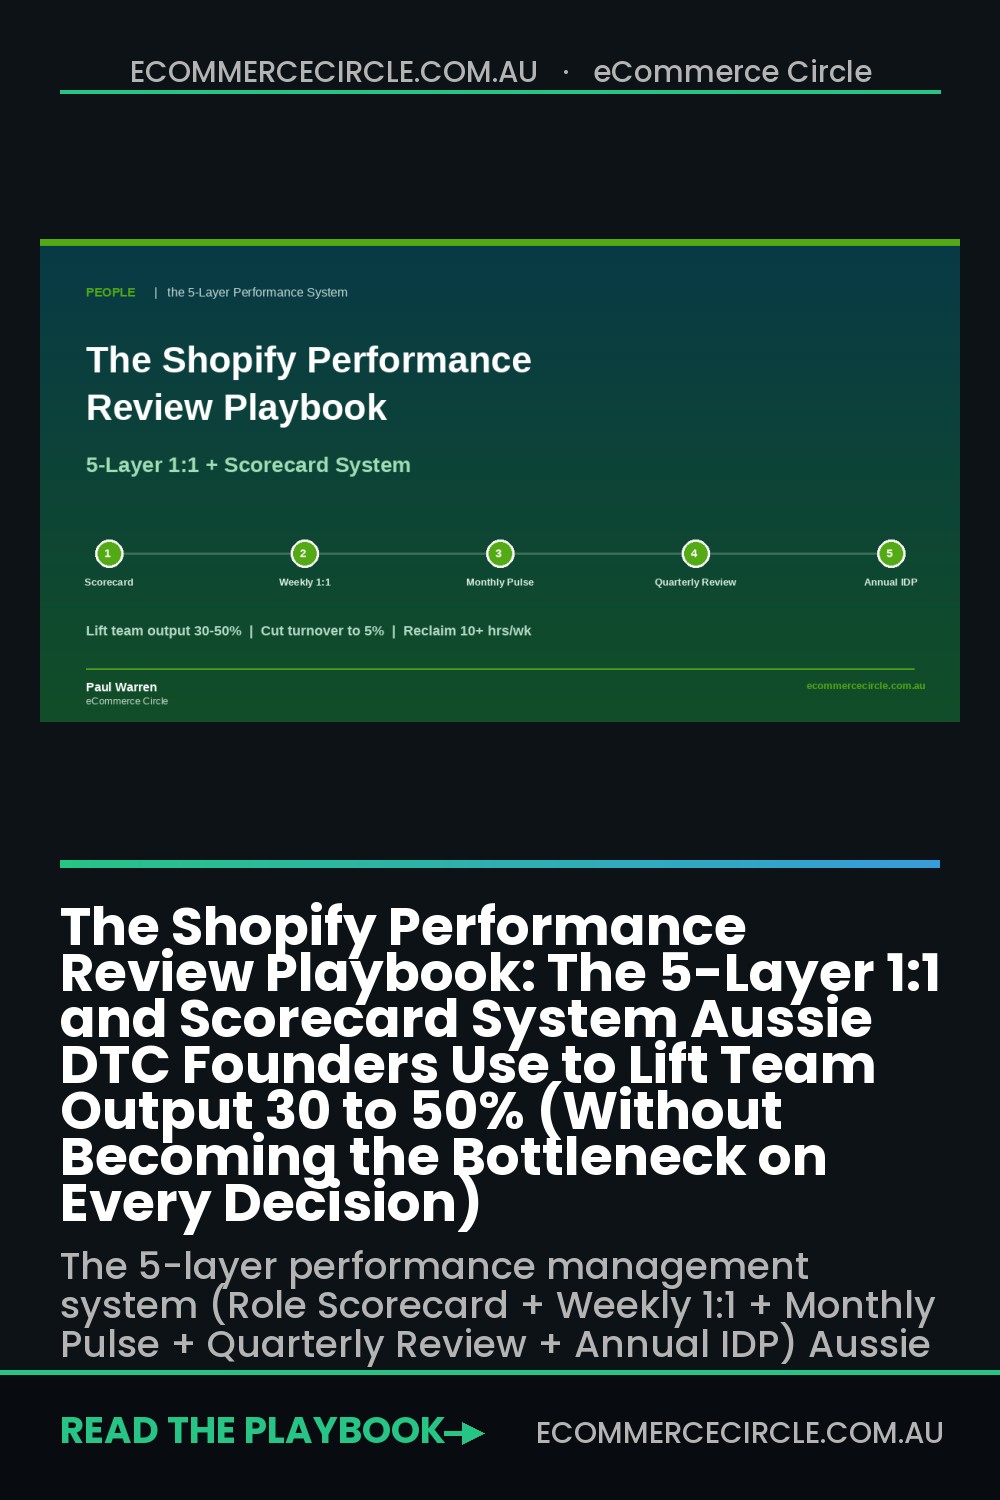
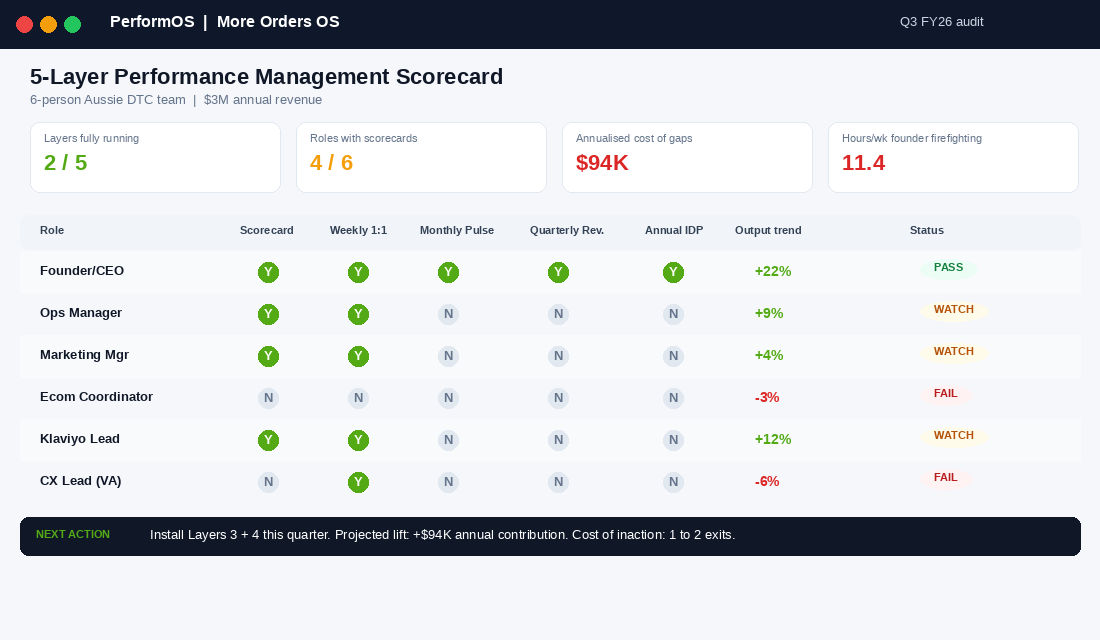
The 5-layer system fixes the cause. It gives every role a clear definition of what good looks like, weekly proof the work is moving, monthly early warnings before performance slides, a quarterly review tied to compensation, and an annual plan that keeps A-players from getting bored and looking. Each layer takes the manager 30 to 60 minutes per direct report per month combined. That is not a heavy lift. That is the cheapest insurance you will ever buy.
Layer 1: The Role Scorecard (Define A-Player Before You Manage Anyone)
You cannot manage performance you have not defined. Most ecom job descriptions read like spec sheets. “Manage email marketing program. Oversee Klaviyo. Report on performance.” That tells nobody what success actually looks like. The Topgrading methodology fixes this with a 1-page Role Scorecard, and Bradford Smart’s published data shows companies that implement it properly hit an 85% A-player success rate on hires. Even if you ignore the hiring side, the scorecard is the single highest-impact management artefact in your business.
Every Role Scorecard has three blocks. Mission is one sentence on why this role exists. “Run the Klaviyo email program so retention drives at least 35% of annual revenue with $30K+ in monthly attributed flow revenue at a healthy deliverability profile.” Outcomes are 4 to 6 measurable results the role owns, time-bound and numbered. Competencies are the 6 to 12 behaviours and skills that predict the person will hit those outcomes. Research by Schmidt and Hunter showed scoring against structured competencies lifts the predictive validity of an interview from 0.20 to 0.51. That is the difference between a coin flip and a real signal.
For a Shopify Ecom Coordinator on a $1M to $3M brand, the scorecard might read like this. Mission: Keep the storefront, app stack, and product launches running so the team ships 4 product drops a year and homepage conversion holds above 2.1%. Outcomes: (1) Ship every Tuesday content update without error, (2) Maintain Lighthouse mobile score above 65, (3) Coordinate 4 product launches per year on time, (4) Resolve 95% of P2 store bugs within 48 hours, (5) Drop monthly app stack spend by 5% year-on-year through quarterly audits. Competencies: Shopify admin fluency, Liquid basics, Klaviyo audience segmentation, project management (Asana or Notion), tight written communication, agency wrangling, vendor negotiation, weekly reporting hygiene.
- Build scorecards before you hire (and retro-fit them for existing team). If your operations manager joined 6 months ago without one, write it now and walk them through it.
- Keep outcomes to 4 to 6, not 12. More than 6 dilutes focus and the person ends up “busy” not “shipping”.
- Anchor every outcome in a number. “Improve email revenue” is not an outcome. “Lift Klaviyo flow revenue to $30K/mo by end of Q3” is.
- Sign it together. A scorecard the team member did not co-author is a document. A scorecard they signed is a contract. Different result.
If you have not yet hired the role you are scorecard-ing, our companion piece on the operations manager hire walks through how to use a scorecard inside a Topgrading interview to lift A-player hit rate.
Layer 2: The Weekly 1:1 (30 Minutes That Replaces 14 Slack Pings)
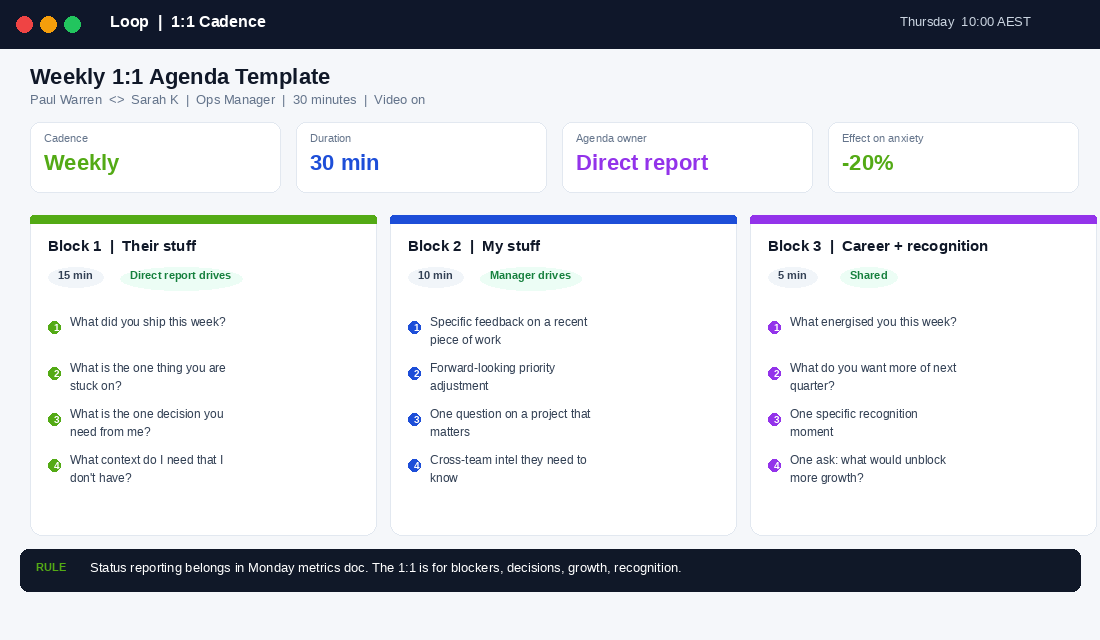
The weekly 1:1 is the most underrated meeting in your operating system. When LifeLabs Learning analysed the data on cadence, weekly 1:1s correlated with 20% lower team anxiety and 12% higher self-reported success vs less frequent meetings. The reason is mechanical. A direct report saves up the medium-priority questions for the 1:1 instead of pinging you 14 times across the week. Your inbox empties. Their work moves. Compounded across a 6-person team, that is 84 fewer interruptions a week and a founder who actually has 4 hours of deep work instead of 0.
Run them weekly at 30 minutes, same day, same time, video on. The agenda has 3 blocks and the team member fills it in 24 hours ahead. Block 1: Their stuff (15 min). The direct report drives. What did you ship this week? What is the one thing you are stuck on? What is the one decision you need from me? Block 2: My stuff (10 min). Manager-driven. Specific feedback on a recent piece of work, a forward-looking priority adjustment, one question on a project that matters. Block 3: Career and recognition (5 min). What is the one thing that energised you this week? What do you want more of in the next quarter? End with a single recognition moment, named and specific.
The fail mode is letting the 1:1 collapse into a status update. If you find yourself going “what is the current ROAS, what is the LTV, what did Klaviyo do this week”, you are running a status meeting. Status belongs in the Monday metrics dashboard, not in the 1:1. The 1:1 is for human stuff: blockers, decisions, friction, growth. Push status reporting into Slack or a shared doc updated by the team member before the meeting. The 1:1 itself must move the work, not summarise it.
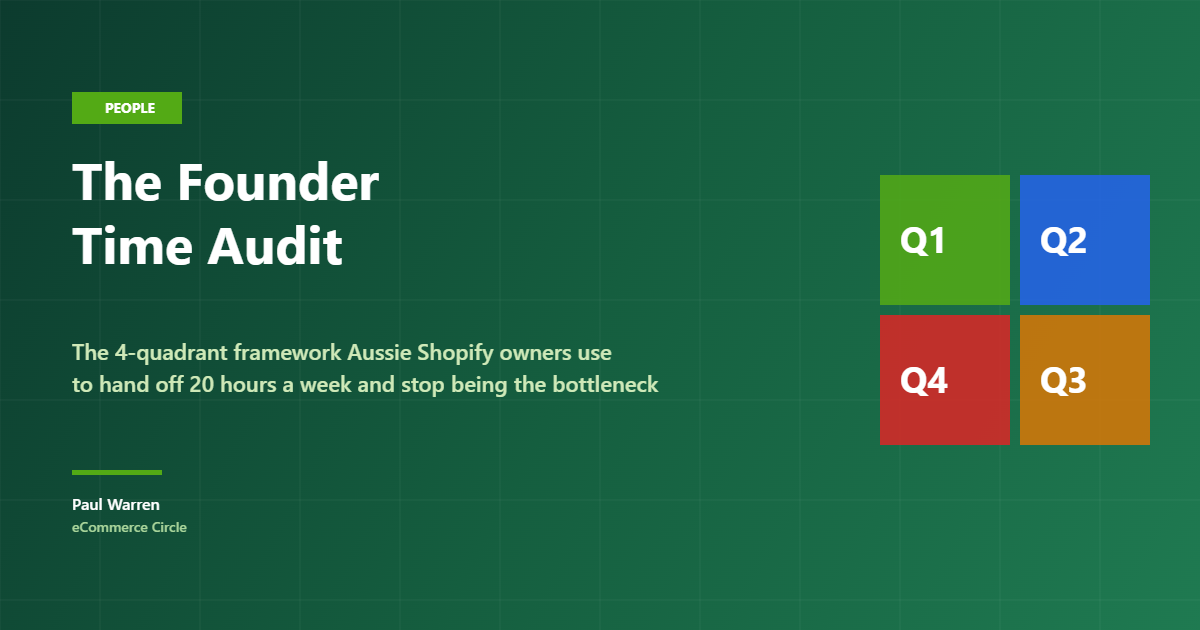
If you are still the one running every meeting and approving every decision, the constraint is not 1:1 quality. It is delegation discipline. Our Founder Time Audit playbook covers the 4-quadrant test for what to keep, defer, decide on, and hand off, so the 1:1 stops being a re-approval queue.
Layer 3: The Monthly Pulse Check (Catch the Slide Before It Becomes a PIP)
The single biggest failure pattern we see in Aussie DTC teams is the slow slide. The team member who was a star in month 3 is “fine” in month 6 and quietly underperforming by month 9. By the time you notice, the rest of the team has noticed too, you are 5 months behind on a difficult conversation, and a PIP feels like an ambush. The Monthly Pulse Check is the cheap insurance against this. It takes 20 minutes per direct report and replaces almost every “where did this come from” moment in performance management.
It has 4 questions you ask the same way every month. 1. KPI status: for each of the 4 to 6 scorecard outcomes, mark Green, Amber, or Red with a one-line note. 2. Energy check: “On a scale of 1 to 10, how energised do you feel about your work this month? What is one thing that would move it up a point?” 3. Blocker scan: “What is one process, tool, or person that is slowing you down that I could remove this month?” 4. Manager calibration: a 1-line manager note on their behaviour vs scorecard competencies. Are they showing the writing discipline you hired them for? The agency-wrangling skill? The cross-functional clarity?
The output of the Monthly Pulse is a 1-page snapshot that lives in a shared doc per direct report. When you read 3 months of pulse notes side by side, the early warnings jump out. Energy dropping from 8 to 5. Same blocker raised twice without resolution. A scorecard outcome amber for two months in a row. These are the signals that, addressed in month 3, are a coaching conversation. Ignored to month 9, they become a difficult exit. Confirm’s 2026 performance review research found 90% of HR professionals believe ongoing feedback produces more accurate reviews than annual. The Monthly Pulse is the cheapest version of “ongoing” you can run.
- Same 4 questions every month. Comparability matters more than novelty. The pattern is in the trend, not in any single answer.
- Energy is a leading indicator. Output is a lagging indicator. By the time output drops, energy has been falling for 60 days.
- Write your manager calibration first. If you wait until the team member shares, you anchor on their self-view. Form your view, then compare.
- Three Amber outcomes in a month = trigger a structured coaching plan. Not a PIP. A coaching plan. Difference matters legally and culturally.
Layer 4: The Quarterly Performance Review (The 60-Minute Conversation That Replaces the Annual)
The quarterly performance review is the formal moment where the scorecard, the 12 weekly 1:1s, and the 3 monthly pulses get synthesised into a rating, a conversation, and a comp signal. If you are running this layer well, the review contains zero surprises for either side. The grade is a summary of evidence already in writing.
The structure is a 60-minute conversation off a 2-page doc. Page 1 (the team member fills out 5 days ahead): self-rated outcomes against the scorecard (Exceeded / Met / Below for each), 3 wins they are proud of with evidence, 1 thing they would do differently, 2 development goals for next quarter. Page 2 (manager fills out 3 days ahead): manager rating against the same outcomes, 3 reinforcement points, 1 development push, an overall rating on the 5-point scale (Far Exceeds / Exceeds / Meets / Below / Far Below), and a compensation note.
The 5-point scale matters. A 3-point scale (Below / Meets / Exceeds) puts 80% of the team in “Meets” and gives you no signal. A 5-point scale forces the manager to differentiate. Healthy distribution on a high-functioning Aussie DTC team looks like 10% Far Exceeds, 25% Exceeds, 50% Meets, 12% Below, 3% Far Below. If you have a 6-person team and 4 of them are “Exceeds”, you are not giving accurate signal. The “Exceeds” rating loses meaning, and the 2 actual top performers stop feeling recognised.
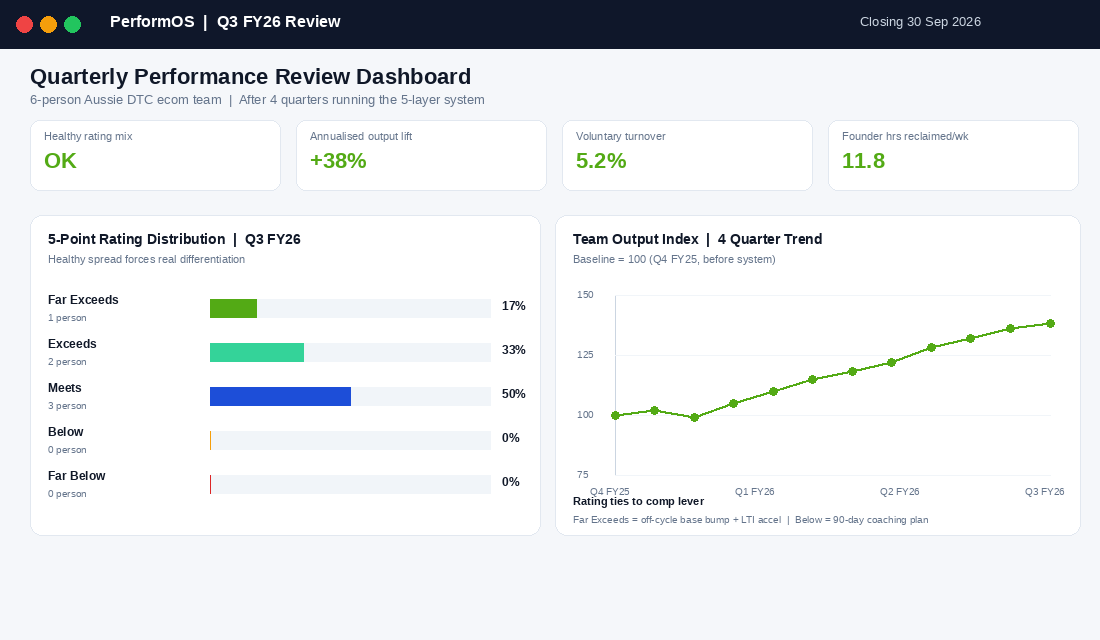
Rating ties to compensation lever. “Far Exceeds” triggers consideration for a base increase outside the annual cycle, an LTI tranche acceleration, or a public spot bonus of $2K to $5K. “Exceeds” triggers full bonus payout and a development investment. “Meets” triggers full base, target bonus. “Below” triggers a structured coaching plan with a 90-day reassessment. “Far Below” triggers a formal PIP. Connecting the rating to a concrete action is what makes the conversation real instead of theatre. For the full pay architecture (base bands, variable tier, LTI design, super treatment), see our Compensation Playbook.
Run the review at the end of each financial quarter (end-March, end-June, end-September, end-December for the Aussie calendar). Block 60 minutes per direct report, video on, distraction off. Leave silence in the conversation. The most useful reviews we have ever sat in had 30-second pauses where the team member processed what they were hearing.
Layer 5: The Annual Development Plan (The Retention Layer Most Founders Skip)
A-players leave for one reason. They stopped growing. They will tell you it was money, but the post-exit interviews from PerformYard’s 2026 data set show “no path forward” cited 2.4x more often than pay as the actual driver. The Annual Development Plan is the layer that converts a job into a career inside your business, and it is the cheapest, highest-return retention tool you have.
Use the 70-20-10 framework. 70% of growth comes from on-the-job stretch assignments. 20% comes from coaching and mentoring relationships. 10% comes from formal training. Most founders default to “we’ll send you on a course” (the 10%) and ignore the 90% that actually drives growth. A real plan looks like this for a year, written down on one page.
- 70% (stretch assignments): own the Q3 product launch end-to-end, lead the migration off legacy Klaviyo flows, present quarterly results to the leadership team for the first time, run a Meta budget at 1.5x current size for 60 days.
- 20% (relationships): assigned mentor (internal or external paid coach), monthly coffee with a peer at another Aussie DTC brand, quarterly 1:1 with a founder advisor on a specific skill gap, attend Retail Global Australia roundtable as a delegate not an observer.
- 10% (formal): one specific course budget (CXL conversion optimisation, Foxwell Founders, a Shopify Plus certification, a CFA module if Finance), a $1,500 to $3,000 annual learning budget locked in writing.
- Promotion criteria, in writing. “To be considered for promotion to Senior Ecom Manager, you need to consistently hit Exceeds across 3 quarters, ship two cross-functional projects, and demonstrate 2 of these 4 senior competencies.” Without this, promotions feel political and the team member starts shopping.
The plan gets revisited at the Q2 review and rewritten at the Q4 review. It is the one document the team member should be able to point to and say “this is why I am still here in 18 months.” Bondi Sands appointed a Chief People Officer specifically to systematise this layer across their 80-person global team. Showpo founder Jane Lu is famous for keeping social media strategy in-house while delegating execution. Both are versions of the same principle. A-players need clarity on what they own, what they grow into, and how they get there. That is your Annual Plan.
The Compound Effect: What Happens When All 5 Layers Run
Take a $3M Aussie DTC brand with 6 FTEs at $80K average salary. Total payroll cost (including 12% super, on-costs, and training): roughly $720K per year. If you run no system, you average 11% turnover (the small business benchmark), losing roughly one person per year at a replacement cost of $40K to $80K. You spend 14 hours a week firefighting people issues because nothing is defined.
Now run all 5 layers. Turnover drops to 4 to 6% (the published best-practice band). Output per FTE lifts 30 to 50% over 4 quarters because each person knows what they own, gets weekly clarity, and grows in role. On a $3M brand, that lift converts to an additional $200K to $400K in run-rate revenue from the same team, plus $40K to $80K in avoided replacement cost, plus 10 to 15 hours a week of founder time returned. The combined value sits between $250K and $500K of incremental contribution annually, on a system that takes the founder roughly 6 hours a week to run across 6 direct reports.
That is the cheapest, highest-impact operating system in your business. It also makes every other lever in the More Orders OS work better. The Quiz Funnel ships. The PDP framework gets implemented. The Klaviyo flows get audited. The supplier negotiation actually happens. Without the 5 layers, those projects sit in a Notion board with no owner and no due date.
The 30-Day Rollout (How to Install This Without Triggering a Revolt)
You cannot drop a 5-layer system on a team mid-quarter and expect adoption. Here is the rollout we run with members.
- Week 1: Build the scorecards. Write a 1-page Role Scorecard for every existing role, draft the mission, outcomes, competencies. Do not share yet.
- Week 2: Co-author and sign. 60-minute conversation with each team member. Walk through the scorecard, edit live, get verbal agreement, both sign. Frame it as “I owe you clarity on what good looks like. Here is my draft. What is missing?”
- Week 3: Launch the weekly 1:1. Same day, same time, video on. Send the 3-block template. Run the first one and explicitly do not let it become status reporting.
- Week 4: Run the first Monthly Pulse. 20-min conversation. KPI status, energy check, blocker scan, manager calibration. Save the snapshot.
- Day 90: First Quarterly Review. Use the 2-page doc, the 5-point rating scale, tie to comp signal.
- Day 365: First Annual Development Plan. Run the 70-20-10 conversation, write the promotion criteria.
The tool stack is light. Under 10 people, you do not need software. A shared Google Doc per direct report (Scorecard + 1:1 notes + Pulse + Quarterly) and a recurring calendar invite handles the whole system. From 10 to 50 people, 15Five at $4 to $16 USD per employee per month does the lift. Above 50, Lattice at $8 USD per employee per month for the performance module is the standard. The Aussie option is Employment Hero, which bundles HRIS, payroll, and performance reviews from around $8 AUD per employee per month. Pick once, install, do not switch.
Three Failure Modes That Kill This System
- 1. The 1:1 collapses into a status meeting. If you find yourself asking “what is the current ROAS, what shipped this week, what is the Klaviyo open rate”, you are running a status update, not a 1:1. Push status into a shared doc updated before the meeting. The 1:1 itself is for blockers, decisions, growth, recognition. Different muscle.
- 2. The Quarterly Review surprises someone. If your “Below” rating in Q1 is the first time the team member has heard the feedback, the system failed in Layer 2 and Layer 3. The Quarterly Review should contain zero new information. It is a synthesis of evidence already discussed. Surprises destroy trust faster than the underlying performance issue ever would.
- 3. The Annual Plan is “we’ll send you on a course”. Defaulting to the 10% formal training and ignoring the 70% stretch assignments and 20% relationships is the laziest version of this layer and the one most founders accidentally run. If you cannot name the 3 stretch assignments and the mentor relationship for each A-player, the plan is not written.
The Recovery Protocol: What To Do When A Layer Slips
Every founder who installs this system will drop a layer at some point. Peak season hits, a supplier falls over, someone resigns, and the weekly 1:1 quietly becomes fortnightly. The system does not fail because you missed a cycle. It fails because you never restart it, and after about six weeks of silence your team stops expecting it back.
Treat a slip like a stockout: name it, fix it, and put a trigger in place so it does not repeat. Say it out loud in the next team meeting. “We have missed three weeks of 1:1s. That is on me. They restart Tuesday.” Ten seconds of ownership buys back more credibility than four weeks of quietly hoping nobody noticed.
Then restart at the smallest viable layer rather than trying to catch up on all five. Weekly 1:1s come back first, because they are the layer that carries the most information per minute. Monthly Pulse comes back second. Do not attempt to backfill a missed Quarterly Review, because a review of a quarter you did not manage is theatre and your team knows it. Skip it, note the gap in the scorecard, and run the next one on schedule.
Build the trigger into your calendar rather than your memory. Recurring invites that never get deleted, a shared agenda doc per person that both of you can see, and a rule that a 1:1 can be moved but never cancelled. Founders who make that one rule stick report holding 90%+ of scheduled 1:1s across a year. Founders relying on intention hold somewhere near 55%, and the gap shows up directly in how much lands on their own desk.
Running This With Offshore And Part-Time Team Members
Most Australian DTC teams under $10M are a blend: two or three local full-timers, a Filipino VA or two, a freelance designer, and an agency. The five layers still apply, but three things need adjusting or the system quietly becomes a local-staff-only ritual.
Write the scorecard tighter. Remote and part-time people cannot read the room, so ambiguity costs far more. A local marketing coordinator can infer that “improve email performance” means revenue per recipient. A VA three time zones away will optimise open rate for six months. Every outcome on a remote scorecard needs a number, a source of truth, and a review cadence.
Shorten the loop, not the conversation. A 30-minute weekly 1:1 with someone in Manila is worth more than a 60-minute fortnightly, because the feedback lands while the work is still live. Keep the same agenda structure and record the call if the time zone is genuinely painful, but do not swap the conversation for a Loom. Async updates are a status report, not a 1:1.
Make the Monthly Pulse written first. Send the three questions 24 hours ahead and ask for written answers, then talk through them live. Non-native English speakers and quieter team members give you dramatically better signal in writing, and you get a record you can compare month to month. Our VA playbook covers the onboarding side of this, and the first hire playbook covers what to put in a scorecard before someone starts.
One thing not to adjust: pay and progression conversations still happen live, on camera, with you. Delegating those to a written summary is the fastest way to lose a good remote operator to someone who was willing to have the conversation.
The Honest Take
The 5-layer system is not glamorous. It is not a new ad channel, not a Klaviyo flow, not a quiz funnel. It is the operating layer underneath everything else you do. When it runs, every other initiative ships on time. When it does not, your business is held together by your personal capacity, your nervous system, and your Saturday mornings.
The founders we see scale past $5M, $10M, $20M did not do it by being better at Meta or better at Klaviyo. They did it by building a team that ships without them in every meeting. That team is built one Role Scorecard, one weekly 1:1, one Monthly Pulse, one Quarterly Review, and one Annual Plan at a time. There is no shortcut and there is no software that replaces the conversation. There is just the system, run on time, every cycle.
Inside eCommerce Circle, performance management is one of the core pillars we work on with every member. If you want a second opinion on yours, let’s talk.