You’re about ten weeks out from Black Friday. Most Australian stores will spend those ten weeks on offers, creative and stock — and almost none of them will spend an hour on the question that decides whether any of it lands: who is actually going to be buying?
What’s in This Article
Because it isn’t the same person. The customer who buys from you in March is buying for themselves. They know your brand, they’ve browsed three or four times, and they’re weighing whether the product is right for them. The customer who buys from you on 3 December has never heard of you, found you through a gift guide or a paid ad, and is buying for their sister. They don’t care about your ingredient story. They care whether it arrives before Christmas and whether it looks like a real present when it does.
Running the March playbook through November is the single most common reason peak-season revenue comes in under plan. The traffic arrives, the conversion rate drops, and everyone blames the ads. It usually isn’t the ads. It’s that the site is still speaking to a buyer who stopped visiting in October. This is how to map the shift before it happens — and what to change once you can see it.
The Mix Inversion Nobody Measures
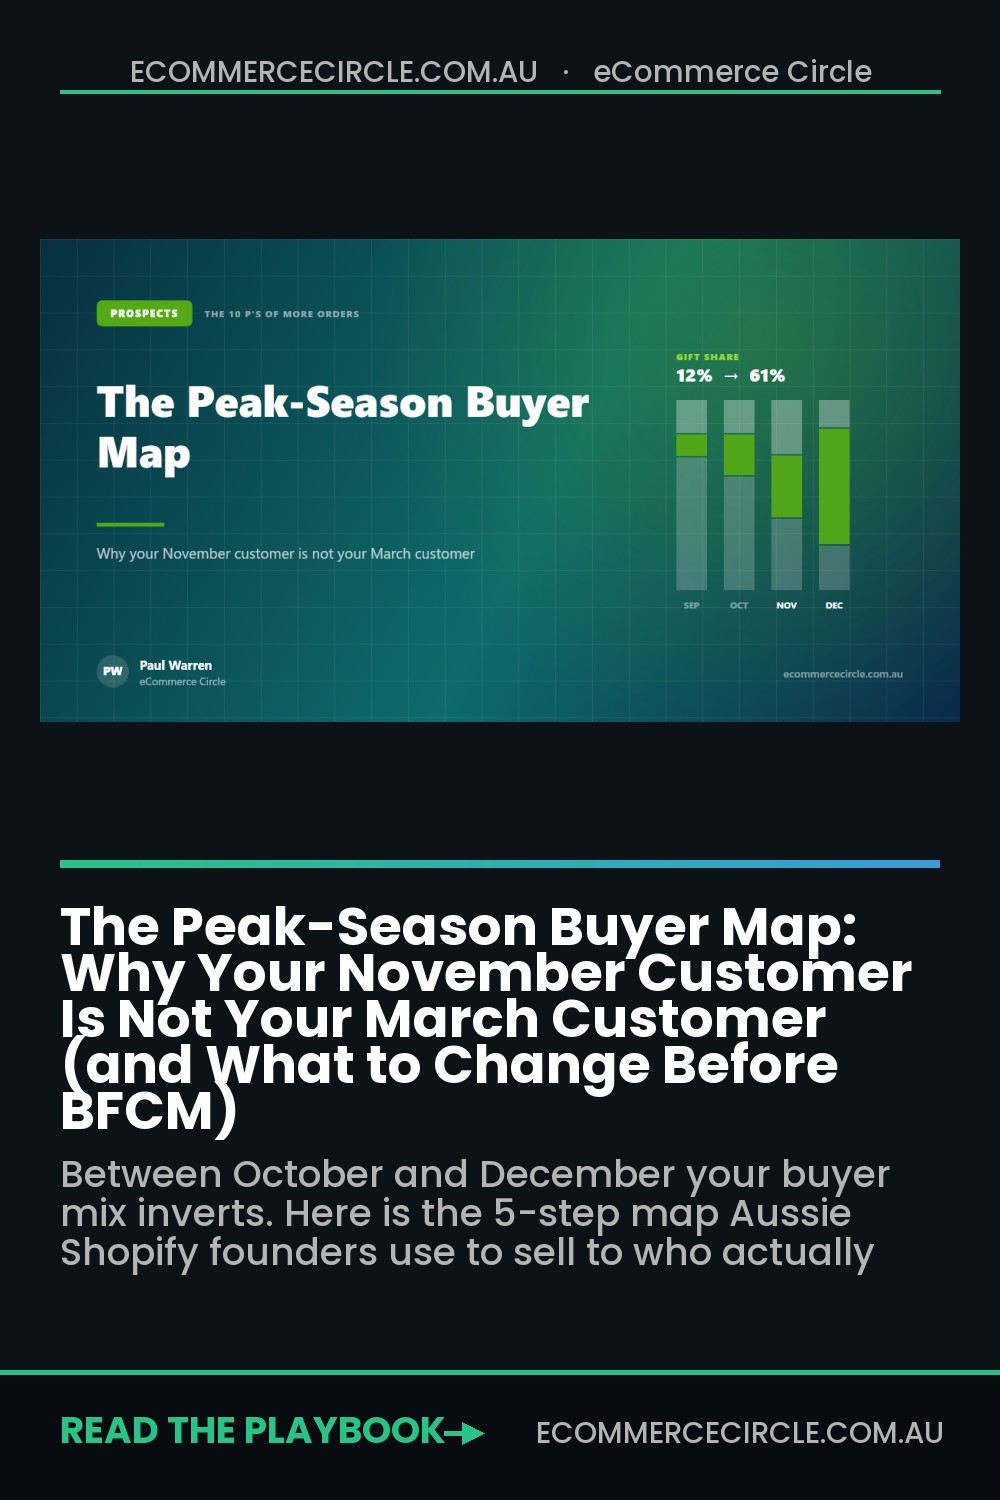
Almost every store tracks how much it sells each month. Very few track who is doing the buying. When you break orders into three buyer types — people buying for themselves, people buying a gift, and people led there by a discount — something dramatic shows up between October and December.
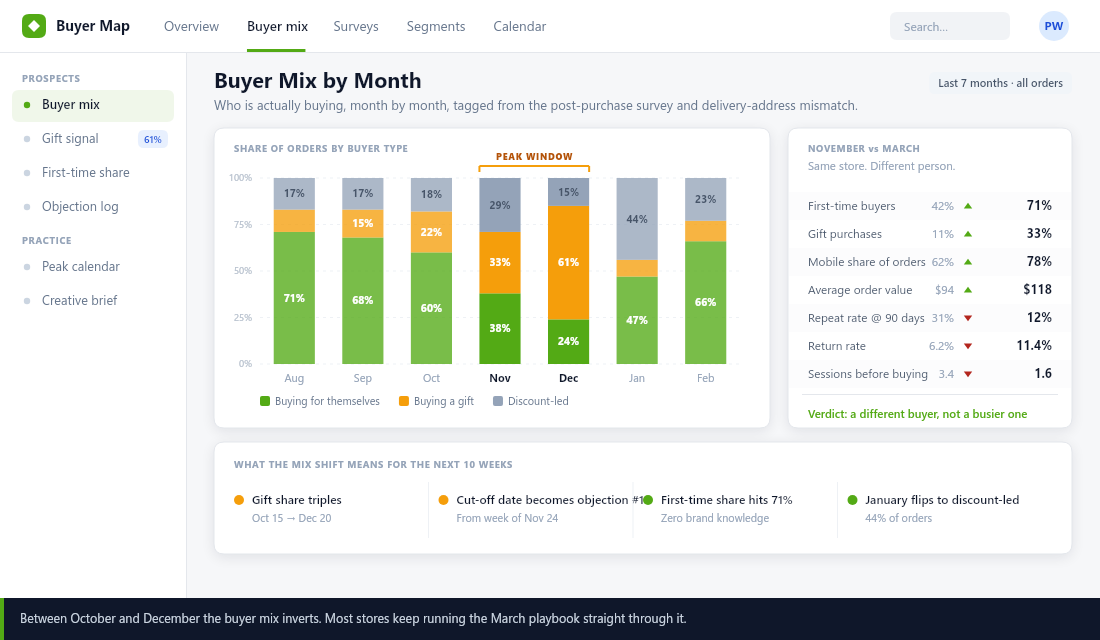
In a typical Australian DTC store, self-purchase runs at about 70% of orders through winter. By December it’s down near 24%, with gifting taking 61%. Then January flips again — gifting collapses to single digits and discount-led buying jumps to over 40% as the sale shoppers arrive.
That inversion drags a set of other numbers with it. First-time buyers go from roughly 42% of orders to over 70%. Mobile share climbs. Average order value lifts, because people spend more on other people than they do on themselves. And two numbers move the wrong way: repeat rate at 90 days falls by more than half, and return rates run close to double.
Read that list properly and it tells you something uncomfortable. Peak season isn’t your best customers buying more. It’s a completely different, lower-loyalty, higher-return cohort arriving all at once. Which is fine — as long as you plan for them rather than for the people who were there in March.
Step 1: Ask the One Question That Tags the Buyer
You can’t map a buyer you haven’t identified. The good news is you need exactly one question, asked on the Shopify thank-you page, where you’ll get response rates of 30-50% because the customer is still in the moment and has nothing left to do.
The question: “Is this purchase for you, or for someone else?” Three options — for myself, a gift for someone else, both or not sure. That’s it. Don’t add a second question yet; every extra field cuts your response rate and this one field carries most of the value.
Set it up with a post-purchase survey app, or on Shopify Plus with a checkout extension on the thank-you page. Push the answer back to the customer record as a tag — gift-buyer or self-buyer — so it’s usable in Klaviyo segments later. That tag is the asset. The chart is just how you read it.
If you want a free proxy while you wait for responses to accumulate, use address mismatch: orders where the billing name and shipping name differ are gifts at a very high rate. It’s not as clean as asking, but you can run it retrospectively over last December’s orders tonight and have a directional answer before you finish your coffee.
Step 2: Build the Two-Column Buyer Map
Once you can separate the cohorts, put them side by side on one page. Nine attributes, two columns, no commentary. This document is the brief for everything you make between now and Christmas.
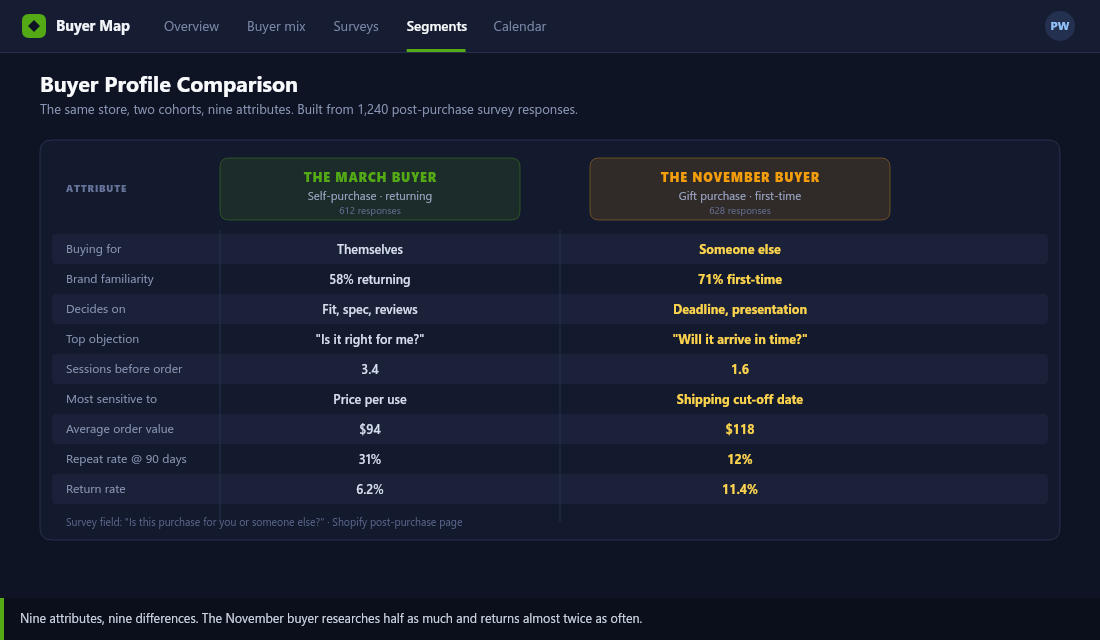
Pull the numbers from where they already live:
- Brand familiarity — Shopify’s customer reports, first-time versus returning by month.
- Sessions before order — GA4 or your analytics tool, comparing a December cohort against a March one.
- Top objection — the free-text field on your post-purchase survey and your support inbox. This is the highest-value row on the map.
- AOV, repeat rate and return rate — Shopify analytics, filtered by order month.
The row that changes the most decisions is sessions before order. A March buyer takes three or four visits. A November gift buyer takes one or two. You have roughly half the exposure to persuade them, which means every piece of information they need has to be on the page they land on. Not in a tab, not in the FAQ, not three clicks into your shipping policy.
Step 3: The Objections Change From Persuasive to Operational
This is the insight that earns the whole exercise. In March, the objections holding people back are about the product: is it right for me, is it worth the money, will it suit my skin/space/schedule. Those are persuasion problems, and you solve them with reviews, comparison content and better copy.
In November and December, the objections stop being about the product almost entirely:
- “Will it get here in time?” The number one peak-season objection, every year, in every category. Australia Post publishes its Christmas cut-off dates from around late October — the day they land, put them on your site.
- “What if I get the wrong size or colour for them?” A gift buyer is guessing on someone else’s behalf. Extended returns through January and a clearly stated exchange process removes this one completely.
- “Will it look like a present?” Nobody wants to hand over a poly mailer. Gift wrapping, a card message option, and one photo of the packaging as it actually arrives.
- “Can I send it straight to them?” Direct-to-recipient shipping, with the price hidden from the packing slip. Say so on the product page, not at checkout.
Every one of those is an operations answer delivered as a merchandising decision. You don’t write your way out of them — you build the capability and then say clearly that you have it. A shipping cut-off banner, a gift-message field and an extended returns line will do more for December conversion than any amount of new ad creative.
Step 4: Re-Merchandise for the Person Who Doesn’t Know You
Your homepage and collection pages were built for someone with context. Seventy-one percent of your December traffic won’t have any. That means the navigation logic that works all year — by product type, by ingredient, by range — quietly stops working, because a gift buyer doesn’t shop by category. They shop by recipient and by price.
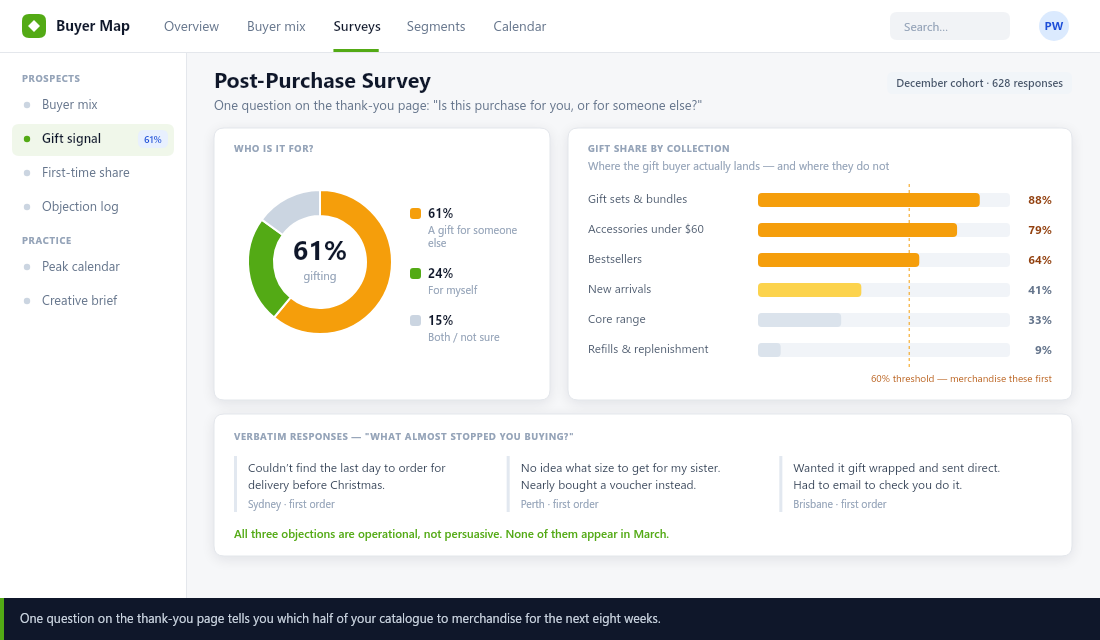
Run gift share by collection and you’ll usually find a clean split. Bundles, accessories under $60 and bestsellers carry most of the gift demand. Refills, replenishment items and your core range barely register — nobody gifts a two-litre refill pouch. Three changes follow from that:
- Build recipient-led collections. “Gifts under $50”, “For the one who has everything”, “Gifts for him”. Ugly to a brand purist, and they convert, because they match how the buyer is actually searching.
- Front the high gift-share collections. Whatever is above about 60% gift share moves to the top of the nav and onto the homepage from mid-October. Your replenishment range moves down — it isn’t gone, it’s just not the December hero.
- Put the operational answers above the fold. Cut-off date, gift wrapping availability, extended returns. One line each, on the product page, where a one-session buyer will actually see them.
Then reverse all of it in the second week of January. The recipient-led collections come down, the core range goes back up, and your merchandising speaks to a self-buyer again.
Step 5: Plan the January Handover Now
Here’s what most stores get wrong after a good December: they treat the December list as customers. They’re not, yet. A gift buyer bought a product they will never use, for a person who isn’t on your list. Repeat rate at 90 days tells the story — around 12%, against 31% for a self-purchase cohort.
So build two January flows off the tag you captured in step one. The gift buyer flow doesn’t try to sell them the same product again. It asks how the gift landed, offers a small thank-you for a first self-purchase, and — the valuable bit — invites them to pass on a discount to the recipient. That’s how you convert one gift buyer into two list members.
The self-buyer flow is your normal replenishment and cross-sell sequence, timed to the product’s usage cycle. Same store, same month, two completely different conversations — which is only possible because you tagged them at checkout twelve weeks earlier.
How the Map Compounds
Individually these look like five small jobs. Together they change the economics of your peak season.
The survey tag costs you one question and gives you segmentation you’ll use for years. The buyer map turns your creative brief from guesswork into a document. The objection rewrite lifts December conversion because you’re answering what people are actually hesitating over. The re-merchandising raises AOV because gift buyers land on bundles instead of refills. And the January handover rescues the retention number that normally craters after a gifting peak.
None of it requires new traffic, a new channel or more budget. It’s the same store, the same stock and the same spend — aimed at the person who is genuinely going to be standing in front of it.
Precision about who you’re selling to is what makes every dollar of demand generation work harder. Get the buyer right and the offer, the creative and the merchandising mostly decide themselves.
Inside eCommerce Circle, knowing your buyer with this level of precision is one of the core engines we work on with every member — and the Prospects section of the Scorecard checks exactly this. If you want to see where your store is being capped before peak, take the free More Orders Scorecard. It takes two minutes and shows you which of the 10 P’s to fix first.