Most Shopify store owners make changes to their store based on gut feeling, blog posts they read, or what their competitor is doing. They redesign a product page on a Tuesday, and when sales go up on Wednesday, they credit the redesign. When sales drop on Thursday, they blame the algorithm. That is not optimisation — that is guessing.
What’s in This Article
A/B testing replaces guessing with data. Instead of redesigning your entire product page and hoping for the best, you test one change at a time and let the numbers tell you what works. The brands that test consistently are the ones that steadily improve their conversion rates quarter after quarter while everyone else stagnates.
The good news is that A/B testing does not require a data science degree, expensive tools, or massive traffic volumes. Here is a practical framework any Shopify store owner can follow.
Start With the Highest-Impact Tests (Not the Easiest)
Not everything is worth testing. Changing the colour of a button from blue to green is unlikely to transform your business. But changing your product page hero image, your headline, or your pricing display can move the needle significantly.
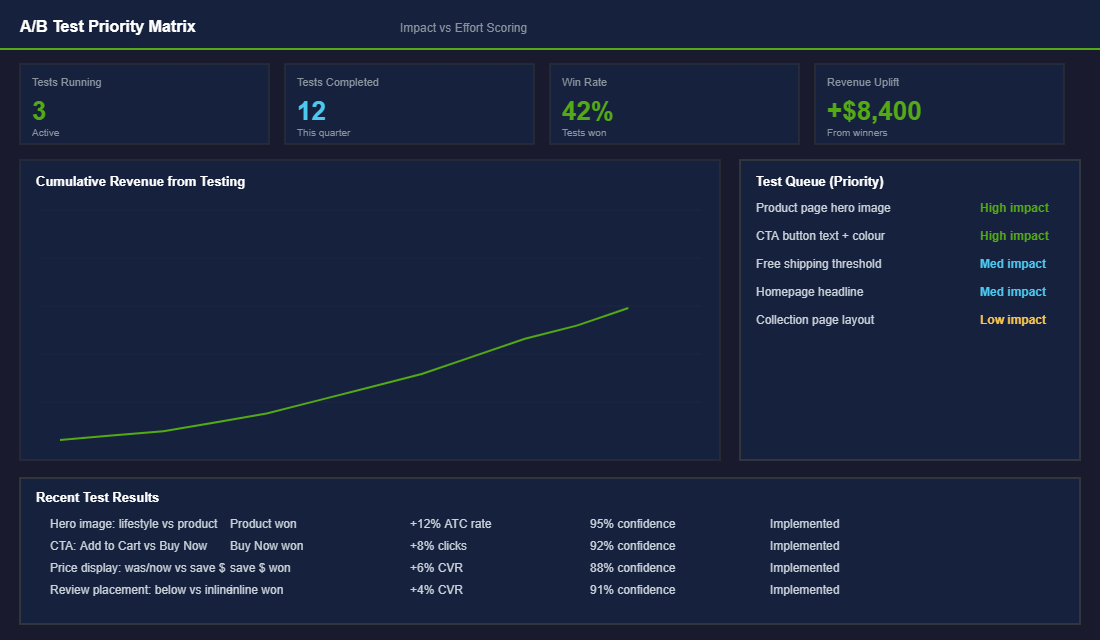
Prioritise tests based on impact x effort. Here are the highest-impact tests for most Shopify stores, in order:
- Product page hero image. Lifestyle shot vs product-on-white vs UGC image. This is what customers see first, so it has the biggest influence on engagement. Typical uplift: 8-15% change in add-to-cart rate.
- CTA button text. “Add to Cart” vs “Buy Now” vs “Get Yours” vs “Add to Bag.” Simple change, but it signals intent differently. “Buy Now” often outperforms “Add to Cart” by 5-10% because it creates momentum.
- Price presentation. “Was $89 Now $69” vs “Save $20” vs “$69 (30% off).” How you frame the price affects perceived value. Test which format drives higher conversion for your specific audience.
- Social proof placement. Reviews above the fold vs below the description vs inline with the description. Moving reviews higher almost always improves conversion because it addresses trust earlier in the decision process.
- Free shipping threshold. $79 vs $89 vs $99. Different thresholds affect both conversion rate and AOV. The optimal point maximises total revenue, not just one metric.
How to Run a Test (The Simple Version)
You do not need Google Optimize (which Google killed anyway) or expensive enterprise tools. For most Shopify stores, these options work perfectly:
- Shopify’s built-in A/B testing (if you are on Shopify Plus) lets you test checkout modifications natively.
- Google Optimize alternatives like Intelligems (great for price testing on Shopify), Shoplift (purpose-built for Shopify theme testing), or VWO (visual editor, works with any theme).
- Sequential testing (the free option): run version A for two weeks, then version B for two weeks, and compare the results. Less scientific than simultaneous testing, but better than not testing at all. Just make sure you compare the same days of the week (Monday-Sunday vs Monday-Sunday) to account for weekly patterns.
The rules of a good test:
- Change one thing at a time. If you change the image AND the headline AND the CTA simultaneously, you will not know which change caused the result.
- Run for at least 14 days. Shorter tests miss weekly patterns (weekday vs weekend shopping behaviour is very different).
- Get at least 500 visitors per variant. Below this, your results are not statistically reliable. For stores with lower traffic, sequential testing over longer periods works better.
- Define your success metric before starting. Are you measuring add-to-cart rate? Conversion rate? Revenue per visitor? Decide before the test, not after.
Build a Testing Calendar (Consistency Beats Intensity)
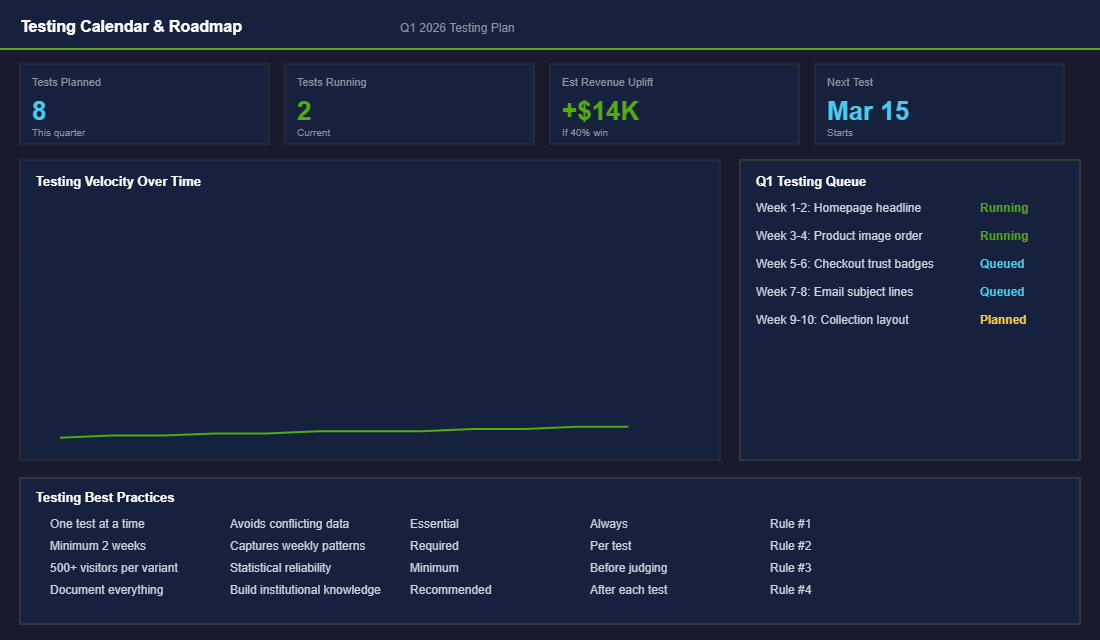
The brands that get the most from testing are not the ones that run one big test per year. They are the ones that run one test every 2-3 weeks, consistently. Over a quarter, that is 4-6 tests. If 40% of those produce wins (which is a realistic win rate), you are making 2-3 meaningful improvements every quarter.
Create a simple testing calendar:
- Weeks 1-2: Run Test A (e.g., product page hero image)
- Week 3: Analyse results, implement winner, plan next test
- Weeks 4-5: Run Test B (e.g., CTA button text)
- Week 6: Analyse, implement, plan
Document every test: what you tested, what you expected, what happened, and what you learned. This creates institutional knowledge that compounds over time. After six months, you will have a clear picture of what your specific audience responds to — and that is worth more than any amount of generic “best practices” advice.
The Compound Effect: Testing Creates Permanent Improvements
Unlike ads (where you pay for every click forever), CRO improvements are permanent. A test that proves a new product image converts 12% better means that 12% improvement applies to every single visitor from now on — for free. Stack five winning tests in a quarter and you could be looking at a 20-30% cumulative improvement in conversion rate. On a store doing $40K/month, that is an extra $8-12K/month in revenue without spending an additional dollar on traffic.
Ready to Start Testing?
Inside the eCommerce Circle, structured testing is part of the Performance pillar in our More Orders Operating System. We help members identify what to test, set up their experiments, and interpret the results so they are making data-driven decisions instead of guessing. If you want to start testing but are not sure where to begin, reach out and we will help you build your testing roadmap.
The A/B Testing Tools That Work on Shopify (and What They Cost)
You do not need an enterprise testing platform to start. You need a tool that integrates cleanly with Shopify and does not slow your site down. Here is the realistic stack for Aussie merchants in 2026.
Intelligems ($99-$499/mo) — purpose-built for Shopify. Tests prices, shipping thresholds, free-shipping bars, and on-page elements without a developer. Best fit for stores doing $50K+/month who want to test pricing without the legal-grey-area of code injection.
Shoplift ($199-$499/mo) — Shopify-native testing for theme sections, hero banners, and PDP layout. Quick to set up, server-side rendering so no flicker, and built-in statistical significance calculators.
Convert (from $99/mo) — solid mid-market option with strong segment targeting. Better for sites with complex audiences or that want to test across multiple URLs.
VWO (from $266/mo) — full experimentation platform with heatmaps, session recordings, and feature flagging. Overkill for under-$1M stores. Worth it when you have a dedicated CRO function.
Klaviyo A/B Tests (free if you have Klaviyo) — the most underrated tool on the list. Test subject lines, send times, hero images, and CTAs across your flows. Most stores already pay for Klaviyo and never use this feature.
If your monthly traffic is below 20,000 sessions or your conversion rate is under 1%, traditional A/B testing will rarely reach significance. In that case, test inside email first (where you can hit significance on 5,000 opens) and use behavioural analytics tools like Hotjar or Microsoft Clarity (free) to find qualitative wins on-site. For deeper attribution help once you scale, see our GA4 setup guide.
How to Actually Hit Statistical Significance (the Real Numbers)
This is where most founders get stuck. They run a test for 5 days, see one variant winning by 8%, and call it. Then the trend reverses in week three and they wonder why their “winners” never seem to stick.
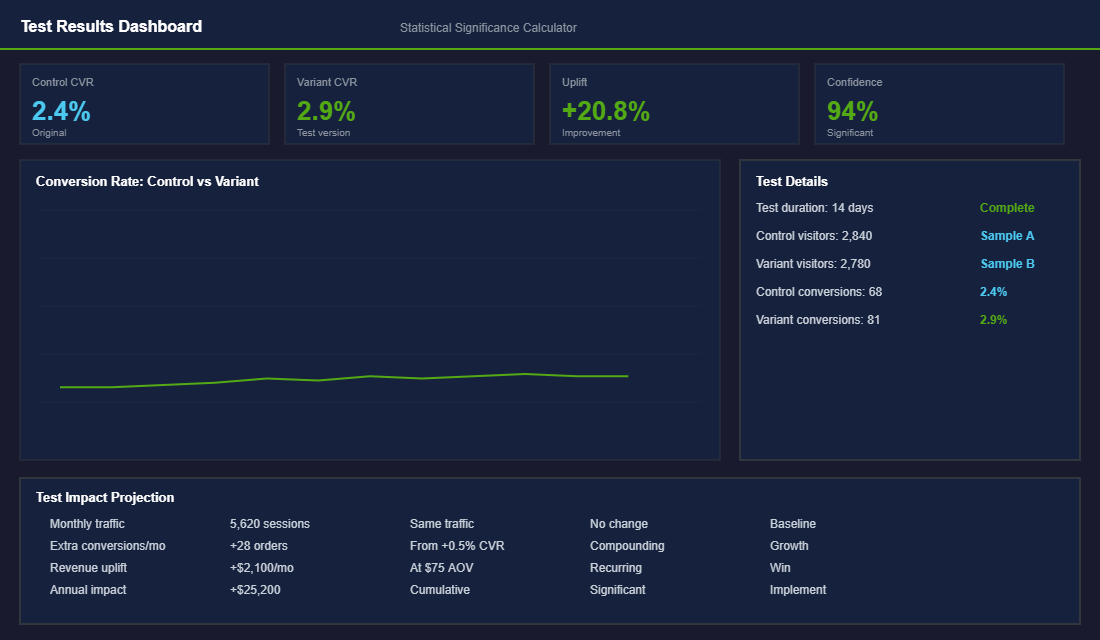
The basic rule: you need at least 100 conversions per variant and a minimum two-week run (to cover both weekday and weekend behaviour) before you make any call. For a store with a 2% conversion rate, that means each variant needs 5,000 sessions — so a clean test needs roughly 10,000 sessions across both. If you are doing 30,000 sessions a month, that is about 10 days of clean data per test. If you are doing 5,000 sessions a month, it is 60+ days, which means you cannot test much on-site at all.
Aim for 95% confidence as your standard. Some tools default to 90% — that means a 1-in-10 false positive rate, which is fine for low-risk creative tests (button colours, hero copy) but dangerous for pricing or shipping tests. For anything that touches revenue per visitor, push to 99% confidence and let the test run.
The Tests That Move the Needle (and the Ones That Almost Never Do)
After running tests across dozens of Aussie Shopify stores, a clear pattern emerges. Some test categories are reliably profitable. Others are theatre.
High-impact tests (typically 5-20% lift): hero section value proposition, PDP above-the-fold layout, free-shipping threshold, cart drawer vs cart page, urgency/scarcity messaging, post-purchase upsells, email capture trigger (timing and offer). These touch revenue per visitor directly.
Medium-impact tests (typically 2-5% lift): product photography style, review display format, badge placement (trust seals, “made in Australia”, “ships from Melbourne”), navigation hierarchy, search bar placement. Worth testing, but only after you have exhausted the high-impact list.
Low-impact tests (rarely reach significance): button colour, font choice, copy tweaks under 5 words, footer changes, blog layout. These dominate testing roadmaps in agencies that need to look busy. They almost never move revenue meaningfully. Stop running them.
The cleanest discipline: build a backlog of test ideas, score each with the PIE framework (Potential, Importance, Ease), and only run tests that score in the top quartile. For a deeper view, see our CRO test backlog framework.
A Real Aussie Example: How a Test Win Compounded Over 12 Months
An Australian skincare brand doing $180K/month came to us with a flat conversion rate of 1.6%. Their team had been running “tests” — really, redesigns shipped on hunches. We rebuilt their test discipline from scratch. Twelve months later they had run 24 valid tests, kept the 9 winners, and their store-wide conversion rate sat at 2.4%. That is a 50% lift in conversion, which translated to roughly $66K/month in additional revenue at the same traffic level.
The winners that compounded: a clearer free-shipping threshold (lifted AOV from $84 to $97), a streamlined PDP “above the fold” with one CTA instead of three (lifted PDP-to-cart by 14%), a simpler cart drawer that surfaced shipping cost before checkout (cut cart abandonment by 6 points), and a smarter email capture offer (10% off for repeat buyers, free shipping for first-time visitors — separate audiences, separate offers).
The point is not that any one of those tests was clever. The point is that running them with discipline — one variable, two weeks, 95% confidence, kept only the winners — compounded into a step change in revenue. A/B testing is boring in the way that compound interest is boring. It works because you keep doing it.
What to Do This Week
Three concrete actions if you are starting from zero. First, install Microsoft Clarity (free) so you have at least some qualitative data on where customers struggle. Second, list the top 5 traffic-driving pages on your store and pick the one with the worst exit rate — that is your first test target. Third, write down what you think will win and why, before you build the variant. The discipline of forced predictions is what turns testing from theatre into a learning system. And if you want help building the right test roadmap, our coaches design these every week — have a chat with us.