You’re spending $5K a month on Meta Ads, $3K on Google Shopping, $1K on TikTok, and another $2K on influencer partnerships. Revenue is climbing. But here’s the question that keeps most ecommerce founders up at night: which of those channels is actually responsible for the growth?
What’s in This Article
If you’re relying on each platform’s own reporting to answer that question, you’re almost certainly making decisions based on fiction. Meta says it drove 400 sales. Google claims 350. TikTok takes credit for 200. But your Shopify dashboard only shows 500 total orders. The numbers don’t add up because every platform wants to claim the credit — and most Shopify stores are making budget decisions based on data that’s missing 30–40% of what actually happened.
The brands scaling profitably past $50K, $100K, and $500K per month aren’t guessing. They’ve built an attribution system that shows them — with confidence — where every dollar of revenue is really coming from. And that system isn’t as complicated as you think.
Why Platform Reporting Is Lying to You (And Costing You Thousands)
Here’s something most Shopify store owners learn the hard way: conversion data between Google Ads, Meta Ads, and Shopify never matches. It’s not a bug — it’s by design. Each platform uses different attribution logic and different measurement windows.
Meta defaults to a 7-day click, 1-day view window. That means if someone sees your Instagram ad on Monday, doesn’t click, then Googles your brand name on Thursday and buys — Meta takes the credit. Google, meanwhile, also claims that sale because the customer clicked a search ad. And your Shopify dashboard? It only sees one order.
According to recent industry data, over 90% of shoppers interact with multiple marketing channels before making a purchase. A typical customer might engage with your brand 6 to 20 times across different touchpoints before they finally convert. When you’re only looking at last-click attribution — which 22% of organisations still rely on exclusively — you’re giving all the credit to the final touchpoint and completely ignoring the channels that built awareness and trust along the way.
The result? You cut the top-of-funnel activity that was quietly filling your pipeline. Revenue drops three weeks later. And you have no idea why.
The Three Layers of Ecommerce Attribution (And Why You Need All of Them)
Smart attribution isn’t about finding one perfect tool. It’s about building a layered system where each component fills a gap the others miss. Think of it as a three-layer framework:
Layer 1: Platform-Level Tracking (Your Baseline). This is what you already have — GA4, Meta Pixel, Google Ads conversion tracking. It’s free and it’s essential, but it’s also the most biased. Each platform marks its own homework. Use it as a starting point, not a source of truth.
Layer 2: Server-Side Tracking (Your Accuracy Upgrade). This is where most brands see the biggest leap in data quality. Instead of relying on browser-based JavaScript pixels — which get blocked by ad blockers, iOS privacy changes, and cookie restrictions — server-side tracking sends conversion data directly from your Shopify server to ad platforms. It bypasses the browser entirely. Brands that implement server-side tracking typically recover 30–40% of conversion data that browser pixels were missing.
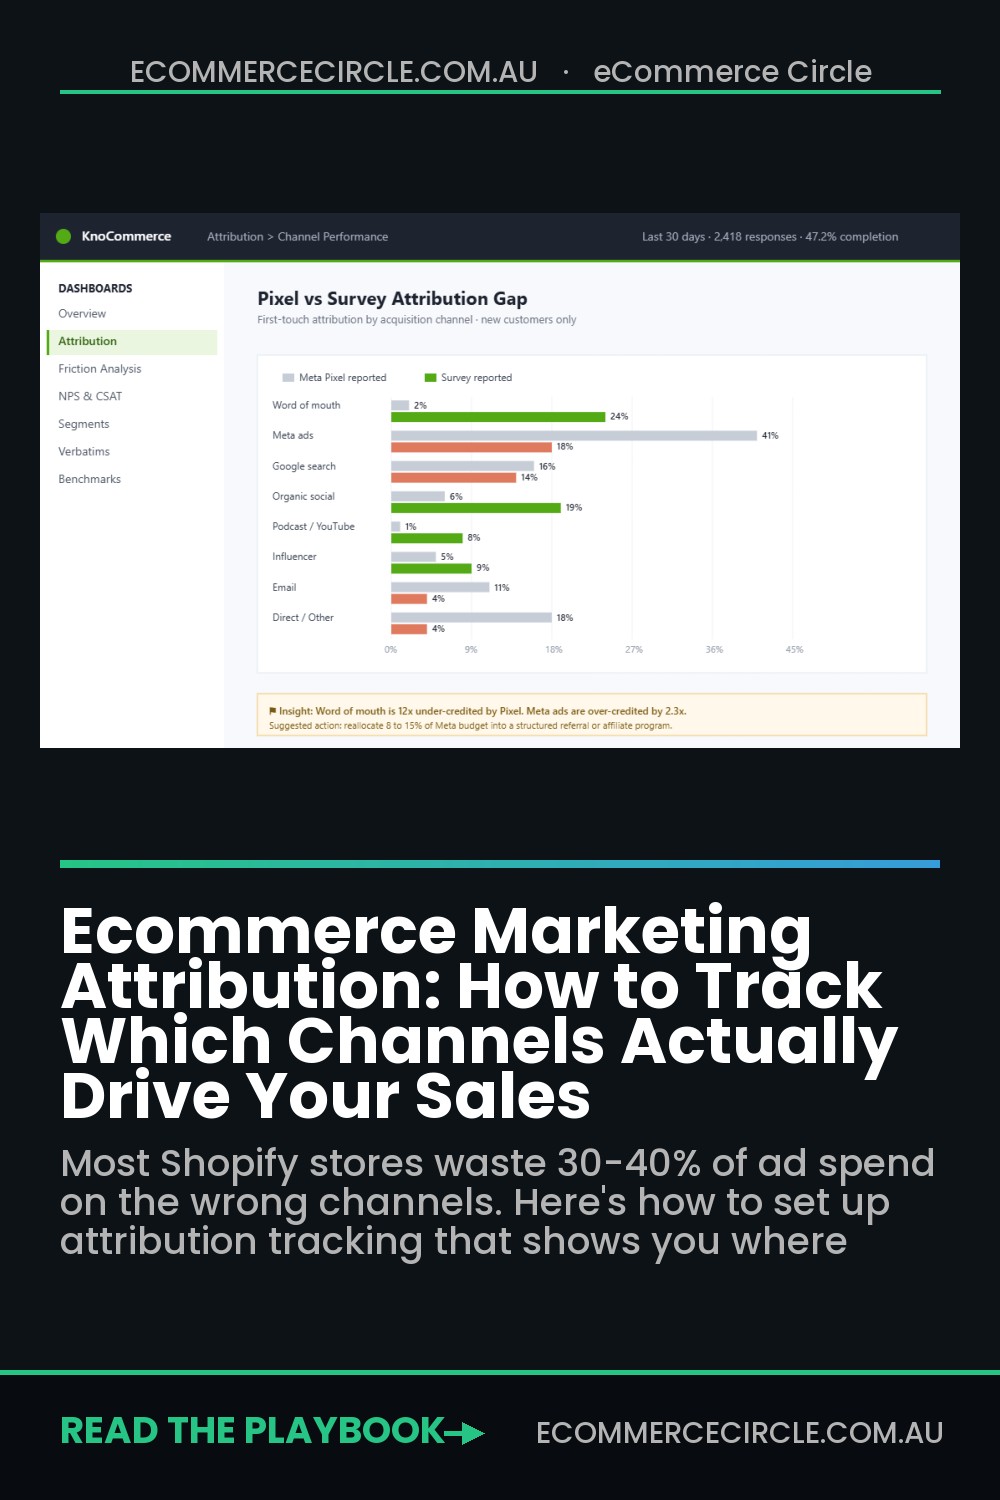
Layer 3: Self-Reported Attribution (Your Reality Check). This is the simplest layer and the one most brands skip. A post-purchase survey asking “How did you first hear about us?” captures the touchpoints that no pixel can track — word of mouth, podcast mentions, a friend’s Instagram story, TikTok videos that didn’t get clicked but still built awareness. Surveys should be delivered within 24–48 hours of purchase when recall is strongest.
When you combine all three layers, you stop making decisions based on any single data source and start seeing the full picture.
Setting Up GA4 Data-Driven Attribution (Your Free Starting Point)
If you’re on Shopify, you already have access to one of the most powerful free attribution tools available: Google Analytics 4’s Data-Driven Attribution model. And most store owners aren’t using it properly.
GA4’s Data-Driven Attribution (DDA) uses machine learning to distribute credit across every touchpoint in a customer’s journey. It evaluates up to 50 interactions over the 90 days before a conversion, analysing both converting and non-converting paths to determine which touchpoints actually influenced the purchase.
Here’s how to set it up properly on Shopify:
- Install the Google & YouTube Shopify app. This is the fastest path. It automatically connects your GA4 property and starts tracking ecommerce events — page views, add-to-carts, begin-checkout, and purchases — without custom code.
- Enable Enhanced Ecommerce events. Go to GA4 Admin → Data Streams → your web stream → Enhanced Measurement. Make sure site search, outbound clicks, and scroll tracking are all switched on.
- Set up conversions. In GA4, navigate to Admin → Conversions and mark your key events: purchase, begin_checkout, and add_to_cart. This tells the DDA model which outcomes to optimise attribution around.
- Check Attribution Settings. Go to Admin → Attribution Settings. Select “Data-driven” as your reporting attribution model. Set your lookback window to 90 days for acquisition events and 30 days for all other events.
- Use the Attribution paths report. In GA4, go to Advertising → Attribution → Conversion paths. This is where the magic lives. You can see the actual multi-touch journeys your customers take — which channels assist, which convert, and where the real value sits.
One important caveat: GA4’s DDA model needs data volume to work accurately. Google recommends at least 600–1,000 conversions per month across all your conversion events and at least 28 days of historical data. If your store does fewer than 20 orders per day, the model may not have enough signal. In that case, supplement GA4 with the other layers in this framework.
Server-Side Tracking: The Upgrade That Recovers Your Missing Data
Browser-based tracking is broken. Between iOS privacy restrictions, ad blockers (which now affect roughly 30% of web traffic), and the ongoing phaseout of third-party cookies, pixel-based tracking misses a significant chunk of your conversions. If you’re making ad spend decisions based on pixel data alone, you’re operating with a blindfold on.
Server-side tracking fixes this by sending conversion data directly from your Shopify server to your ad platforms. Instead of the browser firing a pixel (which might get blocked), your server communicates directly with Meta’s Conversions API, Google’s Enhanced Conversions, and TikTok’s Events API.
The impact is real. One documented case from an Australian DTC brand showed a 33% reduction in customer acquisition cost after implementing server-side tracking while spending six figures per month on Meta. Another brand reduced CAC by 20% and improved their marketing efficiency ratio by 24% within just 60 days.
Why such a dramatic improvement? Because when Meta receives more accurate conversion data, its algorithm gets smarter. It can better identify who’s actually buying (not just clicking), and it optimises delivery toward those people. Better data in = better targeting out.
How to implement server-side tracking on Shopify:
- Option 1: Shopify’s built-in Customer Events API. Shopify now handles server-side event tracking natively through its Customer Events system. When you install the Meta, Google, or TikTok sales channels, Shopify sends server-side events automatically. This is the easiest path and covers most use cases.
- Option 2: Google Tag Manager Server-Side. For more control, set up a GTM server-side container. This gives you a central hub that processes events from your Shopify store and routes them to all your ad platforms and analytics tools. It requires more technical setup but gives you complete control over what data goes where.
- Option 3: Dedicated tracking apps. Tools like Elevar, Littledata, and TrackBee specialise in server-side tracking for Shopify. They handle the technical complexity and typically cost $150–$500/month depending on your order volume. For stores spending $10K+ on ads, the ROI is usually obvious within the first month.
UTM Parameters: The Foundation Most Brands Get Wrong
UTM tracking is attribution 101, yet most Shopify stores either don’t use UTMs consistently or make basic mistakes that corrupt their data. And corrupted UTM data is worse than no UTM data — because you’ll make confident decisions based on wrong information.
Three UTM parameters are mandatory for reliable attribution: utm_source (where the click came from — e.g., “facebook”, “google”, “klaviyo”), utm_medium (the channel type — e.g., “paid-social”, “cpc”, “email”), and utm_campaign (the specific campaign name — e.g., “spring-sale-2026” or “welcome-series”).
Here are the UTM mistakes that destroy attribution data:
- Inconsistent capitalisation. UTM parameters are case-sensitive. “utm_source=Facebook” and “utm_source=facebook” show up as two completely different sources in Google Analytics. Pick lowercase for everything and enforce it across your team.
- Using UTMs on internal links. Never add UTM parameters to links within your own website. When a customer clicks an internal link with UTMs, GA4 starts a new session and credits the “source” as your own site — wiping out the original attribution. This is one of the most common and damaging mistakes.
- No naming convention document. If three people on your team are building campaigns, you’ll end up with “meta-retargeting”, “Meta_Retargeting”, and “fb-retargeting” all meaning the same thing. Create a shared UTM naming convention spreadsheet and make it law.
- Forgetting email links. Every link in every Klaviyo or Omnisend email should have UTMs. Without them, your email revenue shows up as “direct” traffic in GA4 — making email look like it’s underperforming when it’s actually your best channel.
Pro tip: Build a UTM generator spreadsheet in Google Sheets. List your approved sources, mediums, and campaign naming patterns. Share it with anyone who touches your marketing. This one step eliminates 80% of UTM-related attribution errors.
Post-Purchase Surveys: The Attribution Layer That Catches What Pixels Miss
There’s a whole category of attribution that no tracking pixel, no server-side event, and no analytics platform can capture: dark social. That’s the word-of-mouth recommendation from a friend. The podcast mention someone heard on their commute. The TikTok video they scrolled past three times before finally visiting your store through Google.
Post-purchase surveys fill this gap. A simple “How did you first hear about us?” question on your order confirmation page captures the attribution data that technology can’t.
Here’s how to set up a post-purchase survey that actually produces useful data:
- Keep it to one question. Don’t ask five things. The single most valuable question is: “How did you first hear about us?” Give 6–8 options (Instagram, TikTok, Google search, Friend/family, Podcast, Blog/article, Other) plus a free-text field.
- Show it immediately after purchase. The thank-you page has the highest response rate — typically 30–50% of customers will answer. If you wait 48 hours and send it via email, response drops to 10–15%.
- Tools to use. Shopify apps like Fairing (formerly EnquireLabs) and KnoCommerce specialise in post-purchase attribution surveys. Fairing integrates directly with your Shopify checkout and can feed survey data into Klaviyo, Triple Whale, and your ad platforms. Pricing starts around $100/month for most stores.
- Track the data monthly. Build a simple spreadsheet that tracks survey responses over time. You’ll start seeing patterns: “40% of our customers first heard about us on TikTok, but only 15% of our ad spend goes there.” That’s an attribution insight no pixel could give you.
Third-Party Attribution Tools: When to Invest (And Which to Choose)
Once you’re spending $10K+ per month on advertising across multiple channels, the free tools start showing their limits. GA4 is powerful but it lives inside Google’s ecosystem and naturally favours Google touchpoints. Each ad platform’s reporting favours itself. That’s when a dedicated third-party attribution tool earns its keep.
Here are the three leading options for Shopify brands, and who each one suits:
Triple Whale is built specifically for Shopify and is the go-to for brands doing $10K–$500K/month in revenue. It connects directly to your Shopify store, Meta, Google, TikTok, Klaviyo, and other platforms, then provides a unified dashboard showing attributed revenue across every channel. Its “Total Impact” model uses a combination of pixel tracking, server-side data, and machine learning to attribute revenue. Pricing starts around $100/month for smaller stores and scales with ad spend. Best for brands that want a Shopify-native solution that’s quick to set up and easy to read.
Northbeam combines multi-touch attribution with media mix modelling, making it the pick for brands spending $50K+ per month on ads. It aggregates data from Meta, Google, TikTok, and more into a single dashboard, and its machine learning models can show how a TikTok view leads to a Google search that leads to a purchase weeks later. Northbeam is more analytically sophisticated than Triple Whale but also more complex. Best for brands with a dedicated growth marketer or agency who can interpret the data.
Elevar sits in a slightly different lane — it’s primarily a data quality and server-side tracking platform rather than a full attribution solution. It ensures your conversion data is accurate before it reaches GA4, Meta, and Google Ads. Think of Elevar as the foundation layer that makes every other attribution tool work better. If your data is messy, Elevar should be your first investment. Pricing starts around $150/month.
The data backs up the investment: marketers using dedicated attribution platforms are 2.3x more likely to increase their return on ad spend year-over-year. And companies that switch from single-touch to multi-touch attribution see an average 22% increase in budget efficiency. That’s not a small edge — it compounds every month.
Building Your Attribution Dashboard: The Weekly Review That Drives Smarter Spending
Having attribution data is useless if you don’t act on it. The brands that get the most from their attribution setup review it in a structured way — weekly, not just when something feels off.
Here’s the attribution review framework we recommend inside eCommerce Circle. If you’re already running a weekly metrics dashboard, add these attribution-specific checks:
- Channel-level ROAS comparison. Pull ROAS from GA4 (data-driven attribution), your ad platforms, and your third-party tool (if you have one). Look at where they agree and where they diverge. Big discrepancies tell you where data quality needs work.
- Assisted vs. last-click revenue. In GA4’s conversion paths report, compare how much revenue each channel gets under last-click versus data-driven. Channels that show much higher value in data-driven are your hidden workhorses — usually top-of-funnel channels like social and content marketing.
- Post-purchase survey trends. What percentage of customers cite each discovery channel? Is TikTok growing as a first-touch channel? Is word-of-mouth increasing (a sign your product and post-purchase experience are strong)?
- Blended MER (Marketing Efficiency Ratio). Total revenue divided by total marketing spend. This one number cuts through all the attribution noise. If your blended MER is healthy and improving, your marketing mix is working — even if you can’t attribute every last dollar perfectly. For most Shopify stores, a healthy MER sits between 3:1 and 5:1. Read more in our monthly analytics deep dive guide.
Run this review every Monday morning. It takes 20 minutes once you’ve set up the dashboard, and it prevents the slow budget drift that kills profitability over time.
The Compound Effect: How Good Attribution Transforms Your Entire Business
Here’s what happens when you get attribution right across all three layers:
Your Meta campaigns get fed more accurate conversion data through server-side tracking, so Meta’s algorithm targets better prospects. Your customer acquisition cost drops. You spot that Google Search is mostly capturing existing demand (branded searches), not creating new demand — so you shift budget to TikTok and influencer partnerships that your post-purchase surveys show are driving first-touch awareness. Your Meta ad campaign structure improves because you finally know which creative is driving new customers versus retargeting existing ones.
Your UTM hygiene means GA4 gives you clean data, so your weekly reviews produce actionable insights instead of confusion. Your blended MER improves month over month because you’re allocating budget based on what actually drives sales, not what each platform’s biased reporting tells you.
And the best part? Each improvement compounds. Better data leads to better decisions. Better decisions lead to more efficient spend. More efficient spend means higher profit margins and faster growth — without spending more.
That’s the difference between brands that plateau at $30K/month and brands that push through to $100K and beyond. It’s rarely about spending more on ads. It’s about knowing where your money actually works.
The Attribution Benchmarks That Tell You If Your Setup Is Working
Once your tracking layers are live, you need to know what normal looks like. Otherwise you will stare at three dashboards showing three different numbers and trust none of them. Here are the benchmarks we see across Aussie Shopify stores doing $50K to $500K a month.
- Platform vs GA4 gap: 20-40% is normal. Meta will typically claim 1.5 to 2x the conversions GA4 credits it. If the gap is bigger than 50%, check your pixel and Conversions API setup before you touch budgets.
- Server-side tracking recovers 10-25% of lost conversions. Tools like Elevar and Littledata restore signal that browser-side pixels lose to ad blockers and iOS privacy settings. If you spend more than $10K a month on ads, this pays for itself in the first month.
- Post-purchase survey response rates: 15-25%. Anything above 30% is excellent. Below 10% usually means the survey is buried or asks too many questions. One question, on the order confirmation page, works best.
- Blended MER floor: 3x for most DTC brands. If total revenue divided by total ad spend drops under 3, your channel mix needs work regardless of what any single platform claims. Cross-check against your store conversion benchmarks to work out whether the problem is traffic quality or the site itself.
- Zero-attribution orders: under 15%. Every store has orders no layer can explain. If more than 15% of your orders show up as direct/unknown, your UTM discipline has slipped, usually in email and SMS links.
Imagine you run a Melbourne skincare brand spending $20K a month across Meta, Google and TikTok. Meta claims 220 orders, GA4 credits it 130, and your post-purchase survey says 40% of new customers first heard of you on Instagram. None of those numbers is wrong. Together they tell you Meta is driving discovery that Google Shopping later harvests, so cutting Meta because GA4 undercounts it would quietly strangle the top of your funnel. That is exactly the mistake the benchmarks above stop you from making.
Your Attribution Action Plan (Start This Week)
You don’t need to implement everything at once. Here’s the priority order:
Week 1: Fix your UTM hygiene. Create a naming convention document. Audit every active campaign link. Remove UTMs from internal links. This alone will clean up your GA4 data dramatically.
Week 2: Set up GA4 Data-Driven Attribution properly. Follow the steps outlined above. Set your lookback windows. Start reviewing the Attribution paths report.
Week 3: Add a post-purchase survey. Install Fairing or KnoCommerce. Set up the “How did you first hear about us?” question on your thank-you page. Start collecting data.
Week 4: Evaluate server-side tracking. If you’re spending $5K+ per month on ads, install Elevar, Littledata, or configure Shopify’s native Customer Events. Compare your conversion data before and after — the improvement is usually visible within days.
Month 2+: Consider a third-party attribution tool. If you’re running ads across three or more channels and spending $10K+/month, a tool like Triple Whale or Northbeam will pay for itself within the first month by showing you where to reallocate budget.
Inside the eCommerce Circle, attribution is one of the core Performance pillars we work through with every member. Because you can have the best products, the best ads, and the best website in the world — but if you don’t know which channels are actually driving your growth, you’ll always be guessing. And guessing is expensive.
If you want help building an attribution system tailored to your store and your budget, let’s talk.