Open your Shopify analytics right now. How many metrics are you looking at? Sessions, page views, bounce rate, time on site, cart abandonment rate, returning visitors, add-to-cart rate, checkout completion, customer lifetime value… the list goes on.
What’s in This Article
Here’s the problem: most Shopify store owners drown in data but starve for insight. They check their dashboard daily but have no idea which numbers actually matter, which ones are vanity metrics that feel good but drive zero decisions, or what to do when a metric moves in the wrong direction.
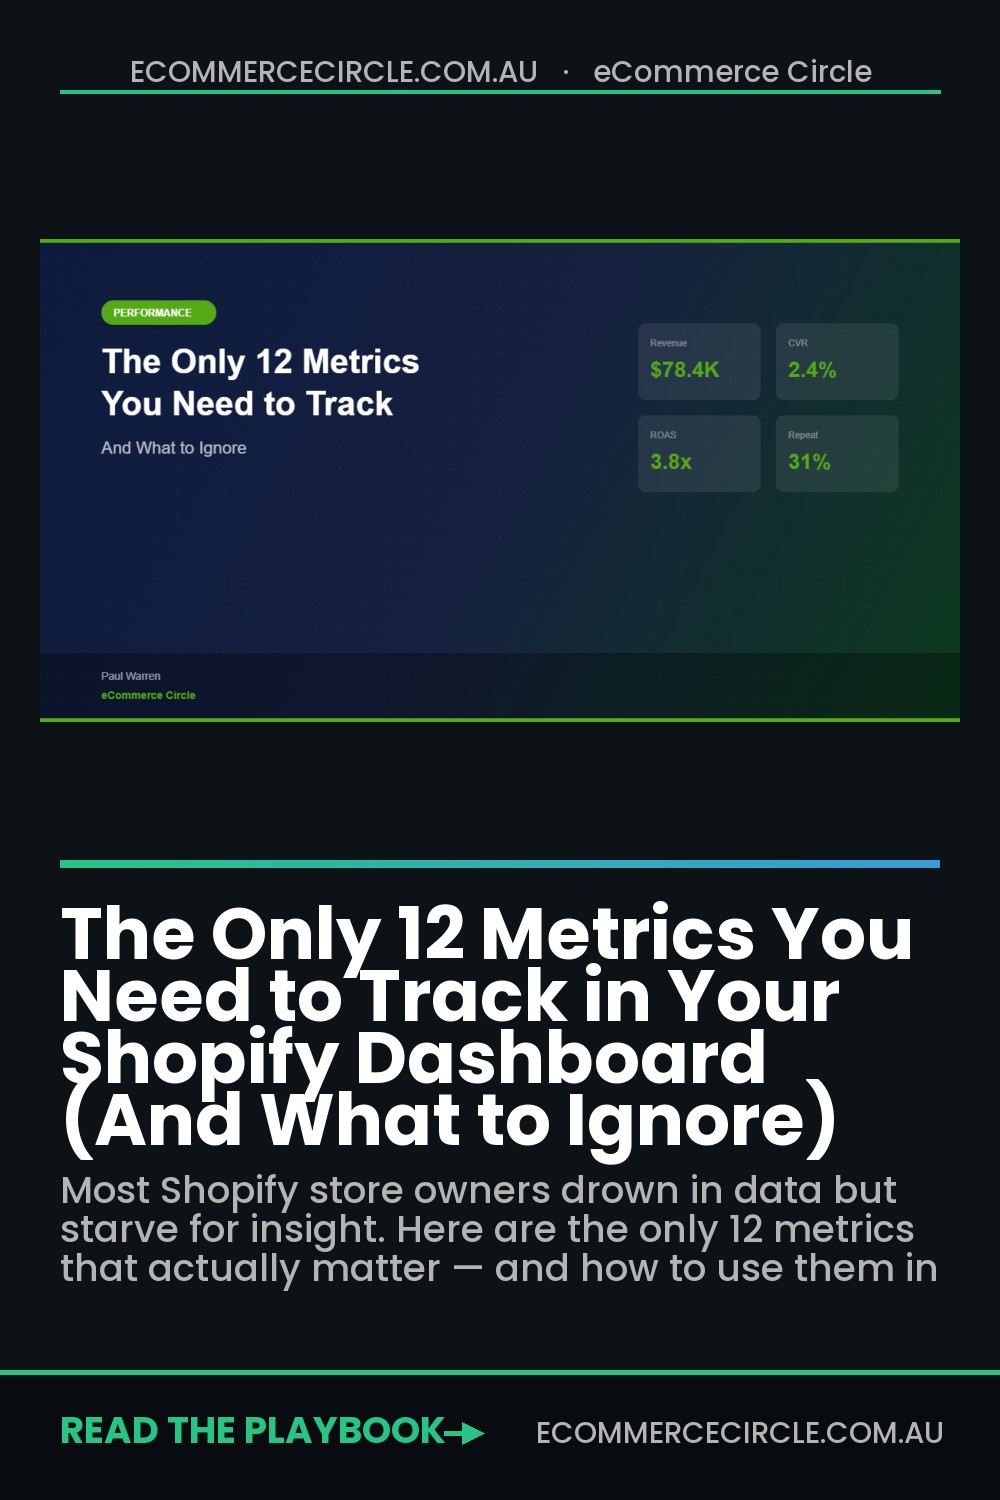
After working with hundreds of ecommerce brands, we’ve narrowed it down to 12 metrics that actually matter — the ones that tell you whether your business is healthy, growing, and profitable. Everything else is noise.
The 12-Metric Dashboard: Everything You Need, Nothing You Don’t
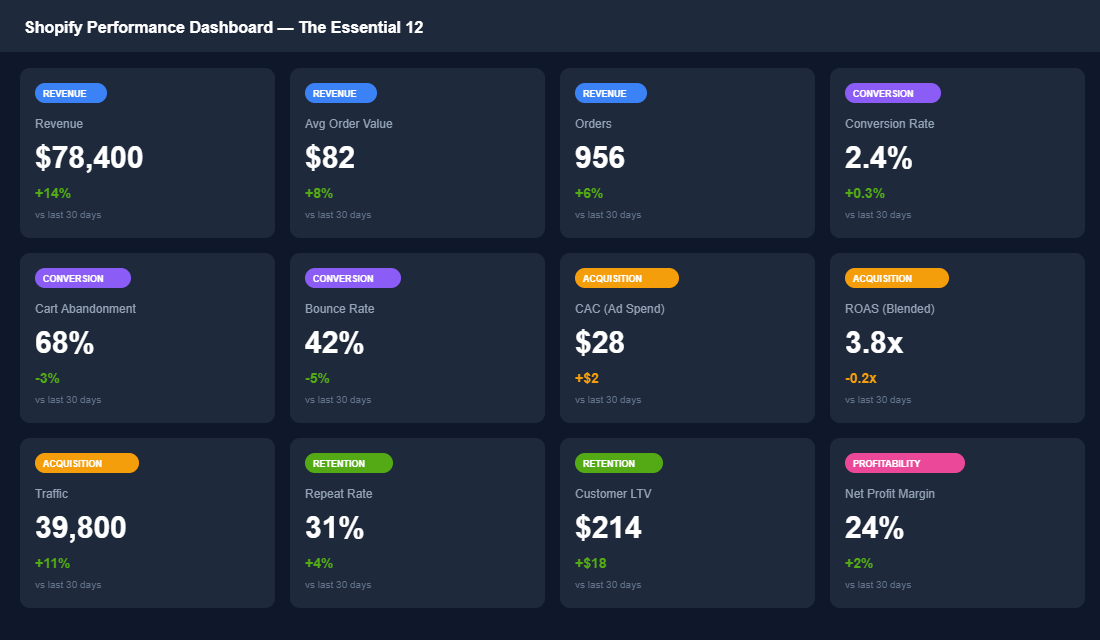
These 12 metrics fall into five categories: Revenue, Conversion, Acquisition, Retention, and Profitability. Together, they give you a complete picture of your business in under 5 minutes.
Revenue Metrics (The Scoreboard)
1. Total Revenue — Your top-line number. Compare it week-over-week and year-over-year (not just month-over-month, which hides seasonal patterns). Know your weekly revenue target and whether you’re tracking above or below. For a store targeting $80K/month, that’s roughly $18,500-$20,000 per week.
2. Average Order Value (AOV) — What each customer spends per transaction. This is one of the fastest levers to pull for revenue growth. Australian Shopify stores average around $75-$85 AOV. If yours is below that, you need bundles, upsells, or a free shipping threshold set above your current AOV.
3. Total Orders — Your order volume. Revenue can be misleading if one big wholesale order skews the number. Track orders alongside revenue to get the real picture. A healthy store sees consistent order growth of 5-10% month-over-month.
Conversion Metrics (The Efficiency Engine)
4. Conversion Rate — The percentage of visitors who buy. The average Shopify store converts at 1.4%. Top performers hit 3-4%. This single metric tells you more about your store’s health than any other number. If your conversion rate is below 2%, fixing it should be your #1 priority — because every improvement here multiplies the effectiveness of every dollar you spend on traffic.
5. Cart Abandonment Rate — Around 70% of carts are abandoned across ecommerce. If yours is above 75%, you have a checkout friction problem — unexpected shipping costs, complicated checkout flow, or lack of trust signals. If it’s below 65%, you’re doing well.
6. Bounce Rate — The percentage of visitors who leave after viewing one page. A bounce rate above 50% on product pages means your landing experience isn’t matching visitor expectations — usually a mismatch between ad promise and page reality, or a slow-loading page.
Acquisition Metrics (The Growth Engine)
7. Customer Acquisition Cost (CAC) — What you pay to acquire one customer. Calculate this by dividing your total ad spend by the number of new customers acquired. Know your breakeven CAC: if your AOV is $80 and your gross margin is 65%, your gross profit per order is $52. Your CAC needs to be well below that to be profitable on the first order.
8. ROAS (Return on Ad Spend) — For every dollar you spend on ads, how many dollars come back? Track this blended across all channels (Meta + Google + TikTok), not just per platform. A blended ROAS of 3.5x or higher is healthy for most Shopify brands. Below 2.5x and you’re likely unprofitable on new customer acquisition.
9. Total Traffic — Your traffic volume, broken down by source. But don’t just look at total sessions — look at traffic quality. 10,000 visitors from Meta ads that convert at 1.2% are less valuable than 3,000 visitors from Google organic that convert at 4.5%. Traffic without conversion context is a vanity metric.
Retention Metrics (The Profit Multiplier)
10. Repeat Purchase Rate — The percentage of customers who buy more than once. This is the most underrated metric in ecommerce. The average is around 22%. If you can move this to 35-40%, you dramatically reduce your dependency on paid acquisition and improve overall profitability. Track this monthly and tie it directly to your post-purchase email flow performance.
11. Customer Lifetime Value (LTV) — How much a customer is worth over 12 months. This number determines how much you can afford to spend on acquisition. If your 12-month LTV is $200 and your CAC is $30, you have a 6.7x LTV:CAC ratio — that’s excellent. Below 3x and your acquisition economics are unsustainable.
Profitability Metrics (The Reality Check)
12. Net Profit Margin — The metric that matters most and that most brands ignore. Revenue is vanity. Profit is sanity. Calculate your net margin by subtracting all costs (COGS, shipping, ads, platform fees, team, software) from revenue. A healthy Shopify brand should target 15-25% net profit margin. If you’re below 10%, you’re working hard for very little return.
How to Set Up Your Dashboard in Under an Hour
You do not need to be a data analyst to build a dashboard that works. The 12 metrics above live in three places: Shopify Analytics (free, built-in), Google Analytics 4 (free), and a third-party tool that pulls it all together.
Step 1: Enable GA4 and link to Shopify (20 minutes). Go to Shopify Admin > Settings > Apps and Sales Channels, install Google Channel. This syncs your purchase data straight to GA4. Enable the four standard ecommerce events: view_item, add_to_cart, view_cart, and purchase. Use the default settings unless you are tracking custom product attributes.
Step 2: Set up your key GA4 reports (15 minutes). Create three custom reports: (1) Conversion funnel showing traffic to add-to-cart to purchase, (2) Traffic source breakdown by revenue, and (3) Device performance by AOV. Save these as shortcuts on your home dashboard. You are looking for leaks in your funnel and which traffic sources actually convert.
Step 3: Choose your dashboard tool (15 minutes). Use Triple Whale ($99 USD/month) if you want speed and visual simplicity — it pulls revenue, AOV, and ROAS in real-time. Use Lifetimely ($99 USD/month) if you want LTV and repeat purchase analysis built-in — great for tracking Australian customers across regions. Or use Shopify Analytics for free if you are just starting — it covers revenue, conversion rate, and traffic, though you will be jumping between screens.
Step 4: Connect your ad accounts (10 minutes). Link your Meta Ads Manager and Google Ads to your dashboard tool. Your ROAS metric is worthless if it is disconnected from your ad spend. Triple Whale and Lifetimely both sync automatically — just authenticate once and they pull cost data in real-time. Your CAC calculation will now be accurate, not a guess.
Stop Tracking Vanity Metrics
For every actionable metric, there’s a vanity metric that looks similar but drives zero decisions. Knowing the difference saves you from optimising the wrong things.
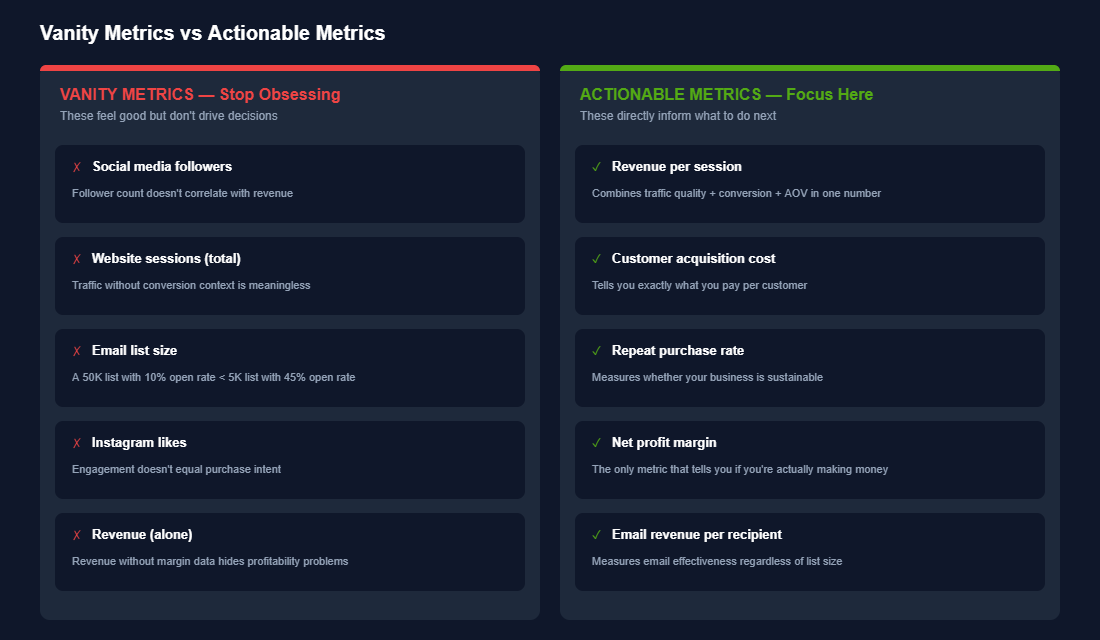
The simplest test: when a metric changes, do you know exactly what to do about it? If your conversion rate drops from 2.4% to 1.8%, you know to investigate product pages, checkout flow, and site speed. If your Instagram followers increase from 8,000 to 10,000, what do you do with that information? Nothing. That’s the difference.
The Five Metrics You Should Stop Tracking Today
Right now, you are probably checking things that feel important but do not matter. Let us kill them.
1. Instagram followers. Your follower count does not correlate with revenue. A store with 15,000 followers might do $3,000/month in sales while someone with 150,000 followers does half that. Track click-through rate from Instagram to your site and revenue per social visit instead.
2. Total page views. If 10,000 people land on your product page but none of them add to cart, those views are worthless. Track pages per session and bounce rate by page instead.
3. Email list size. You could have 50,000 email subscribers and still send campaigns that convert at 0.8%. Track email revenue per send and your engagement score (open rate plus click rate). An email list of 5,000 highly engaged customers is worth ten times a list of 50,000 disengaged addresses.
4. Time on site. Visitors who spend 15 minutes on your site might be lost and confused. Visitors who spend 90 seconds might be confident and ready to buy. Replace it with scroll depth on key pages and pages per session.
5. Total sessions without source. Saying “we got 50,000 sessions last month” is meaningless. You need the breakdown: 20,000 from Meta, 15,000 from Google, 8,000 direct, 7,000 from email. Track by channel. Your customer acquisition strategy depends on it.
The Weekly Review: Your 15-Minute Monday Morning Ritual
Every Monday at 9am, review your dashboard. Not to obsess or panic. To stay ahead of problems before they become crises. Here is exactly what you are looking for, metric by metric.
Revenue metrics (3 minutes). Is total revenue tracking to target? Compare last week to the same week last month and last year. Is AOV up or down? If it dropped, did a high-value product go out of stock or did discounts pull it down? If last week did $18,000 AUD and your target was $22,000, you need to know why by Tuesday morning.
Conversion metrics (3 minutes). Did conversion rate change week-over-week? Australia’s benchmark for D2C ecommerce is 2.1-2.8% — if you are below 1.5%, something is broken. Is cart abandonment tracking normal (65-80%)? Did bounce rate spike? If yes, check which pages — a sudden spike on your homepage means a technical issue or poor ad targeting sending the wrong audience. Read our guide on checkout optimisation if your cart abandonment is above 75%.
Acquisition metrics (4 minutes). Which traffic source had the best ROAS last week? This tells you where to spend more money next week. What is your overall CAC? If you spent $2,500 on ads and acquired 20 new customers, that is $125 per customer — check that against your AOV. Did traffic volume stay consistent? A 30% traffic drop but flat revenue means your conversion rate improved — that is actually a win. If your Meta ads account structure is clean, your CAC should be trending down over time.
Retention metrics (2 minutes). What percentage of last week’s revenue came from repeat customers? If below 20%, you are running a customer acquisition treadmill. Repeat purchase rate should be creeping up by 0.5-1% each month if your product quality is consistent and your email flows are working.
Profitability (2 minutes). Is net profit margin holding steady? For a Shopify store, 15-25% is healthy, 25%+ is excellent. If it dropped, did costs go up (shipping, COGS, ad spend) or did revenue fall? Check your contribution margin per order if you are not sure where the leak is.
You are not doing a deep analysis every week. You are checking the vital signs. If something looks off — conversion rate down 0.4%, CAC up $50, repeat purchase rate flat — make a note and investigate on Wednesday. If all 12 metrics are moving the right direction, your store is healthy and you can focus on strategic growth.
When to Sound the Alarm: Red Flag Thresholds
Numbers are only useful if you know what they mean. Here are the thresholds where you should stop what you are doing and investigate immediately.
Conversion rate drops below 1.2%. Your store might have a technical bug, poor traffic quality, or a product-market fit issue. Check your Shopify checkout for errors first, then review which traffic sources are underperforming. Do not spend another dollar on ads until you fix this.
CAC exceeds your AOV. If you are spending $120 to acquire a customer who spends $100, you are losing money on day one. That only works if your repeat purchase rate is above 35%. If it is not, cut ad spend on that channel immediately.
ROAS drops below 2.0x. You are spending $1 on ads and making $2 back. That barely covers your ad cost and half your operational costs. Refine your audience or test new ad creative before scaling further.
Repeat purchase rate stays flat for 4+ weeks. Your first purchase is working, but customers are not coming back. Send a survey to non-repeat customers asking why. The answer will tell you if it is product, shipping, or “I forgot you existed.”
Cart abandonment rate exceeds 85%. Fewer than 1 in 6 people who add to cart are completing checkout. This could be surprise shipping costs, a payment gateway issue, or required account creation. A 10% improvement here can add $5,000+ AUD monthly revenue.
Net profit margin drops below 10%. You are making $100 and keeping only $10. Almost no buffer for mistakes, paid ads, or supplier price increases. Raise prices, reduce COGS, or cut wasteful spending. This is your canary in the coal mine.
Your Dashboard, Your Edge
The difference between a Shopify store that grows and one that stagnates is not luck. It is knowing your numbers. The 12 metrics above are your operating system. Everything else is noise.
This week, set up your dashboard. By next Monday, run your first 15-minute review. In a month, you will be making decisions faster and smarter than 95% of Aussie ecommerce operators.
Inside the eCommerce Circle, data-driven decision making is one of the core pillars we build with every member — because you cannot improve what you do not measure. If you want help setting up a metrics framework that drives real growth, let’s talk.