Most Shopify owners look at one number to judge whether their store is healthy: total revenue. It’s the worst decision-making metric in ecommerce, because revenue averages everything together — your best customers, your worst customers, your one-and-done buyers, and the loyal repeaters who make your business actually profitable. When revenue is flat or up, you assume things are fine. When it dips, you panic and pour more money into ads. Either way, you never see what’s actually happening inside the customer base.
What’s in This Article
Cohort analysis is the cure for this blindness. Instead of one big revenue number, you group customers by the month they first bought, then watch how each group behaves over time. The grid that comes out tells you whether your stickiness is improving or rotting, which acquisition channels bring in customers worth keeping, and how much runway you actually have before churn eats your growth. The average DTC store sits at a 25-30% repeat purchase rate. The top 10% sit between 40-60%. The difference between those two outcomes is almost always visible in the cohort grid six months before it shows up in revenue.
This is the Shopify report most owners have never opened. By the end of this article, you’ll know exactly how to read it, what to fix when the numbers are bad, and the weekly rhythm we use inside the eCommerce Circle to make cohort analysis a decision-making tool — not a vanity exercise.
Why Averages Lie and Cohorts Tell the Truth
Pull your last 12 months of revenue. Now imagine two stores that both did $2 million for the year. Store A acquired 10,000 first-time customers and 32% of them came back for a second purchase. Store B acquired 14,000 first-time customers and only 18% repeated. Same revenue, completely different businesses. Store A is compounding. Store B is on a treadmill that’s getting steeper every month, because every cohort it acquires costs more than the last one and stays for less.
You cannot see this in your Shopify home dashboard. The home dashboard shows totals — orders, sessions, conversion rate, revenue. It mixes new and returning customers into one bucket, which means the moment your retention starts slipping, the only signal you’ll get is when ad costs creep up and total revenue stops growing. By that point you’ve usually been bleeding for two or three months.
Cohort analysis breaks the customer base apart by acquisition month and tracks each group separately. January’s customers are one cohort. February’s are another. You watch what percentage of each cohort comes back in month 1, month 2, month 3, and so on. The pattern that emerges is the most honest picture you’ll ever get of your business. A 5% increase in customer retention can drive a 25-95% increase in profits, depending on category. That’s not a marketing line — that’s the compounding math of customers who keep buying without you having to pay to re-acquire them.
How to Read a Cohort Grid in 60 Seconds
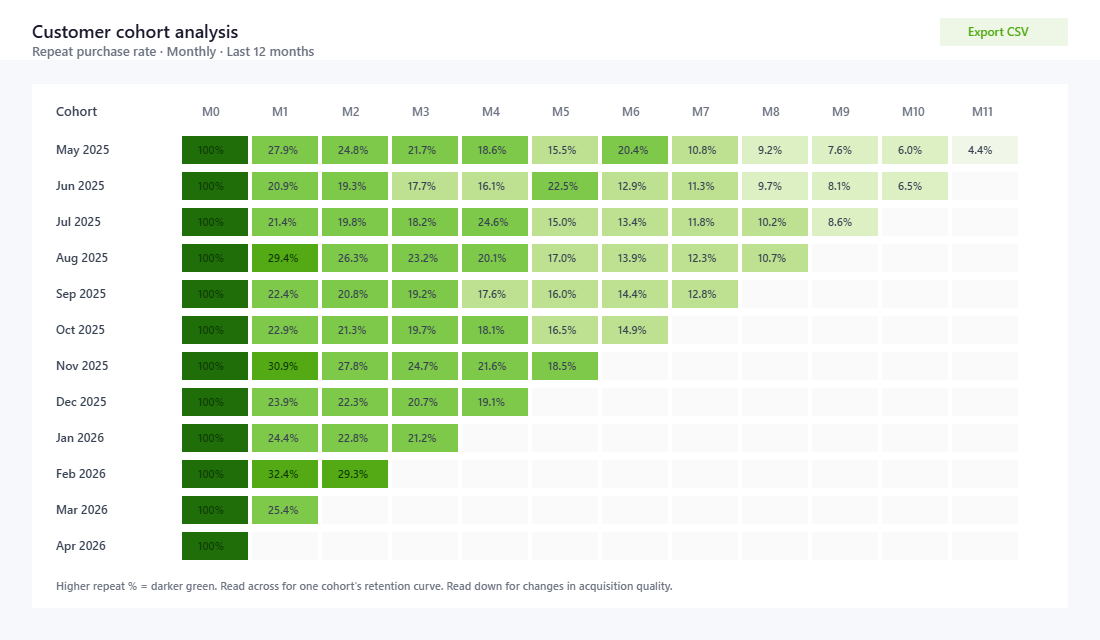
A cohort grid looks intimidating until you know the three movements to look for. Once you do, the grid stops being a wall of numbers and starts being a story. Open Shopify Admin and go to Analytics → Customers → Customer cohort analysis. By default it shows repeat purchase rate by month-of-first-purchase. The first column (Month 0) is the month they bought. Month 1 is the next month. Month 2 the month after. And so on across the page.
Read the grid in three movements:
- Read across a row. This is the retention curve for one cohort. Most ecommerce cohorts decay fast in months 1-3, then flatten. The level where the curve flattens is your “core retention rate” — the percentage of customers who actually become long-term loyalists. If your row never flattens and just keeps dropping, you have a leaky bucket and no real loyalty layer.
- Read down a column. This compares the same lifecycle moment across different cohorts. Look at Month 1 going down: are newer cohorts repeating at a higher rate than older ones, or a lower rate? If Month 1 repeat is rising for newer cohorts, your acquisition or onboarding is improving. If it’s falling, something has changed in how you’re attracting customers — usually a discount-heavy push or a channel that brings in low-intent buyers.
- Read diagonally. The diagonal shows what’s happening to all your cohorts at the same calendar moment. If every cohort spikes in November-December, it’s BFCM dragging old customers back. If every cohort dips in February, your re-engagement program isn’t doing its job. Diagonals reveal calendar effects that get hidden when you only look at one cohort at a time.
Healthy ecommerce retention generally looks like 15-20% of a cohort making a second purchase within 90 days, and 5-10% making a third within six months. If you’re well below that, you have a retention problem hiding inside an acquisition problem. If you’re well above, congratulations — you have permission to spend more on ads, because you know each new customer has a high probability of paying you back.
The Six Patterns That Show Up in Real Stores
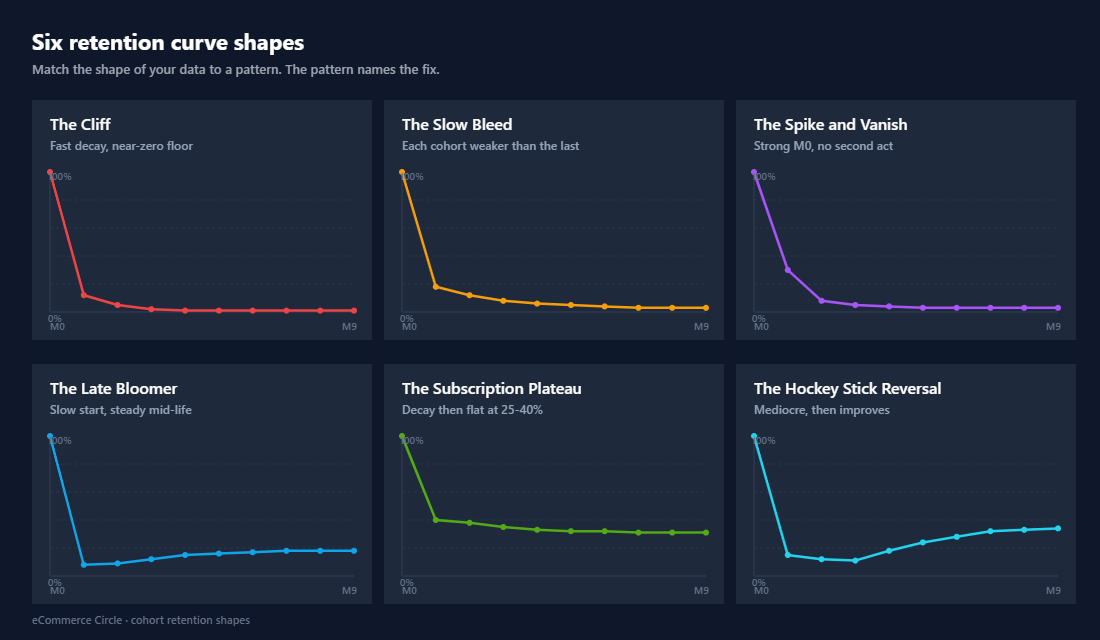
After looking at hundreds of cohort grids, the same six patterns keep appearing. Each one points to a different problem and a different fix. Match what you see to the pattern and you’ll know exactly where to invest your next four weeks of work.
- The Cliff. Month 1 retention is reasonable (10-15%) but it crashes to near-zero by Month 3 and stays there. This is a product experience problem. Customers tried you, didn’t love it enough to come back, and never will. Fix: review your post-purchase flow, unboxing, and product quality scoring on reviews from the first 30 days.
- The Slow Bleed. Every column going down is slightly worse than the one before. Newer cohorts are weaker than older cohorts at every lifecycle stage. This is almost always an acquisition quality problem caused by scaling discount-heavy ads or chasing volume on a low-intent channel. Fix: pull spend off your worst-performing prospecting audiences and rebuild your offer hierarchy.
- The Spike and Vanish. Month 0 has high repeat rates (people buying twice in their first month) but Month 2 and beyond are flat. This usually means you launched a strong welcome offer or bundle, but you have no second act. Fix: build a 60-90 day re-engagement sequence that lands when the consumable runs out.
- The Late Bloomer. Months 1-3 are weak but Month 6-12 holds up surprisingly well. You’re attracting buyers who consider carefully and re-buy slowly. This is common in furniture, considered apparel, and high-AOV niches. Fix: stop benchmarking against fast-moving categories. Build patience into your retention sequences and lean into birthday, anniversary, and seasonal triggers.
- The Subscription Plateau. Cohorts decay for 60 days, then sit flat at 25-40% for months. Beautiful pattern. This is what subscription or true-loyalty brands look like. Fix: protect this. Make sure your cancellation flow, payment retry logic, and customer service are at world-class standards because every percentage point lost here is permanent damage.
- The Hockey Stick Reversal. Cohorts that were mediocre suddenly improve in Month 4-6 because of a new email flow, a referral program, or a product launch. Fix: figure out exactly what changed, document it, and apply the same trigger earlier in the customer lifecycle.
Cohort by Acquisition Channel: Where the Real Money Lives
The default Shopify cohort report groups customers by month. That’s a starting point, but the higher-use version is cohorts by acquisition channel. Customers who first found you through Meta ads behave very differently from customers who came in through organic search, referrals, or email. When you blend them all together you get an average that hides which channels are actually building your business.
To do this, you’ll need to either tag customers with their first-touch channel in Klaviyo, use a third-party tool like Peel, Mipler, or Lifetimely, or build a manual report in Google Sheets pulling from Shopify’s customer export. The output you want is a grid where the rows are channels (Meta, Google, Organic Search, Email, Referral, Direct) and the columns are repeat purchase rate at 30, 60, 90, 180, and 365 days.
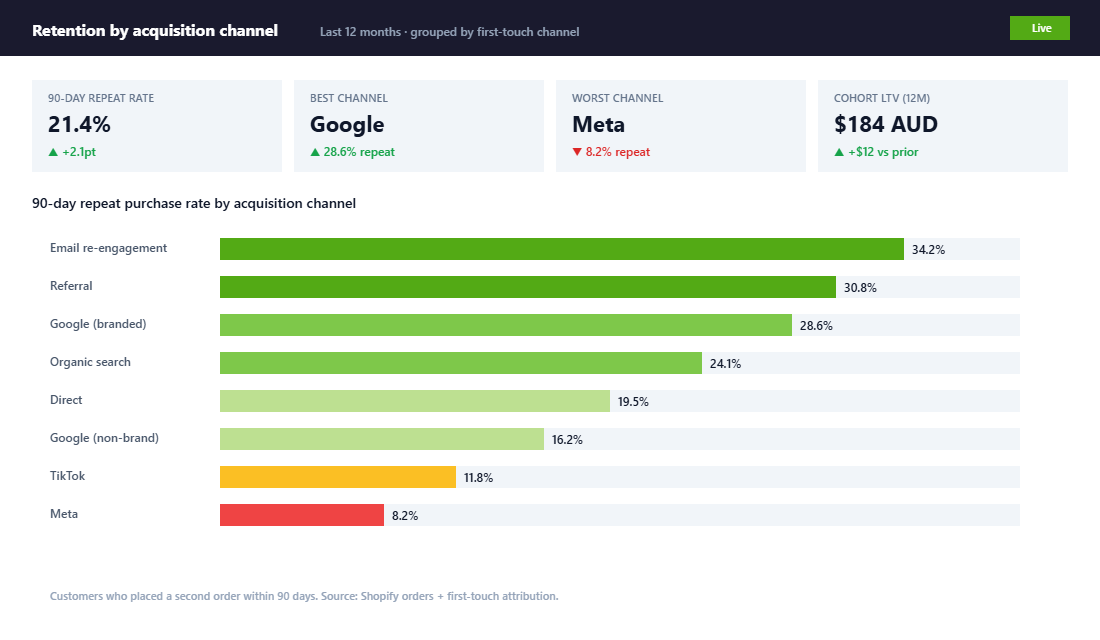
Here’s what most Australian Shopify owners discover when they run this report for the first time. Meta-acquired customers convert quickly but repeat slowly — they’re often discount-driven and need to be re-engaged with strong second-order offers. Google search customers (especially branded search) tend to repeat at 1.5-2x the rate of Meta customers because they came in with intent. Email-recaptured customers (those reactivated from a flow) repeat fastest of all, because you’ve already proven you can talk to them. Referral customers usually have the highest 12-month value because they came in with social proof attached.
The decision this report drives is uncomfortable but powerful. If your Meta-acquired cohort has a 90-day repeat rate of 8% and your Google-acquired cohort has a 22% repeat rate, you should not be allocating 70% of your ad budget to Meta. You should be doubling down on Google, SEO, and referral programs that produce the high-repeat customers, even if they have higher upfront CAC. Customers who repeat within 60 days are 3x more likely to become long-term, which means the channel that produces fast repeaters compounds in a way the cheap-but-shallow channel never will. This is the single biggest spending mistake we see when we audit a store’s marketing attribution.
The Australian Brand Examples Worth Studying
Two Australian brands have built world-class retention curves and both are worth dissecting.
Who Gives A Crap. The Melbourne-founded toilet paper brand turned a commodity product into a subscription business with a measured 75% open rate on customer communications and a 12-18% retention lift from their personalised impact dashboard, which shows each customer how many toilets their purchases have funded. Two cohort lessons sit underneath that. First, they identified a consumable they could reliably predict the runout cycle for and built the subscription around it, which collapses the gap between Month 0 and Month 1 to almost nothing. Second, they layered a non-financial reason to stay (the impact story) on top of the financial value, which lifts the floor of the retention curve where most brands flatten and lose customers permanently.
Frank Body. The Melbourne skincare brand built Hotel Pink, a tiered loyalty program where customers earn points not just for purchasing but for posting public reviews and sharing on social. The cohort effect of this is twofold. Each loyalty action creates a touchpoint that pulls the customer back to the site, which keeps the retention curve from decaying. And the social-share rewards generate referral cohorts that come in with higher 12-month value, because they arrived with friend-recommendation trust already attached. If you ran cohort analysis on Frank Body’s loyalty members versus non-members, the gap would be enormous.
The lesson from both brands is that retention isn’t an email problem — it’s a business model decision. They both engineered reasons to come back that go beyond “buy the same thing again”. One built a subscription around predictable consumption. The other built status and identity around participation. The cohort grid is what tells you whether the engineering is working.
Setting Up the Tooling: Shopify Native, Klaviyo, and One Power Tool
You don’t need expensive software to do cohort analysis well. You need a routine and one capable tool. Here’s the stack we recommend, depending on your stage.
Stage 1 — Shopify Native (free). Open Analytics → Customers → Customer cohort analysis. You can switch the metric between repeat purchase rate, retention rate, gross sales, AOV, and orders per customer. You can also change the grouping period (weekly, monthly, quarterly). For most stores under $2M AUD a year, this report is enough to drive decisions. Set a calendar reminder to look at it on the same day every week. The point isn’t perfection — it’s noticing changes.
Stage 2 — Klaviyo segments + Shopify export. Once you want to cohort by channel, lifecycle stage, or product, Klaviyo is the cheapest powerful tool you already pay for. Build segments like “First purchased in March 2026” or “First purchase via Google” and look at the placed-order metrics over time. Klaviyo will tell you the second-purchase rate and revenue contribution per segment, which is a back-door way of doing cohort analysis without buying another tool.
Stage 3 — A purpose-built cohort tool. If you’re past $2M AUD a year and serious about retention, install Lifetimely, Peel, or Mipler. The setup takes about 30 minutes:
- Connect the data sources. Authorise Shopify, your ad platforms, and Klaviyo so the tool can pull customer, order, ad spend, and email engagement data into one view.
- Set your cohort definitions. Decide whether you want cohorts by first-purchase month, first-purchase product, first-purchase discount usage, or first-touch channel. We usually run all four in parallel.
- Set the comparison metrics. Repeat purchase rate at 30/60/90/180 days, second-order AOV, contribution margin per cohort, and 12-month LTV are the five we look at first.
- Build alerts. Set an alert for when any month’s 60-day repeat rate drops more than 20% versus the trailing three-month average. That’s your early warning signal.
- Schedule the weekly review. Block 30 minutes every Monday morning, before email, before Slack. The cohort grid is the first thing you look at, before you make any spending decisions for the week.
Don’t skip Stage 1 to chase Stage 3. Most owners we coach try to install the fancy tool first and end up overwhelmed. Master the native Shopify report first. Make the rhythm habitual. Then add power tools when you’ve outgrown the basic view.
The Five Levers When Cohort Numbers Are Bad
Diagnosing the problem is half the job. The other half is knowing what to actually do about it. When a cohort is underperforming, there are five levers — in order of speed and impact — that we pull with our coaching members.
- Lever 1: The Second-Order Offer. Customers who repeat within 60 days are 3x more likely to become long-term. So build a 30-60 day window where the second-order offer is irresistible — bundle, cross-sell, or category expansion. This is the fastest cohort-curve fix because it shows up in your next month’s data.
- Lever 2: The Welcome and Post-Purchase Flow. A weak Klaviyo welcome flow is the single most common cause of a steep early-month drop. The fix is detailed and we cover it in depth in our post-purchase email flow guide, but the short version is: 5-7 emails over the first 30 days, with the second-order offer landing on day 14-21.
- Lever 3: Channel Re-Allocation. If your channel cohort report shows Meta producing weak repeaters, shift 20-30% of that spend toward Google, SEO, or affiliate. Don’t do it all at once, but the cohort data gives you the case to make the move.
- Lever 4: Product Experience. A flat retention curve with great Month-1 retention but no Month-3 retention almost always means the product experience didn’t impress enough to drive a repeat. Audit your reviews from customers within 30 days of purchase. Look for the words “expected”, “ok”, and “fine” — those are the silent killers of repeat business.
- Lever 5: The Loyalty Layer. Tiered programs (like Frank Body’s Hotel Pink) lift the floor of the retention curve. They’re slow to build but compounding once they’re running. Our recommendation is to wait until you have a baseline of 25%+ repeat rate before launching loyalty, because loyalty rewards the customers who would have come back anyway — its job is to lift the next layer up, not rescue customers who weren’t coming back.
The Cohort Review Checklist We Run Weekly
This is the exact 30-minute Monday review we run with our coaching members. Save it, print it, run it every week. After three or four weeks the patterns become obvious and the decisions almost make themselves.
- Pull the Shopify cohort grid for the trailing 12 months. Set the metric to repeat purchase rate, monthly grouping.
- Identify your core retention rate. The level where most cohorts flatten. Note whether it’s improving, flat, or declining month-over-month.
- Spot the worst Month 1. Which cohort had the steepest early drop? What did you do differently in acquisition that month? Discount-heavy promotion? New channel? Note it.
- Spot the best Month 1. Same question, in reverse. What did you do right? Document it so you can repeat it.
- Compare Month 1 of newer cohorts to Month 1 of older cohorts. Trending up = your acquisition or onboarding is getting better. Trending down = something is leaking. Don’t move on until you can name the cause.
- Switch the metric to AOV by cohort. Are repeat customers spending more or less than they used to on their second order? AOV expansion is a healthy sign. AOV contraction often means your offer hierarchy is broken.
- Pull channel cohort if you have it. Compare 90-day repeat rate by acquisition channel. Reallocate next week’s ad spend based on what you see.
- Pick one lever for this week. Don’t try to fix five things. Pick one — usually the second-order offer or welcome flow — and ship the change before next Monday.
- Note the decision in writing. Future you needs to know what current you saw and decided. This is how cohort analysis becomes a learning loop instead of a one-off observation.
Cohort Benchmarks for Aussie Shopify Stores
One question we hear constantly inside eCommerce Circle: “are my cohorts actually any good?” The answer depends on your category, AOV, and offer type, but here are the realistic benchmarks we see across hundreds of Aussie Shopify stores in 2026. Use these as a reality check on your own cohort report — if you are below the line, you have a specific problem to solve, not a vague vibe to wonder about.
- Repeat purchase rate by Day 90 — Consumables (supplements, beauty, food): 28-42%. Apparel: 12-22%. Homewares and one-time-purchase categories: 6-15%. Below the lower bound means your product, your follow-up, or both are leaking.
- Revenue retention by Day 180 — Healthy cohorts retain 50-75% of their Day 30 revenue at Day 180 (for consumables). Apparel typically lands 25-40%. If your retention is falling off a cliff between Day 60 and Day 90, look at your post-purchase flow length and frequency.
- Average orders per customer by Day 365 — 2.4-3.8 for consumables. 1.8-2.6 for apparel. 1.2-1.6 for homewares. Below 1.2 in any category usually means your acquisition is paying for one-and-done buyers.
- LTV:CAC ratio — Target 3:1 by Month 12, 5:1 by Month 24. Below 2:1 at Month 12 means your acquisition is unprofitable on a contribution basis — fix offer economics, not ad creative.
- Cohort gross margin trend — Healthy cohorts hold or slightly improve gross margin over time (loyal customers buy higher-margin items). If margin is shrinking cohort-over-cohort, you are training your audience to wait for sales.
Tools that make this analysis painless: Lifetimely and Triple Whale both build cohort tables natively for Shopify. Klaviyo’s Predicted CLV is decent for segmentation but not for true cohort reporting. If you are still doing this in a spreadsheet, that is fine — just set a Monday-morning 30-minute recurring block and actually open it. The biggest cohort mistake is not reading the report at all. Related reading: our piece on why the second sale matters more than the first goes deeper on what to do with the data once you have it.
Why Cohort Analysis Compounds Every Other Decision
Once cohort analysis becomes a habit, it changes how you think about every other lever in the business. Ad spend stops feeling like a gamble because you can predict, with reasonable confidence, what a new cohort will be worth at 12 months — which is exactly what customer lifetime value is when you’re calculating it properly. Pricing decisions get clearer because you know which customers are price-sensitive (the ones who never come back) versus quality-sensitive (the ones who do). Product launches get smarter because you can see whether your existing customer base actually pulls forward or whether you’re just selling to strangers each time.
Most importantly, cohort analysis is the report that lets you stop optimising for revenue and start optimising for the business. Revenue is a vanity number. Customer lifetime value, repeat purchase rate, and the slope of your retention curve are the numbers that tell you whether you’re building something durable. Repeat customers generate 44% of total revenue and 46% of orders despite accounting for only 21% of the customer base. The cohort grid is the place you watch that ratio live.
This is the work that separates Shopify owners who scale from those who plateau. The ones who scale build a feedback loop between acquisition, retention, and product, with the cohort grid as the dashboard that ties them together. The ones who plateau keep looking at total revenue, keep pouring more money into ads, and keep wondering why each new dollar of spend produces less than the last.
Inside the eCommerce Circle, the weekly cohort review is one of the core rhythms we install with every member. We run it together, we audit each other’s data, and we share what’s working across the group. If you’re scaling a Shopify brand and you’ve never opened your cohort report — or you’ve opened it once and bounced off — that’s exactly what we help with. Let’s Talk →