Your Klaviyo dashboard says email drove 42% of revenue last month. Your accountant says the store made less money than the month before. Both numbers are technically true, and that is the problem.
What’s in This Article
Most Aussie Shopify founders run email off two numbers: open rate and “Klaviyo attributed revenue”. Open rate has been a fiction since Apple Mail Privacy Protection landed in 2021. Attributed revenue, on Klaviyo’s default settings, gives email credit for any order placed within five days of an open, including opens that a machine triggered while your customer was asleep. Stack those two together and you get a channel that looks like a hero and a founder who cannot work out why cutting ad spend hurt so much.
This is the audit we run with members when their email numbers feel too good. It replaces open rate with five numbers you can trust, it shows you the two Klaviyo settings that quietly inflate everything, and it gives you a 20-minute weekly routine so the scorecard stays honest. A brand doing $150k a month usually finds that email is worth 20 to 35% of revenue on a reconciled basis, not 40 to 50%. That is still your best channel. It is just a smaller hero than the dashboard claims.
Why Open Rate Stopped Being a Metric in 2021
An “open” is a tracking pixel loading. Apple Mail Privacy Protection preloads every image in every email the moment it hits an Apple device, whether the customer ever reads it or not. Litmus put Apple Mail at roughly half of all email opens in 2025 (49.79% in their annual client share data), which means around half your list is firing a machine open on delivery.
The practical effect on a typical DTC list: reported opens run 15 to 35% higher than real human opens, and for lists heavy on iPhone users the gap is wider. Klaviyo’s own 2026 campaign benchmark across 183,000 accounts sits at a 31% open rate. A good chunk of that is Apple, not people.
This breaks three things at once. Subject line A/B tests judged on opens are picking winners at random. “Engaged in the last 90 days” segments built on opens are stuffed with people who have not touched an email since 2023. And any attribution model that counts an open as a touchpoint is handing revenue to email that a Google search or a direct visit earned.
The fix is not to find a better open rate. The fix is to stop using it as a decision metric and move to the five numbers below. Keep open rate on the dashboard if you like, the same way you keep the speedometer in a parked car.

Why Your Klaviyo Revenue Number Is Generous (and the Two Settings Behind It)
Klaviyo attributes on a last-touch model with a default lookback window of five days for email clicks and five days for email opens. Read that second one again. On a fresh account, a customer who received your Tuesday campaign, had the images preloaded by Apple, and then bought on Saturday after searching your brand on Google gets counted as email revenue. No click required.
Klaviyo is not hiding this. Their help centre spells it out and gives you a settings page to change it. Most founders have never opened that page. The two defaults that matter:
- Opened email counts toward attribution (5 days). This is the big one. With Apple firing half your opens automatically, open-based attribution is close to random.
- Apple MPP opens are included in attribution. There is a separate toggle to exclude them. It is off by default on older accounts.
Two smaller ones: the click window itself (five days is long for a $60 impulse product, fine for a $900 considered one), and “Received SMS” counting as a touchpoint for 12 hours, which gives your text channel credit for simply existing.
When members tighten these settings, attributed revenue typically drops 25 to 40%. Campaign revenue drops the hardest, often by half or more, because campaigns lean on opens. Flows hold up better because people actually click abandoned-cart emails. That is your first honest signal: the drop tells you how much of your email “performance” was borrowed from other channels.
The 10-minute fix: Klaviyo attribution settings and the Model comparison tool
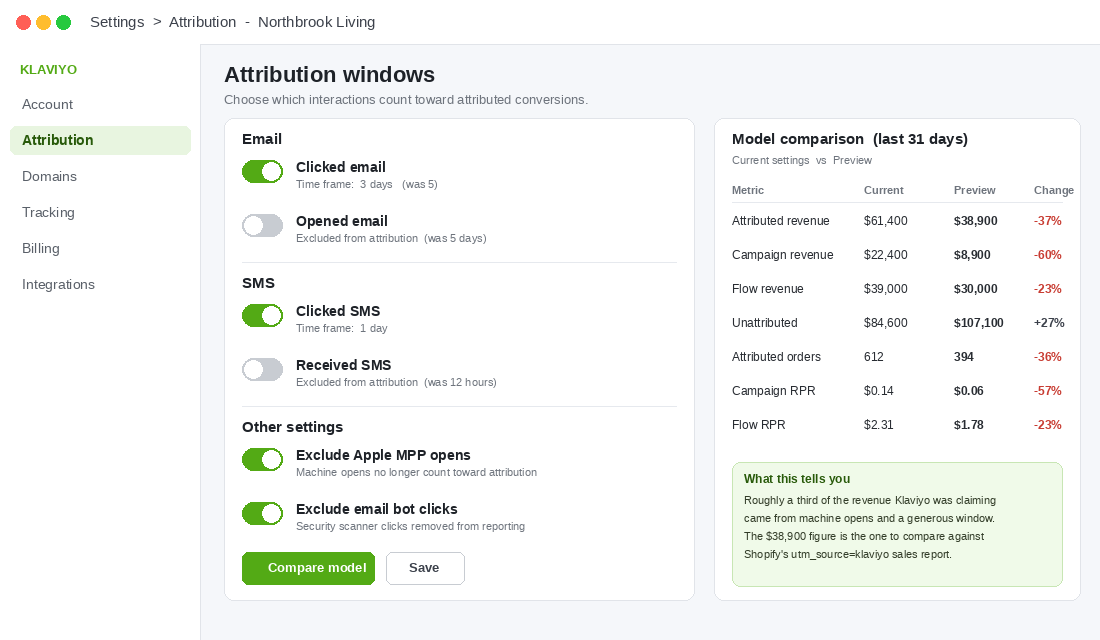
This is the one tool recommendation in the article and it is free, because you already own it. Klaviyo’s attribution settings page includes a Model comparison tool that previews what your last 31 days look like under different rules before you commit. Here is the exact sequence:
- Open Settings. Click the account menu in the lower left of Klaviyo, choose Settings, then Attribution.
- Untick “Opened email”. Under the Email channel, leave “Clicked email” on and remove opens from attribution entirely. If you sell a considered product and want to keep opens, set the window to 1 day, not 5.
- Set the click window to match your buying cycle. Three days suits most fashion, beauty, and consumables brands. Five to seven days for furniture, tech, or anything over $500. Do not go past 7 unless you have data showing people really do take that long.
- Turn on “Exclude Apple MPP opens” and “Exclude email bot clicks”. Bot clicks (corporate security scanners) are excluded by default on new accounts. Check anyway. The MPP exclusion is the one most accounts are missing.
- Click “Compare model” before saving. The preview shows attributed revenue, unattributed revenue, and your top campaigns and flows under current versus preview settings. Screenshot it. This is the number you will explain to your team, your agency, or your business partner.
- Apply settings, then wait 36 hours. Klaviyo recalculates historical data, so your reports will shift retroactively. Tell whoever reads the reports before it happens, or you will get a panicked message about email revenue “crashing”.
If you use a different platform (Omnisend, Mailchimp, Shopify Email) the principle holds. Find the attribution setting, remove opens, shorten the window. If the platform will not let you, treat its revenue number as marketing and use the Shopify method in Number 4 below instead.
The 5-Number Email Scorecard
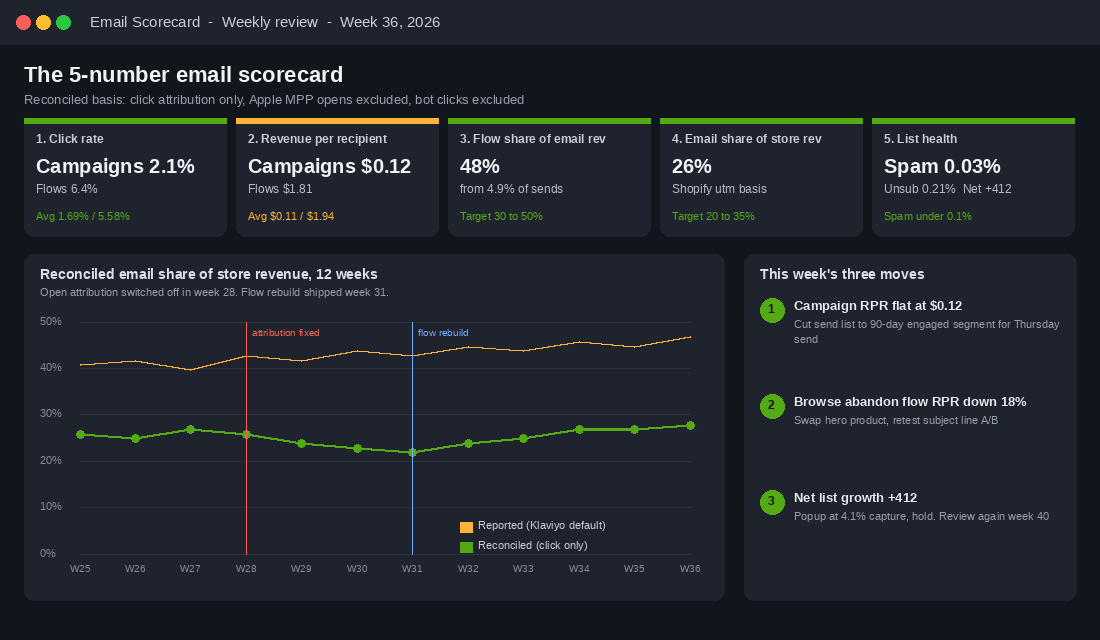
With attribution cleaned up, these are the only five email numbers worth a founder’s attention each week. Each one has a benchmark, a target, and a clear action if it slips. Every benchmark below is from Klaviyo’s 2026 data unless stated, and their figures are in US dollars, so treat the dollar values as directional rather than exact for an Australian store.
Number 1: Click rate (clicked to delivered), split by campaigns and flows
A click is a human decision. It cannot be faked by Apple, though it can be faked by security scanners, which is why the bot-click exclusion matters. Measure clicks against delivered emails, not opens, because click-to-open is built on the broken number.
- Campaign click rate: 1.69% average, 3.38% for top performers. Under 1% means your list is stale or your offers are generic. Fix the segment before you fix the creative.
- Flow click rate: 5.58% average, 10.48% for top performers. Flows click three times harder than campaigns because timing does the work. A welcome or abandoned-cart flow under 4% needs a rebuild, not a tweak.
- Subject line tests: judge them on clicks from now on. Klaviyo lets you set the A/B winning metric to click rate. Change it once and every future test improves.
P.E Nation, the Sydney athleisure brand, A/B tests format length in Klaviyo and found long-form emails drove 9% more click-throughs than short ones for their audience. That is a click-based finding. On opens it would have been invisible.
Number 2: Revenue per recipient
Revenue per recipient (RPR) is attributed revenue divided by emails delivered. It is the single best email metric because it punishes list bloat: send to 20,000 disengaged people and your RPR collapses even if total revenue holds. Klaviyo shows it on every campaign and flow report.
- Campaign RPR: roughly 11 cents per recipient on average across Klaviyo’s 2026 data. Top campaigns clear 30 cents.
- Flow RPR: roughly $1.94 average, an 18x gap over campaigns. The top 10% of flows reach $7.79 per recipient.
- The move when campaign RPR is flat: cut the send list, not the send. A campaign to your 90-day engaged segment will almost always beat the same campaign to the full list on RPR, and it protects deliverability. If you have not built that segment, the email deliverability playbook covers it.
Track RPR on the reconciled basis only. Under default attribution, campaign RPR is roughly double what it should be, which is exactly why founders keep sending to the whole list.
Number 3: Flow share of email revenue
Across Klaviyo’s 183,000 accounts, campaigns are 94.7% of email volume and flows are 5.3%. Yet flows produce nearly 41% of email revenue. Nearly half of flow revenue (48%) comes from first-time buyers, against 16% for campaigns. Flows are your acquisition closer, not your retention nice-to-have.
- Under $5m a year: aim for 30 to 40% of email revenue from flows.
- $5m to $20m: 40 to 50%.
- Above $20m: 50% plus, because campaign volume stops scaling and automation does not.
If flow share is under 25%, you are running a newsletter business, not an email program. Start with the five core flows (welcome, abandoned checkout, browse abandonment, post-purchase, win-back) and our welcome flow playbook shows the seven-email structure that does the heaviest lifting. If flow share is over 60%, the opposite problem: you are under-sending campaigns and leaving launch and seasonal revenue on the table.
Look at individual flows too. A flow that has not been edited in nine months is usually still “working” while its RPR quietly halves. P.E Nation runs 60 flows and treats each as a campaign to be tested, with post-purchase content tailored to the exact SKU bought. Their reward: 9% of new Black Friday customers made a second purchase, and Black Friday gross profit rose 18% year on year.
Number 4: Email share of store revenue, on a Shopify basis
This is the number that matters to the P&L, and the only way to trust it is to measure it outside Klaviyo. Shopify’s Sales by traffic referrer and UTM reports will show you orders where the landing session carried utm_source=klaviyo (Klaviyo adds UTMs automatically when tracking is enabled). It is a stricter last-click view: if the customer clicked the email, left, and came back via Google, Shopify credits Google. Klaviyo, even on click-only, credits email for three days.
Neither is “right”. Together they give you a range. Reconciled Klaviyo is the ceiling, Shopify UTM is the floor, and the truth is in between. A healthy Aussie DTC store lands at 20 to 35% of revenue in that band. P.E Nation attributes 35% of ecommerce revenue to Klaviyo in 2025 and Budgy Smuggler reports 30% with a 30x return on the platform fee, and both are exceptional email operators with large engaged lists.
Two rules. First, if the gap between your reconciled Klaviyo number and your Shopify UTM number is wider than 15 points of revenue share, something else is broken, usually UTM tracking or a duplicated flow, and the revenue reconciliation audit is the next step. Second, never present the default Klaviyo number to a bank, an investor, or a buyer. It will get pulled apart in due diligence.
Number 5: List health (spam complaints, unsubscribes, net growth)
The first four numbers describe how well email is earning. This one describes whether it will still be able to earn in six months. Three sub-numbers, checked weekly:
- Spam complaint rate: Google’s 2024 sender rules set 0.3% as the hard ceiling and under 0.1% as the target. Above 0.1% for two consecutive weeks and your campaigns start landing in Promotions or spam for everyone, including your best customers.
- Unsubscribe rate per campaign: under 0.3% is normal, 0.5% is a warning, and 1% on a single send means the offer or the segment was wrong. A spike after a frequency increase is the list telling you where the line is.
- Net list growth: new subscribers minus unsubscribes minus suppressions, weekly. Positive and steady is the goal. If the popup is capturing 4% of visitors but the list is shrinking, you have a retention leak, and a preference centre is usually the cheapest patch.
List health is where the default open-rate world does the most damage. Brands that define “engaged” as “opened in 90 days” keep mailing tens of thousands of machine-opened ghosts, complaint rates creep up, and deliverability degrades while every dashboard says engagement is fine.
What the Best Aussie Email Operators Do Differently
Budgy Smuggler, the 100% Australian-made swimwear brand, used to blast every new print to the whole list. After moving to segment-first sending in Klaviyo, they retarget only the people who viewed or tried to buy a specific print (their pink pineapple segment reported a 50% open rate, and that was in 2023 with MPP already running, so the click data behind it is what made it credible), and they time premiership-pair drops to the AFL and NRL grand finals with a 28% SMS click rate. Result: Klaviyo-attributed revenue up 45% year on year, 30% of total revenue, 30x return.
P.E Nation consolidated customer data from multiple regional storefronts into one Klaviyo account so they could see behaviour globally, then built 60 flows on top of it. They define VIP as three or more purchases in a year, gave that group 24-hour early access on Black Friday, and used dedicated post-purchase flows to educate new bargain-hunters on quality and fit. SMS average order value rose 22% year on year and SMS subscribers grew 28%.
The pattern in both: they measure on clicks and purchases, they segment before they send, and they treat flows as products to be maintained rather than plumbing to be forgotten. None of it requires a bigger list. It requires a truer scorecard.
The 20-Minute Monday Email Audit
Here is the routine. Do it every Monday, same time, before you look at ad accounts. Twenty minutes, one screen, three decisions.
- Minutes 0 to 3: Confirm the basis. Open Klaviyo attribution settings once a month and confirm nothing has reset (agencies and new team members sometimes “fix” it back to opens). Every number below is on the reconciled basis.
- Minutes 3 to 8: Pull the five numbers for last week. Campaign and flow click rate, campaign and flow RPR, flow share of email revenue, Shopify UTM email revenue as a share of total, and the three list health numbers. Write them in a sheet next to the previous eight weeks. A trend beats a snapshot every time.
- Minutes 8 to 12: Find the one number that moved most. Up or down. That is the week’s story. A flow RPR drop usually means a product went out of stock or a discount code expired inside the flow. A campaign click drop usually means the segment grew or the offer got tired.
- Minutes 12 to 18: Pick three moves. One for campaigns, one for flows, one for the list. Not ten. Three, written down, with a date. Cut a send list. Swap a hero product. Add a re-permission email to the sunset segment.
- Minutes 18 to 20: Check the floor. Spam complaints under 0.1%. Any campaign over 0.5% unsubscribes flagged. Net growth positive. If any of those fail, the three moves get replaced by one: fix deliverability first.
Write the moves in the same sheet as the numbers. In eight weeks you will be able to see which changes moved which number, and that record is worth more than any benchmark report.
Worked Example: How a Sydney Supplements Brand Rebuilt Its Email Number
Imagine you run a Sydney supplements brand doing about $260K a month. Klaviyo says email drove $94K last month, 36% of revenue, on default settings: five-day click and open attribution, with opens still switched on. Your Shopify report, filtered to UTM source klaviyo, says $41K. That is not a rounding error. That is a $53K gap you have been reporting to yourself, and possibly to your bank, for two years.
Running the five-number scorecard with attribution set to clicks only and a two-day window produced a reconciled Klaviyo figure of $47K, within 15% of Shopify. Then the real findings appeared.
- Campaign click rate was 0.9%, flow click rate was 4.2%. Campaigns were sent four times a week to the full list. Flows were doing the work and getting none of the attention.
- Revenue per recipient on campaigns: $0.11. On the replenishment flow: $2.40. Every campaign send to the unengaged 60% of the list was costing deliverability for almost no return.
- Flow share of email revenue: 71%. Healthy for a supplements brand, but it exposed that the campaign calendar was mostly noise.
- Spam complaint rate: 0.14%, above the 0.1% line Gmail and Yahoo now enforce, driven entirely by full-list campaign sends.
The changes were unglamorous. Campaigns dropped to two a week and went only to a 90-day engaged segment, a sunset flow suppressed 38,000 dead profiles, and the replenishment flow got a third email at day 35. Ninety days later, honest email revenue was $58K a month (up 23% on the reconciled base), spam complaints were at 0.04%, and Klaviyo costs fell $600 a month because the billable profile count dropped. The founder now reports one email number, and it matches Shopify.
Benchmarks for Each of the Five Numbers, by Store Size
Use these as ranges, not targets. A $40K-a-month store with a small, warm list will beat a $400K store on click rate every time, which is exactly why the raw number matters less than the trend against your own history.
- Click rate (clicked to delivered): campaigns 1.0 to 2.5%, flows 3 to 8%. Under 0.7% on campaigns for three consecutive months means the list, not the creative, is the problem.
- Revenue per recipient: campaigns $0.08 to $0.30, flows $0.80 to $3.00. The gap between the two is your clearest argument for spending more time on flows.
- Flow share of email revenue: 50 to 75%. Under 40% means your automations are thin; over 85% usually means you are not sending enough campaigns to a list that would buy.
- Email share of store revenue (Shopify basis, clicks only): 15 to 30% for most Aussie DTC categories, 30 to 40% for replenishment-heavy niches like supplements, coffee and pet food.
- List health: spam complaints under 0.1%, unsubscribes under 0.3% per send, net list growth positive after the sunset flow runs.
Two flows move these numbers faster than anything else. If your flow share is low, start with the seven-email abandoned cart architecture, which is still the highest revenue-per-recipient flow in almost every account we audit. If list health is the weak number, the win-back sequence gives lapsed profiles one honest chance before the sunset flow retires them.
The Compound Effect: What an Honest Scorecard Is Worth
Take a store doing $150k a month. On default attribution, Klaviyo claims $63k (42%) of that as email revenue. The founder, reasonably, keeps cutting Meta spend because “email is carrying us”. Revenue dips, nobody can explain why, and the dashboard still glows.
After the audit, reconciled email revenue is $40k (27%), and Shopify UTM shows $36k. The story changes: Meta was driving more first-purchase revenue than anyone realised, and the email “win” was partly Meta’s traffic being re-credited. Ad spend goes back up. That alone is often a five-figure monthly correction.
Then the five numbers start working. Campaign RPR at 12 cents on a 40,000 list means a weekly campaign earns about $4,800. Moving to a 90-day engaged segment of 18,000 typically lifts RPR to 20 cents or more: $3,600 per send from fewer than half the emails, with deliverability improving instead of degrading. Add two more sends a month to that engaged group and you are ahead.
Flow work compounds faster. Lifting three core flows from a 4% to a 6% click rate, on Klaviyo’s own averages, moves flow RPR by roughly a third. On $20k a month of flow revenue that is around $6,500 a month, or close to $80k a year, from editing emails that already exist. No new list, no new tool, no extra ad spend. Just a scorecard that tells the truth and a Monday habit that acts on it.
Four Mistakes That Put the Fiction Back
- Switching to click-only and then panicking at the drop. The revenue did not vanish. It was reassigned to the channels that earned it. Compare the new number to Shopify UTM, not to last month’s inflated one.
- Letting the agency report on their own attribution. If an email agency is paid on attributed revenue, they will fight for opens and long windows. Set the attribution model yourself, in writing, before the contract is signed.
- Judging flows on total revenue instead of RPR. A welcome flow’s revenue grows with the popup, not with the flow. RPR tells you whether the emails themselves got better or worse.
- Mailing the whole list to “protect” total revenue. Every disengaged send lowers RPR, raises complaints, and taxes deliverability for the people who do buy. Smaller, sharper sends win on every one of the five numbers.
Your Email Metrics Audit Checklist
Run this once now, then keep the Monday routine going.
- Klaviyo attribution: “Opened email” removed (or set to 1 day for considered products)
- Click window matched to buying cycle: 3 days for most DTC, up to 7 for high-ticket
- “Exclude Apple MPP opens” and “Exclude email bot clicks” both on
- Model comparison screenshot saved and shared with the team before applying
- A/B test winning metric changed from open rate to click rate
- Engaged segment rebuilt on clicks and purchases, not opens
- Five-number sheet created with eight weeks of history
- Shopify UTM email revenue pulled monthly and compared to reconciled Klaviyo
- Spam complaint alert set at 0.1%
- Monday 20-minute audit in the calendar, recurring
Inside eCommerce Circle, email measurement is one of the core pillars we work on with every member, because it is the channel most likely to be over-credited and under-worked at the same time. If you want a second opinion on your scorecard, let’s talk.