You check your cost per acquisition every morning. You know it to the dollar. Now answer this: what is one of those customers actually worth to you over the next twelve months? Most Shopify founders go quiet at that point. They cap ad spend at whatever feels safe, then watch a competitor with worse creative outbid them on every auction.
What’s in This Article
Here is the uncomfortable truth. That competitor is not braver than you. They just know a number you do not. They have measured their customer lifetime value on a contribution-margin basis, so they know exactly how much they can pay to acquire a customer and still bank a profit. You are flying blind and they are flying with instruments.
This matters more than any single ad tweak, because returning customers generate around 60% of DTC revenue, and existing customers spend roughly 67% more than first-timers. If you are only measuring the first order, you are managing 40% of your business and guessing at the rest. This playbook fixes that. You will learn to measure LTV the way profitable Aussie brands do, and pull the four levers that grow it.
LTV Is Not the Number Your App Shows You
There are two versions of lifetime value, and confusing them is the most expensive mistake in the whole exercise. The first is revenue LTV: total sales a customer generates over their life. That is the number most dashboards flash at you. It feels great and it will get you into trouble.
The second is contribution-margin LTV, often called CM2. That is revenue minus the cost of goods, shipping, payment fees, and returns. It is the money you actually keep and can reinvest into acquisition. Average ecommerce CLV sits somewhere between A$100 and A$300, but that headline is meaningless until you strip it back to margin.
Work an example. A A$138 revenue LTV at a 38% contribution margin is only about A$52 of real, reinvestable value. If you set your acquisition budget off the A$138, you will spend your way to a bigger revenue line and a smaller bank balance. Always measure LTV as contribution margin, not revenue. This one habit separates operators who scale from operators who stall.
Measure It With Cohorts, Not Blended Averages
If you divide total revenue by total customers, you get a blended average that lies to you. A brand growing fast is mostly made up of brand-new customers who have not had time to buy again, so the average looks terrible even when retention is strong. Averages hide the story. Cohorts tell it.
A cohort groups customers by the month they first bought, then tracks what that exact group does over time. Shopify gives you this for free. Go to Analytics, then Reports, then Customer cohort analysis. It shows retention and cumulative spend by acquisition month, so you can watch one group of customers mature instead of blurring everyone together.
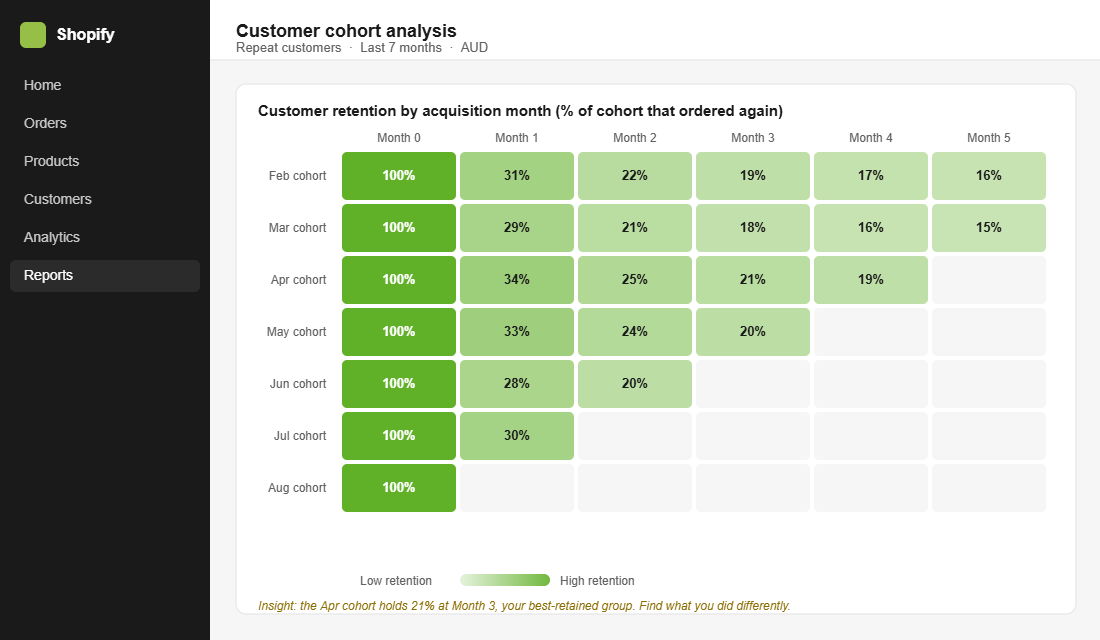
When you read the grid, Month 0 is always 100% because everyone bought once. The number that matters most is Month 1: the share of each cohort that comes back for a second order. Nail that and the rest of the curve follows.
Set your expectations against real benchmarks. Only 18.8% of customers place a second order within a 365-day window, measured across more than 156,000 DTC customers. The average repeat purchase rate lands at 25 to 30%, and the best brands push past 40%. If your Month 1 column is thin, you have found your single biggest growth lever before spending another dollar on ads.
The Two Numbers That Decide Your Ad Budget
Once you know contribution-margin LTV, two ratios tell you how hard you can push acquisition. The first is LTV to CAC. Target a minimum of 3:1, with a healthy DTC band of 2.5:1 to 4:1 measured on a verified 12-month cohort. Below 2:1 you are buying growth you cannot afford.
The second number matters even more for cash flow: CAC payback period, or how many months until a customer repays what you spent to acquire them. A A$200 CAC with a three-month payback beats a A$50 CAC with a twelve-month payback, every time, because the cash comes back while you can still use it. Pure DTC should aim for a three to six month payback and treat twelve months plus as the danger zone.
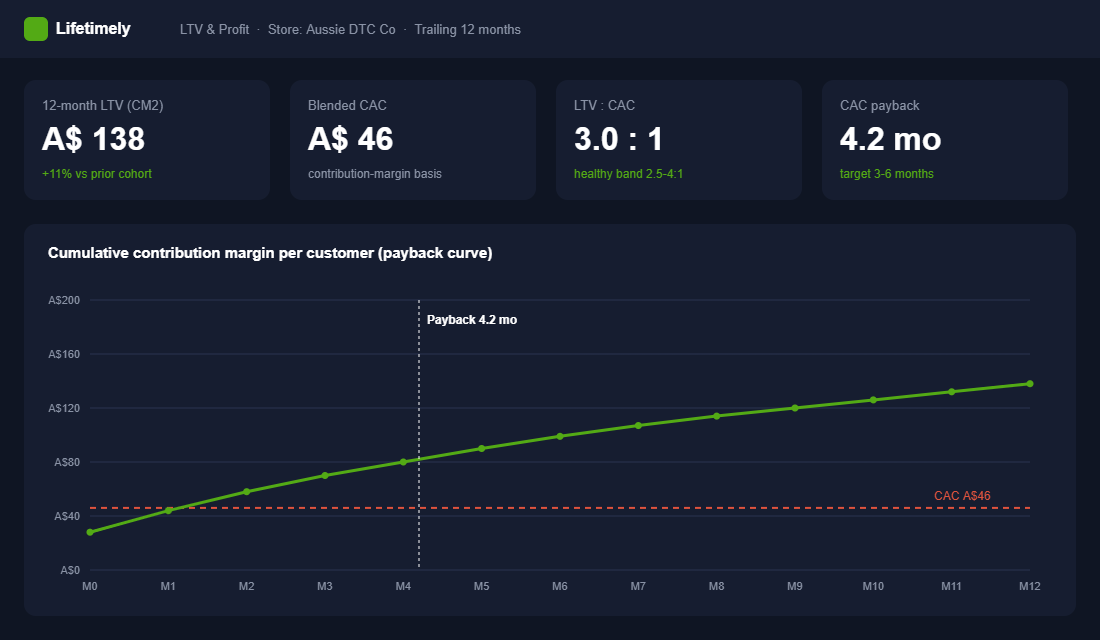
This discipline is not optional in the Australian market. Aussies spent A$82.6 billion online in 2025, up 14%, but the average online transaction has slipped to around A$96, and households now buy from roughly 16 different retailers a year. You cannot count on one big first order to carry the economics. Payback discipline is how you survive a market where shoppers are spreading their spend thin and comparing on value.
The Four Levers of LTV
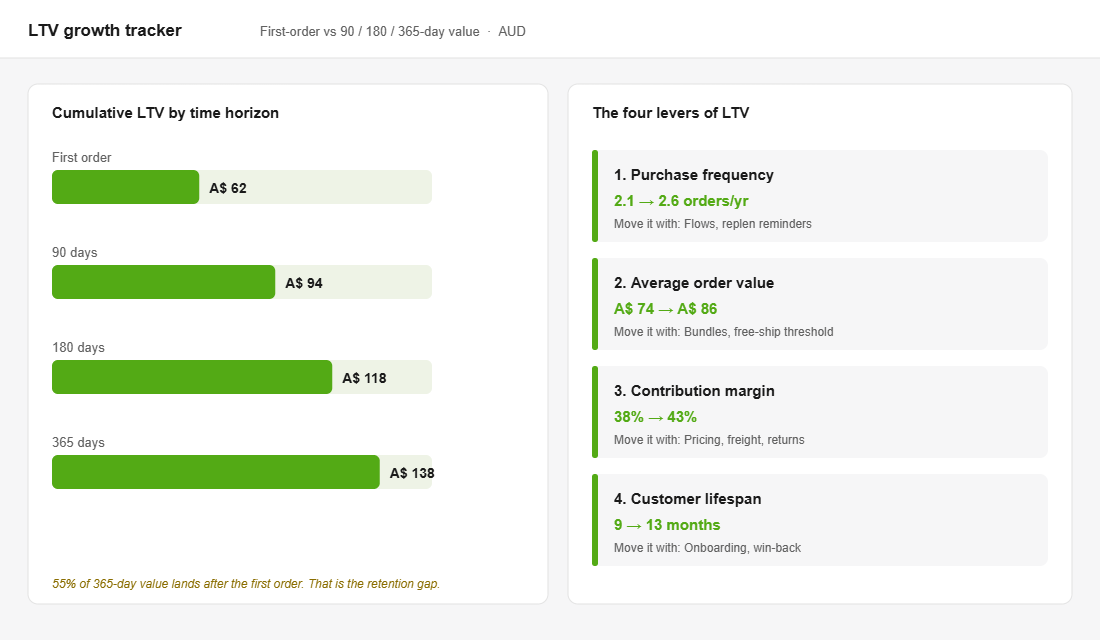
Lifetime value is not one dial. It is the product of four, and once you see them separately you know exactly where to spend your attention. This is the framework we use with members inside eCommerce Circle.
- Purchase frequency. How often a customer buys per year. Move it with post-purchase email and SMS flows, replenishment reminders, and subscription options. A 10-point lift in repeat rate typically drives a 25 to 40% increase in CLV.
- Average order value. How much they spend per order. Move it with bundles, a free-shipping threshold set just above your current AOV, and honest cross-sells. See our customer segmentation playbook for targeting the right offer to the right buyer.
- Contribution margin. How much of each order you keep. Move it with smarter pricing, recovering freight cost, and cutting the return rate. Our price testing playbook walks through finding your profit-max price without tanking conversion.
- Customer lifespan. How long they keep buying before they drift. Move it with strong onboarding on the thank you page and a win-back sequence that fires before they churn, not after.
Where You Should Sit: Benchmarks by Category
Your target LTV depends heavily on what you sell, so judge yourself against your category, not a global average. Repeat purchase rates cluster by vertical in a fairly predictable way.
- Consumables (supplements, food, pet): 35 to 45% repeat rate. Replenishment is baked in.
- Beauty and skincare: 30 to 40%. Routine-driven, ideal for subscription.
- Apparel: 25 to 32%. Fast fashion runs A$180 to A$240 CLV at 3.2 to 4.5 orders a year; premium runs A$280 to A$340 at lower frequency.
- Home goods and electronics: 12 to 25%. Longer gaps between purchases, so AOV and margin do more of the work.
Subscription models earn two to three times higher lifetime value, which is why category leaders lean into recurring revenue. Who Gives A Crap built an entire business on subscription-first toilet paper, turning a boring replenishable into predictable recurring revenue. Frank Body took a different route to the same place, using a community and a relentless post-purchase content engine to keep customers scrubbing and reordering. Different tactics, same outcome: they engineered frequency and lifespan on purpose.
The Tool Stack That Makes This Real
You do not need to buy anything to start. Shopify’s native Customer cohort analysis report is free and good enough to find your second-order gap. Open it, filter to the last several months, and read the Month 1 column across cohorts. That alone will change what you work on this quarter.
When you are ready to connect margin and channel data, Lifetimely (by Amp) is the strongest option at its price. Setup is quick: connect your Shopify store in minutes, then spend one to two hours configuring product costs, payment gateway fees, and ad accounts so it reports on a true profit basis. The historical import can take up to 24 hours, after which you can filter cohorts by product, channel, geography, or first purchase and forecast future value.
If you also need multi-touch attribution across Meta, Google, and TikTok in the same view, Triple Whale layers that on top, though it asks for a pixel install and more configuration. Start native, graduate to Lifetimely when margin clarity is the goal, and add attribution only when your channel mix genuinely demands it.
Why the Levers Compound
Here is the part that turns LTV from a report into a growth engine. The four levers multiply, they do not add. Lift frequency from 2.1 to 2.6 orders a year, nudge AOV from A$74 to A$86, and improve contribution margin from 38% to 43%, and each gain rides on top of the others. Modest movements stack into a materially higher lifetime value.
That higher LTV raises the ceiling on what you can pay to acquire a customer. A better max CAC lets you outbid competitors in the auction, win more customers, and feed them back into the same retention machine. That is the flywheel. It is also why the brand with worse creative keeps beating you: they are not winning on ads, they are winning on economics.
Your LTV Action Checklist
Work through this once and you will know more about your economics than most of your competitors know about theirs.
- Open Shopify’s Customer cohort analysis report and record your Month 1 second-order rate.
- Recalculate LTV on a contribution-margin basis, not revenue. Strip out COGS, shipping, fees, and returns.
- Divide margin LTV by CAC. Confirm you are above 3:1 on a 12-month cohort.
- Calculate your CAC payback in months. Flag anything past six months.
- Score yourself on each of the four levers and pick the single weakest one to fix first.
- Set a free-shipping threshold just above current AOV and one post-purchase flow live within two weeks.
- Re-run the cohort report in 90 days and compare the same-age cohort, not the blended average.
Inside eCommerce Circle, lifetime value is one of the core pillars we work on with every member, because it quietly sets the ceiling on everything else you do. If you want a second opinion on your numbers, let’s talk.