You set your prices once. Probably in a spreadsheet, probably by copying a competitor and adding a bit on top. Then you never touched them again. Most Aussie DTC founders do exactly this, and it quietly costs them more than any underperforming ad account ever will.
What’s in This Article
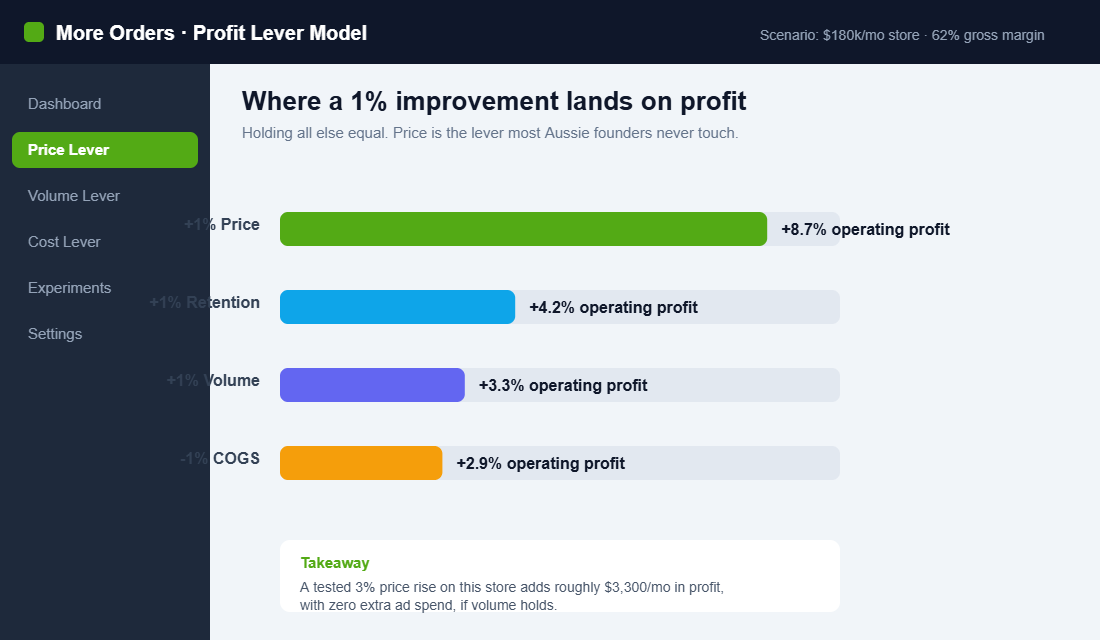
Here is the maths that should keep you up at night. McKinsey found that for the average business, a 1% lift in price flows through to roughly an 8.7% lift in operating profit, assuming volume holds. No new customers. No bigger ad budget. Just a number you already control, set slightly better.
The trouble is that “set it slightly better” is exactly where founders freeze. Raise prices and you might tank conversion. Drop them and you might torch margin. So the number sits untouched for two years. This playbook shows you how to test price the way the sharpest Shopify operators do, so you land on your profit-max price with evidence instead of a gut feel.
Why price is the lever you keep ignoring
Every DTC founder has four levers on profit: get more customers, get them to buy more per order, get them to come back, or charge more for what they already buy. Almost all your time goes into the first one. It is also the most expensive and the one you control the least.
Look at what acquisition now costs. The average ecommerce customer acquisition cost sat between $68 and $84 in 2025, and CAC has climbed 40 to 60% since 2023. In beauty it averages around $110 a customer, in apparel around $90. You are paying Meta and Google more every quarter to stand still.
Price is the opposite. It costs nothing to change, it applies to every order from the moment you ship it, and it compounds. On a store doing $180k a month at a 62% gross margin, a tested 3% price rise that holds volume is worth roughly $3,300 in extra profit every single month. That is a full-time contractor, funded by editing a field in Shopify.
This is a core idea we teach inside the More Orders operating system: your Profit is not just what is left over, it is something you engineer. If you want the wider view on how the number is built, our Shopify pricing strategy playbook covers positioning and structure. This piece is about the testing.
Before you touch price, know these two numbers
You cannot test what you cannot measure. Before you change a single price, get clear on two figures for the product you are testing.
- Your contribution margin. That is selling price minus cost of goods, minus payment fees, minus pick, pack and ship. Not gross margin. Contribution margin is the real dollars a sale drops to your business, and it is what a price test is trying to maximise.
- Your price elasticity. On average, brand price elasticity sits around -2.5, meaning a 1% price rise versus competitors costs you about 2.5% of unit sales. Yours will differ by category. Values-led and low-substitute products are far less elastic, which is why brands like Who Gives A Crap can hold premium pricing on a commodity like toilet paper.
These two numbers set your guardrails. If a product carries a fat contribution margin and low elasticity, you almost certainly have room to raise price. If margins are thin and shoppers cross-shop you on every marketplace, tread carefully and test small.
Method one: the survey test for new or low-traffic products
If you are pre-launch or you do not have the traffic for a live experiment, start with a survey. The Van Westendorp Price Sensitivity Meter has been used for decades and it is cheap to run. You ask buyers four questions about a product:
- At what price would this be too expensive to consider?
- At what price would it be getting expensive, but you would still think about it?
- At what price would it feel like a bargain?
- At what price would it be so cheap you would doubt the quality?
Plot the cumulative responses and the lines cross at your optimal price point. Send it to your email list or run it as a post-purchase survey, and aim for at least 300 responses so the curves settle. It will not give you a perfect answer, but it will tell you fast whether your instinct is in the right postcode or wildly off.
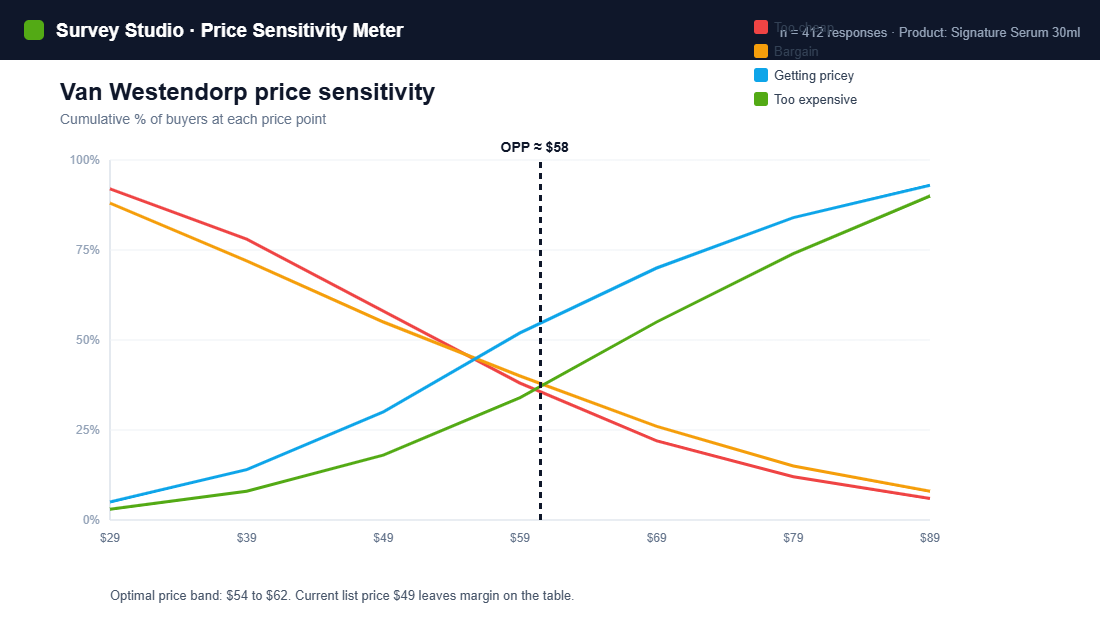
The chart above is a real pattern we see constantly: a founder lists at $49 because it felt safe, and the survey shows shoppers would happily pay into the high fifties. That gap is free money you are handing back at the checkout.
Method two: the live A/B price test
Once you have traffic, nothing beats a live split test. Show price A to half your visitors and price B to the other half, at the same time, and let real buying behaviour decide. The cleanest way to do this on Shopify without hacking your theme is a dedicated app. Intelligems is the tool most serious operators reach for. Here is how to set a first test up properly:
- Install Intelligems from the Shopify App Store and connect it to your store and your analytics.
- Pick one product with steady, meaningful traffic. Do not test your whole catalogue at once.
- Set two price groups, for example a control at $49 and a variant at $54, and let the app split traffic 50/50.
- Choose profit per visitor as your primary metric, not conversion rate. The app tracks orders, AOV and margin per group automatically.
- Run to significance. Let it reach at least a 95% confidence level, which usually means a few hundred orders per group and two to three weeks minimum.
- Roll the winner out to 100% of traffic, then bank the result and move to the next product.
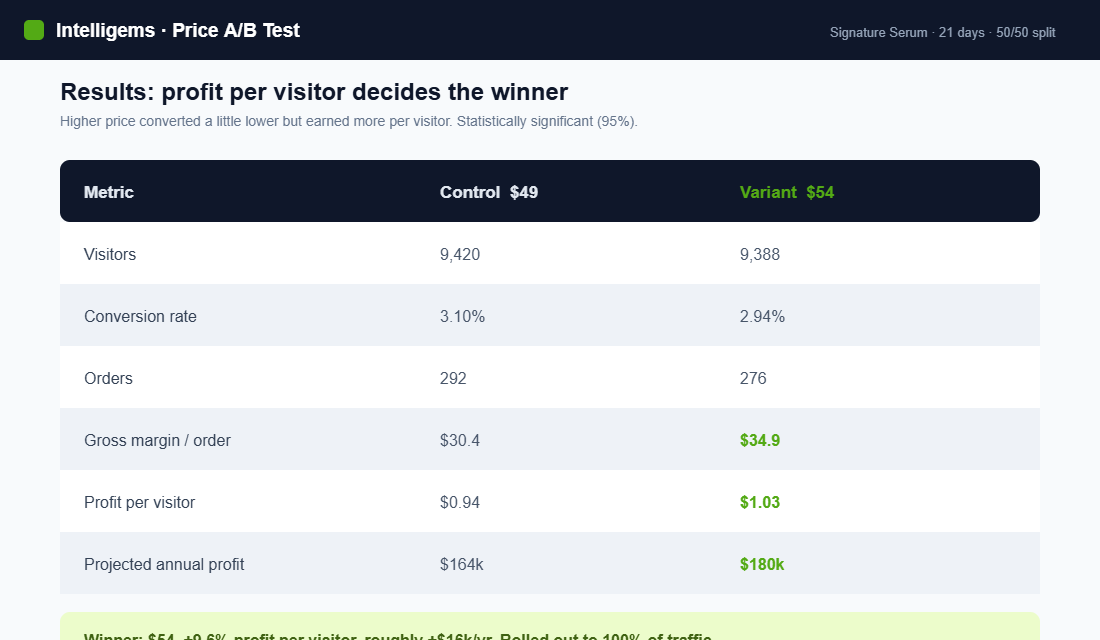
Notice what happened in that result. The higher price converted a touch lower, 2.94% against 3.10%, which is exactly the outcome that scares founders into never testing. But profit per visitor went the other way, up 9.6%, because every order it did win carried more margin. The conversion rate you were protecting was costing you money.
Method three: the time-split test for smaller stores
Under about 10,000 visitors a month, a clean 50/50 split can take too long to reach significance. Use a time-split instead. Run the current price for a fortnight, capture the numbers, then run the new price for the next fortnight under similar conditions, and compare.
It is less rigorous than a true A/B test because seasonality and promotions can skew it, so only run it in a stable window with no sales, no big launches and no major campaigns. Keep everything else identical. It is not perfect, but a directional read from real dollars beats another year of guessing.
Measure profit per visitor, not conversion rate
This is the mindset shift that separates operators from hobbyists. Conversion rate optimisation trains you to worship the conversion percentage, so a price test that lowers it feels like failure. It is not.
The only number that pays your wages is profit per visitor: contribution margin per order multiplied by conversion rate. A price that converts slightly worse but earns far more per order is a win. A price that converts brilliantly on razor-thin margin is how stores go broke while looking busy. If you run structured experiments elsewhere on your store, the same discipline from our Shopify A/B testing playbook applies here: pick one metric that maps to money, and let it call the winner.
Five mistakes that wreck a price test
- Discount contamination. Running a 10% off code over the top of a price test pollutes both groups. Pause site-wide discounts while you test.
- Calling it too early. A week of data and a hunch is not a result. Wait for significance or you will roll out noise.
- Testing during a sale or peak. BFCM and EOFY buyers behave nothing like your everyday shopper. Test in a normal trading window.
- Ignoring returns. A higher price can lift returns on some products. Measure profit after refunds, not just at checkout.
- Changing two things at once. New price and new product photos in the same window means you learn nothing. Move one variable at a time.
The compound effect: small price wins stack
A single 5% price win is nice. The real payoff is that price stacks with your other levers. Land a tested price rise, then raise average order value with bundles and thresholds, then lift repeat rate with a strong post-purchase flow, and the effects multiply rather than add.
Consider the maths. A 4% price gain, a 6% AOV gain and a 5% lift in repeat rate do not sum to 15%. They compound to a meaningfully larger profit number, all on the same traffic you are already paying for. Premium Aussie brands understand this intuitively. Koala rarely races to the bottom on price and leans on service and experience instead, and Frank Body holds a premium position rather than discounting its way to volume. To go deeper on the order-value lever, our Shopify average order value playbook pairs neatly with this one.
Your price testing framework
Here is the whole playbook as a checklist you can run this month:
- 1. Pick one product with steady traffic and a known contribution margin.
- 2. Find your guardrails: contribution margin floor and a rough elasticity read.
- 3. Get a direction with a Van Westendorp survey if the product is new or low-traffic.
- 4. Run a live A/B test in Intelligems, or a time-split if traffic is thin.
- 5. Judge on profit per visitor, after returns, at 95% confidence.
- 6. Roll out the winner, document the result, and move to the next product.
Do this across your top ten products over a quarter and you will almost certainly find several thousand dollars a month in profit that was sitting in plain sight, waiting for someone to test the number instead of guessing it.
Inside eCommerce Circle, price testing is one of the Profit pillars we work through with every member, because it is the fastest money in the business that nobody wants to touch. If you want a second opinion on where your prices should sit, let’s talk.