Every Aussie Shopify founder I work with has the same blind spot. They obsess over the 2 to 4% of visitors who buy. They survey them, email them, build avatars from them, run RFM analysis on them. And then they ignore the 96 to 98% who left without spending a cent.
What’s in This Article
That is the wrong half of the funnel to be studying. The Baymard Institute pegs the average cart abandonment rate at 70.22% across 50 studies. Layer that on top of all the visitors who never even hit add-to-cart, and the silent majority of your traffic is telling you something you have never bothered to record. The math gets worse when you remember that average ecommerce CAC is now $68 to $84 and climbing. Most stores now lose around $29 per new customer acquired (versus a $9 loss back in 2013). Every lost prospect is a dollar already spent.
This is where win/loss research comes in. It is one of the most under-used growth levers in DTC. Gartner has shown that organisations running rigorous, ongoing win/loss analysis see up to a 50% improvement in win rate and a 15 to 30% lift in revenue. Win/loss research firm Clozd has also published a finding that should make every founder uncomfortable: buyer and seller reasons for lost deals only align 15% of the time. Translated to ecommerce: 85% of what you think you know about why people did not buy is wrong.
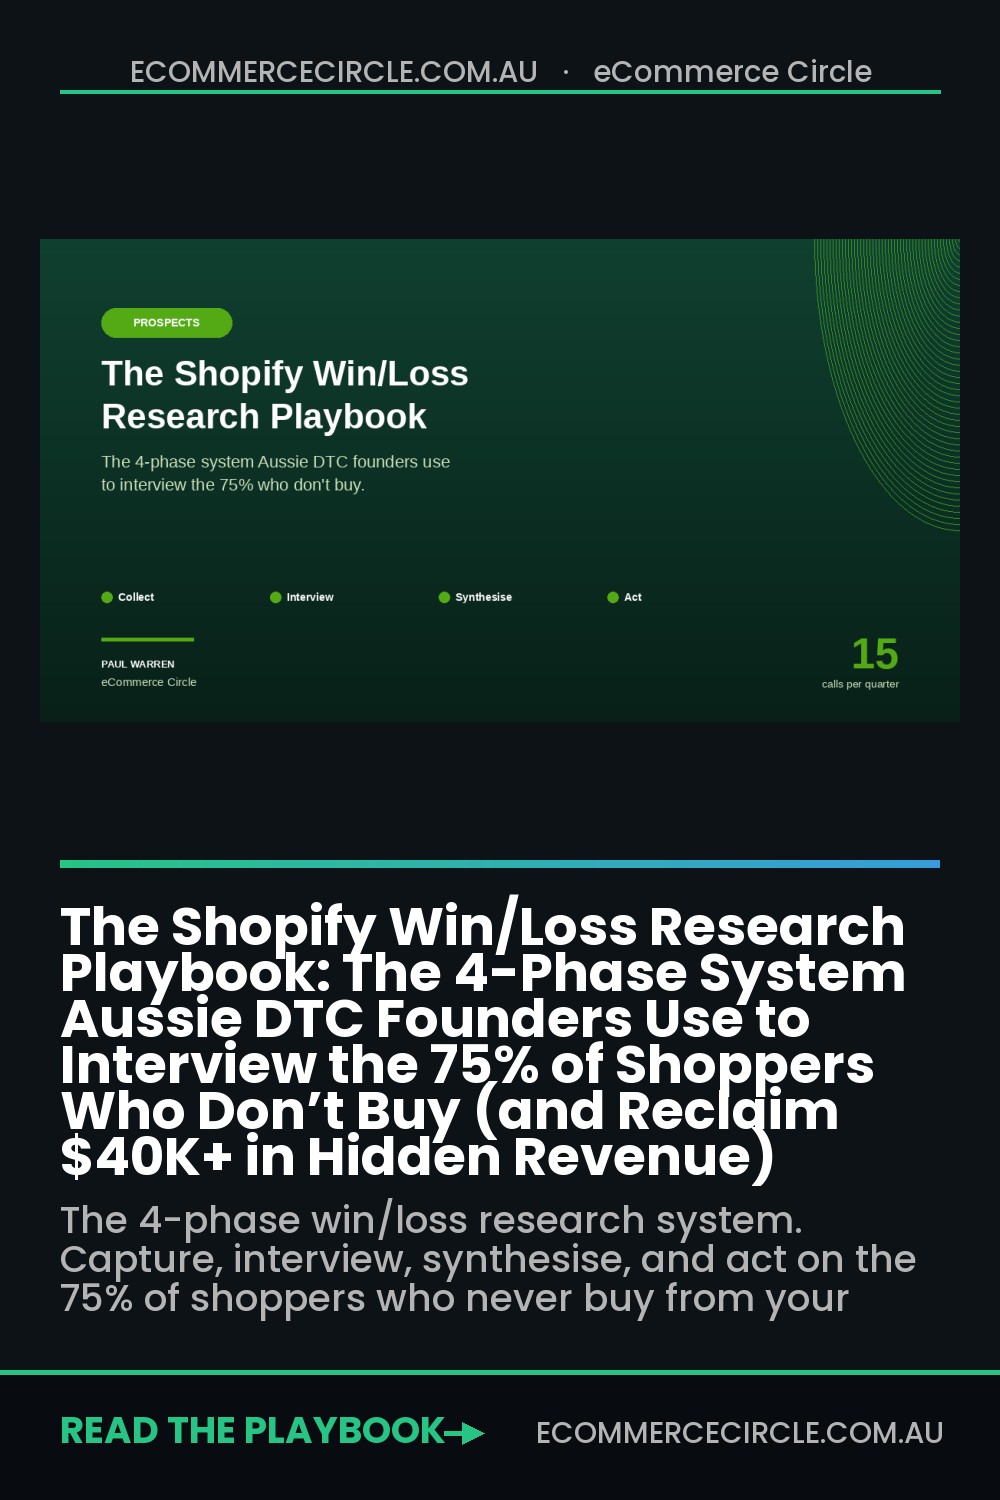
Below is the 4-phase Win/Loss Research System we use with members inside eCommerce Circle. It is built specifically for Aussie DTC operators between $40k and $500k a month. No fluff, no consultancy theatre. Run it for one quarter and you will recover $40k+ in hidden revenue from prospects who told you exactly what was broken if you bothered to ask.
Why Win/Loss Research Is the Most Underused Growth Lever in Aussie DTC
Founders default to customer interviews because they are easy to book. Existing customers already love you. They reply to emails, they pick up the phone, they say nice things. The problem is they are also the most biased sample you can possibly choose. They are the survivors. The 75 to 90% who leaked out of the funnel never tell you why, and that pool holds the highest-value insight in your entire business.
Three reasons most stores skip this work:
- It feels confronting. Listening to a person explain why your $89 product was “okay but not worth it” is not fun. Founders avoid the conversation because of ego, not because the data is hard to get.
- The tooling is fragmented. Cart abandoners, checkout abandoners, email-only subscribers who never bought, and churned customers all live in different platforms. There is no single dashboard. Setting it up takes one afternoon and most founders never get there.
- Surface answers feel sufficient. The first reason a person gives (“shipping too expensive”) is almost never the real reason. Without a 3-question dig, you mistake friction for cause and ship the wrong fix.
Done properly, win/loss research will tell you four things you cannot get from any analytics tool: the exact objections that kill purchases, the price thresholds buyers are quietly walking past, the competitors they almost bought from instead, and the trigger event that brought them to your site in the first place. Those four data sets compound across every channel you run, from Meta ads down to PDP copy.
The 4-Phase Win/Loss Research System (Overview)
This is the operating system. It runs as a quarterly cycle, not a one-off project. Each phase feeds the next, and the system gets sharper every loop as you build a library of recurring themes.
- Phase 1: Collect. Set up automated capture across four lost-prospect surfaces (exit-intent, checkout abandonment, lapsed subscribers, churned buyers). Goal: 100+ qualified responses per quarter.
- Phase 2: Interview. Run 15 thirty-minute calls across three buckets (lost prospects, churned customers, switchers from competitors). Goal: 5 calls per bucket per quarter.
- Phase 3: Synthesise. Tag every response, separate rational reasons from emotional drivers, count frequency, and rank by addressability and revenue impact.
- Phase 4: Act. Convert the top 5 insights into three action types: messaging changes, offer changes, and funnel/UX changes. Ship within 30 days.
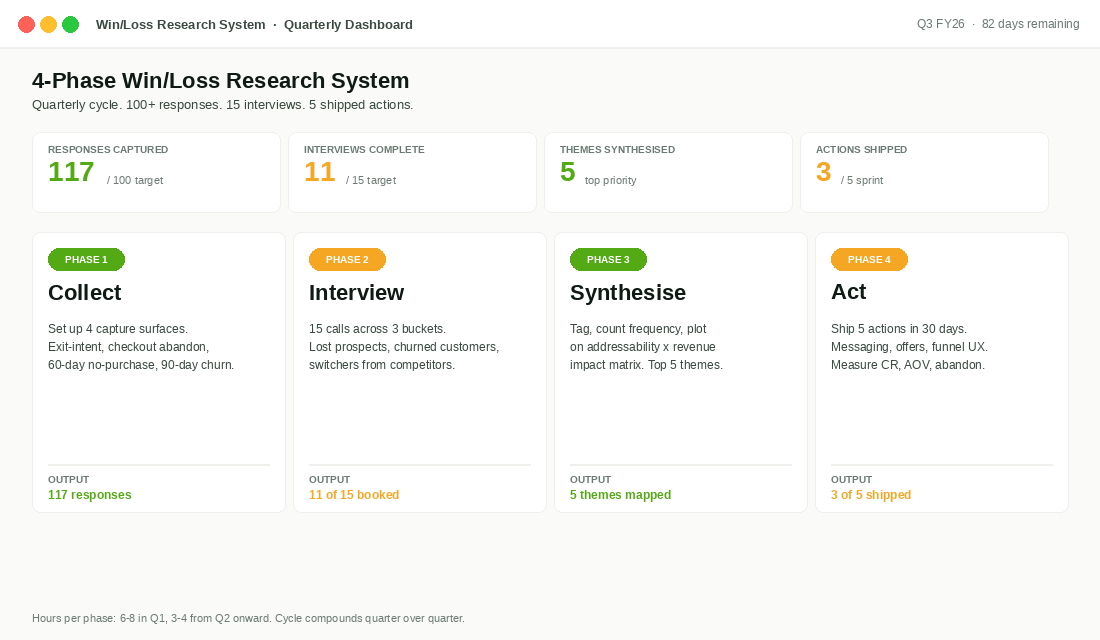
You will spend 6 to 8 hours per phase in quarter one, then 3 to 4 hours per phase from quarter two onward. The first cycle is the heaviest because you are building the infrastructure. After that, you are just feeding the machine.
Phase 1: Collect (Set Up the 4 Capture Surfaces)
You cannot interview people you do not have contact details for. Phase 1 is about turning anonymous abandonment into a contactable list. Stand up these four surfaces in one afternoon and you will have a steady inbound stream of lost-prospect data inside a fortnight.
- Surface 1: Exit-intent micro-survey. Fire a 1-question survey when desktop visitors move toward the close button or after 30 seconds of inactivity on PDPs and the cart. Tool: Hotjar (free up to 35 sessions/day) or Survicate. Question: “What is stopping you from buying today?” with 5 multiple-choice options and a free-text “Other”. Critical: open-text fields lifted exit response in one published case from 1.3% to 10.2% (a 785% jump). Stick the widget in the centre of the screen, not the corner. Corner placements convert at around 1%.
- Surface 2: Post-checkout-abandonment email. When a cart contains an email but no purchase, fire a 4-hour delay flow with one question: “We saw you got partway through checkout. What got in the way?”. Single-question Klaviyo emails routinely hit 30 to 50% open rates and 5 to 10% reply rates. One published exit-intent survey on a checkout page found 48.6% of respondents reported issues placing their order. That number alone justifies the build.
- Surface 3: 60-day no-purchase email survey. Anyone who joined your list (popup, lead magnet, waitlist) and has not purchased in 60 days gets a 2-question survey: “What stopped you from buying?” plus “What would make you reconsider?”. This pool is huge and almost no store mines it. Expect 5 to 12% response on standalone surveys, up to 15 to 25% if framed as a personal note from the founder.
- Surface 4: Churned customer exit survey. Trigger 90 days after the last purchase for anyone with 2+ previous orders. Question: “We have not seen you in a while, what changed?”. A 5% lift in retention drops 25 to 95% to the bottom line, so even small recovery from this group is disproportionate.
Quality control: rotate questions every 30 days so you do not get response fatigue. Cap each surface at 1 popup per visitor per 7 days. Always offer a small incentive (10% off, free sample on next order, prize draw). Incentives can double response rates. Track responses in a single Airtable or Notion database tagged by surface, date, response type, and product category. The goal is 100+ qualified responses per quarter, with 25+ from each of the four surfaces.
Phase 2: Interview (15 Calls Across 3 Buckets)
Survey data tells you what. Interviews tell you why. The two go together and one without the other will mislead you. Phase 2 is the unfair advantage most founders never build, because picking up the phone with people who did not buy from you feels worse than running ads. Push through.
You are running 15 thirty-minute calls per quarter, split across three buckets:
- Bucket A: Lost prospects (5 calls). People who came close but did not buy. Pulled from the post-checkout-abandonment survey and the 60-day no-purchase pool. Aim: find the friction that stopped them and the alternative they ended up with.
- Bucket B: Churned customers (5 calls). People who bought 2 or more times and then went silent for 90+ days. Aim: find out what changed for them, what they think of your brand now, and what would bring them back.
- Bucket C: Switchers (5 calls). Customers who switched FROM a competitor TO you in the last 6 months. Aim: find out what triggered the switch and the language they used to justify the move. This bucket is gold for ads and PDP copy.
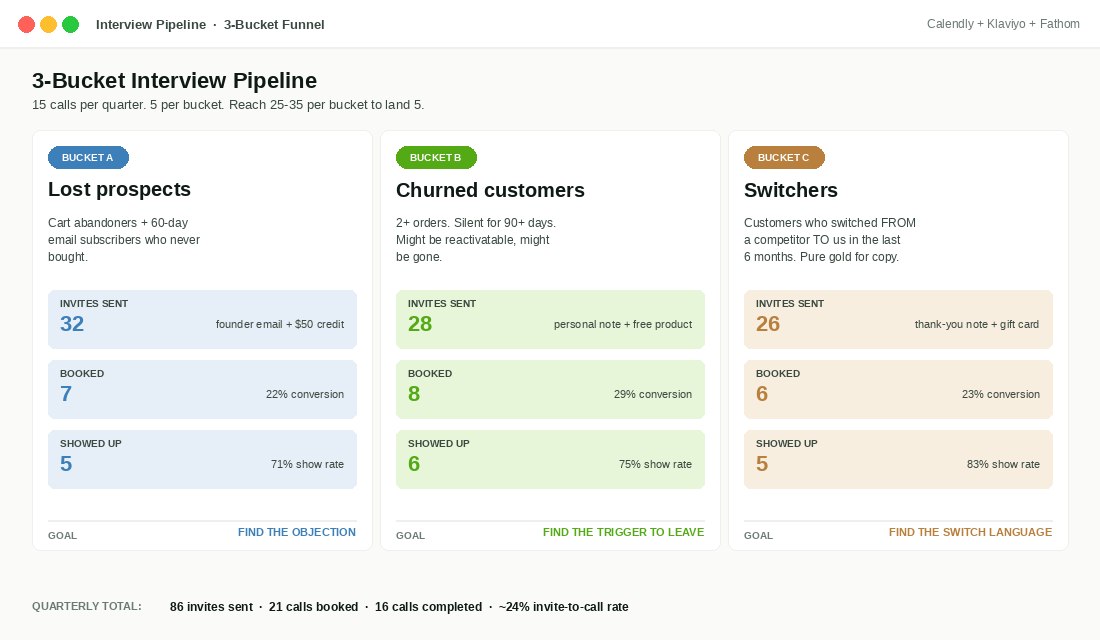
Outreach playbook: send a personal email from the founder address, offer a $50 store credit or gift card for 30 minutes, link Calendly. Expect to send 25 to 35 invites to land 5 calls per bucket. Use Zoom or Google Meet, record with consent, transcribe with Otter, Fireflies, or Fathom. The transcripts are the asset, not the call itself.
Use this 8-question script for every interview. It draws from Bob Moesta’s Jobs-to-be-Done switch-interview methodology, adapted for ecommerce:
- Walk me back to the moment you first started looking for [product category]. What was happening? (The trigger event.)
- What were you using or doing before? Why did you start looking for an alternative? (The push.)
- How did you find us? What did you see that made you click? (The channel and creative truth, not what your attribution model claims.)
- What was going through your head when you first hit the site? What did you expect to find? (Expectation vs reality.)
- Tell me what happened next. Walk me through everything you did. (The actual journey, not the funnel report.)
- What almost stopped you from [buying / coming back]? (The objection.)
- What did you compare us against? What made you pick them / us? (Competitive set.)
- If you could change one thing about your experience, what would it be? (The fix.)
Two rules that separate amateurs from operators. First: never accept the first answer. When someone says “it was too expensive”, the next question is always “compared to what?”. When someone says “the shipping was slow”, the next question is “what would have felt fast?”. The real insight is two layers down. Second: listen for the exact words the customer uses, especially metaphors. The phrase “I just needed something that worked” is more valuable than 50 lines of survey data. Drop it directly into your next Meta ad and watch the CTR climb.
Phase 3: Synthesise (Theme, Quantify, Prioritise)
Raw transcripts and survey responses are just noise. Phase 3 is where you convert them into a decision-grade insight document. Block 3 hours at the end of each quarter for this. Do not delegate it to a VA on the first run. The founder needs to be in the data.
Step 1: tag every response with two attributes. The rational reason (the stated cause: price, shipping, delivery time, fit, trust, missing feature) and the emotional driver (the underlying feeling: doubt, regret avoidance, status, identity, ease, FOMO). Most founders only track rational reasons and end up shipping rational fixes for emotional problems. Adding the emotional layer is the single change that converts research into revenue.
Step 2: count frequency. How many lost prospects raised “shipping cost”? How many “did not trust the brand”? How many “couldn’t tell what size to order”? You are building a frequency-by-theme table that shows where the volume is, not just where the loudest complaint is.
Step 3: cross-reference with Baymard’s published top abandonment reasons (39% extra costs, 24% required account creation, 21% slow delivery, 19% trust, 18% complicated checkout, 17% no upfront total, 15% poor returns policy) plus the 43% who say “just browsing”. If your top themes match the industry baseline, you have a usability problem to fix. If your themes diverge from the baseline, you have a positioning or product problem that no UX patch will solve.
Step 4: prioritise using a 2-axis matrix. Plot every theme by addressability (can we ship a fix in 30 days?) and revenue impact (how much of the abandoned pool does this affect, and at what AOV?). The top-right quadrant is your sprint backlog. Everything else goes on the parking lot or the strategic roadmap.
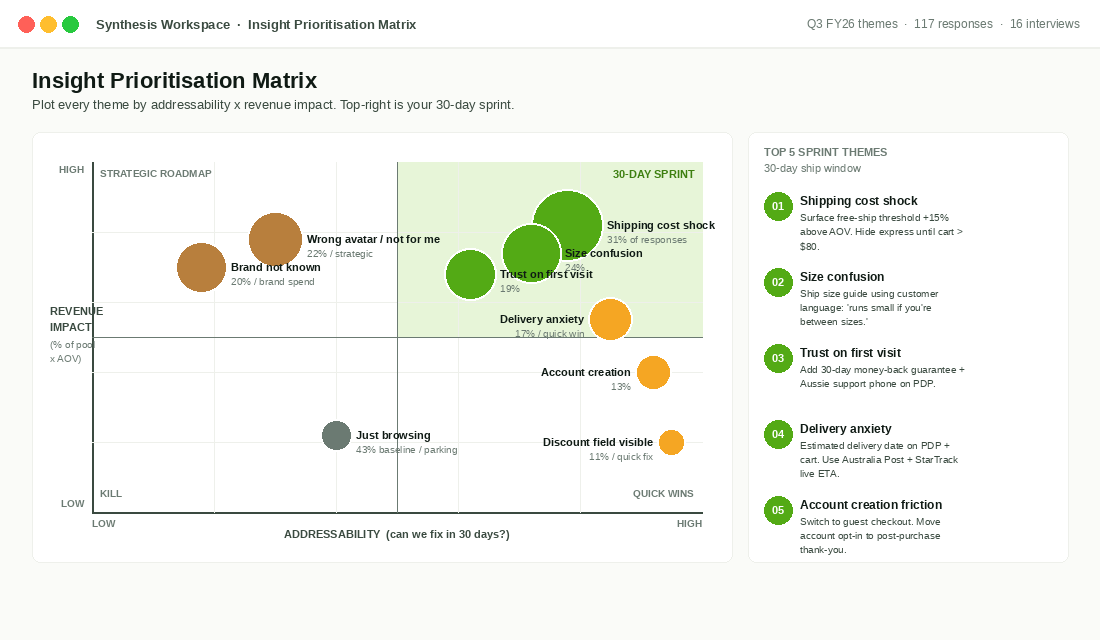
Write up the quarterly findings in a 1-page summary: top 5 themes, frequency count, representative customer quote, recommended action, and revenue-at-risk estimate. This becomes the agenda for the action sprint. Founders who skip the summary doc end up sitting on data that never ships into the store.
Phase 4: Act (3 Action Types, 30-Day Ship Window)
Research that does not ship is therapy. Phase 4 is the conversion of insight into store-level change. Every top-5 theme gets sorted into one of three action buckets and assigned a 30-day deadline.
- Action Type 1: Messaging changes. Rewrite PDP copy, ad creative, email subject lines, and onsite headlines using the exact phrases customers used in interviews. Update FAQ answers with the most common objections. Build one PDP block per top objection and addresses it head-on. Customer language outperforms copywriter language every single time.
- Action Type 2: Offer changes. If price came up repeatedly, test a $10 first-order welcome credit or a 3-pack bundle. If shipping came up, test a free-shipping threshold that sits 15 to 20% above current AOV. If trust came up, add a 30-day money-back guarantee with no return-shipping cost. These are not discount strategies. They are friction removals dressed as offers.
- Action Type 3: Funnel/UX changes. If checkout complexity is in the top 5, audit the form (delete fields, enable Shop Pay and Apple Pay, hide the discount field unless triggered). If size confusion shows up, ship a size guide that uses the language customers used to describe their sizing problem (“I was worried it would run small”). If delivery anxiety appears, surface an estimated delivery date on the PDP and the cart.
Ship in waves. Week 1: copy changes (zero engineering cost). Week 2: offer changes (Klaviyo flows, popups, banners). Week 3: UX changes (theme updates, app installs, checkout tweaks). Week 4: measurement and report-out. Compare conversion rate, AOV, and abandonment rate against the trailing 30 days. Three of every five changes will move the metric. The other two go in the kill file.
The Aussie Toolstack and Cost Stack
You can run this whole system on $0 in software for the first quarter. Hotjar Free covers exit surveys for low-traffic stores. Klaviyo’s free tier handles up to 250 contacts. Calendly Free, Otter Free, and Notion Free fill the rest. Once you scale past 5,000 contacts and 50,000 monthly sessions, the production stack looks like this:
- Survey capture: Hotjar ($39/mo basic, $99/mo Business) or Survicate ($49/mo Essential, $99/mo Business). Pick one, not both.
- Email outreach and lapsed flows: Klaviyo (priced per contact, but the email channel returns $36 to $40 per $1 spent for retail, so this is rarely the line item you cut).
- Interview booking: Calendly Standard ($16 AUD/mo) or TidyCal ($39 lifetime).
- Recording and transcription: Fathom Free, Otter Pro ($16.99/mo), or Fireflies Pro ($18/mo).
- Synthesis database: Airtable Free or Notion Free until you exceed the row limits.
Total stack cost: roughly $80 to $150 AUD per month at production scale. Compare that to a single month of paid media at $15k+ AUD and the ROI on the research is laughable. The biggest cost is the founder’s calendar, not the software.
The Compound Effect: Case Math on a $2M Aussie DTC Brand
Take a brand turning over $2M AUD/year. Average order value $95, conversion rate 2.1%, monthly sessions 150,000. Run the 4-phase system for one quarter and assume modest results: 3 of 5 shipped changes move the needle, lifting conversion from 2.1% to 2.45% (a 17% relative lift, well inside the Baymard benchmark of a 35% addressable conversion gain on checkout usability alone).
That single quarter adds roughly $24,500 AUD in monthly revenue. Annualised: $294,000 AUD. At an 18% contribution margin, that is $52,920 AUD in net new margin from one cycle of work. The win-back email flow to churned customers typically reactivates 15 to 25% of the lapsed pool inside 90 days, adding another $15k to $30k per quarter for a brand at this size. Add the qualitative wins from cleaner ad creative and tighter PDP copy and the number compounds further. We have seen members triple the published case studies inside two cycles.
The math also runs in the other direction. If you are not doing this work, you are losing the same $40k to $80k AUD per year, every year. It is just hidden in the abandonment rate where you cannot see it.
90-Day Rollout Plan
Most founders read a framework like this, nod, and never run it. To make sure you do not, here is the day-by-day rollout to commit to your calendar this week:
- Week 1: Install Hotjar or Survicate. Build the 4 capture surfaces. Connect Klaviyo flows. Open the Notion synthesis database with the tag schema (rational reason, emotional driver, frequency).
- Week 2-3: Let surveys run. Aim for 30 to 50 responses before triggering interview outreach. Refine question copy if response rate is below 5%.
- Week 4-6: Run the first 15 interviews. Pull respondents from the survey pool. Transcribe every call. Add quotes into the Notion database.
- Week 7-8: Synthesise. Build the frequency table, plot the 2-axis matrix, write the 1-page quarterly summary with the top 5 themes.
- Week 9-12: Ship the top 5 actions across the 3 action types. Measure conversion rate, AOV, and abandonment rate against the trailing 30 days. Report the result. Open the next quarter.
Win/loss research is not a one-quarter project. It is a permanent capability. Each cycle you compound the previous one because the themes start repeating and the fixes get cheaper to ship. Aussie brands like Bondi Sands, Frank Body, Showpo, and Who Gives A Crap all run versions of this discipline internally. It is not luck that they keep finding angles competitors miss. They are listening to the 96% you are not.
If you want help running the first cycle properly, this is one of the core systems we work on with members. Bring your data, we will help you set up the four surfaces, draft the interview script, and pressure-test the synthesis before you ship. See the Founder-Led Customer Interview Playbook for the buyer-side interview script that pairs with this one, the Voice of Customer 5-Channel System for the broader research stack, and the Post-Purchase Survey Playbook for the buyer-side attribution survey.
Inside eCommerce Circle, win/loss research is one of the core pillars we work on with every member. If you want a second opinion on yours, let’s talk.