You have built a Shopify store, you are getting sales, and things are ticking along. But every morning you open your laptop and stare at Shopify analytics, Google Analytics, your ad dashboards, your email platform — and you still feel like you have no idea what is actually going on. The data is everywhere, and the signal is buried in noise.
What’s in This Article
Most Shopify store owners are drowning in data but starving for insight. They check revenue daily (good), but they cannot tell you their customer acquisition cost, their average order frequency, or their contribution margin. They are flying a plane without an instrument panel — and wondering why they keep hitting turbulence.
The stores that scale past $500K and beyond all share one trait: they track the right numbers, in the right cadence, and make decisions based on trends rather than daily fluctuations. Here are the seven financial metrics that actually matter for your Shopify store — and how to track them without hiring a CFO.
1. Contribution Margin (Not Just Gross Margin)
Gross margin tells you how much you make after product costs. Contribution margin tells you how much you actually keep after all variable costs — product cost, shipping, payment processing fees, packaging, and marketplace fees. This is the number that matters because it tells you how much each order actually contributes to covering your fixed costs and generating profit.
Here is the formula: Contribution Margin = Revenue – COGS – Shipping Costs – Payment Processing – Packaging – Variable Marketplace Fees. For a healthy Shopify store, you want a contribution margin of 35-50%. If you are below 30%, your unit economics are broken and no amount of scaling will fix it.
Track this monthly at minimum. Most store owners are shocked when they calculate their true contribution margin for the first time — it is almost always lower than they expected. A store doing $80K per month in revenue with a 55% gross margin might only have a 38% contribution margin once all variable costs are included. That difference is the gap between perceived profit and real profit.
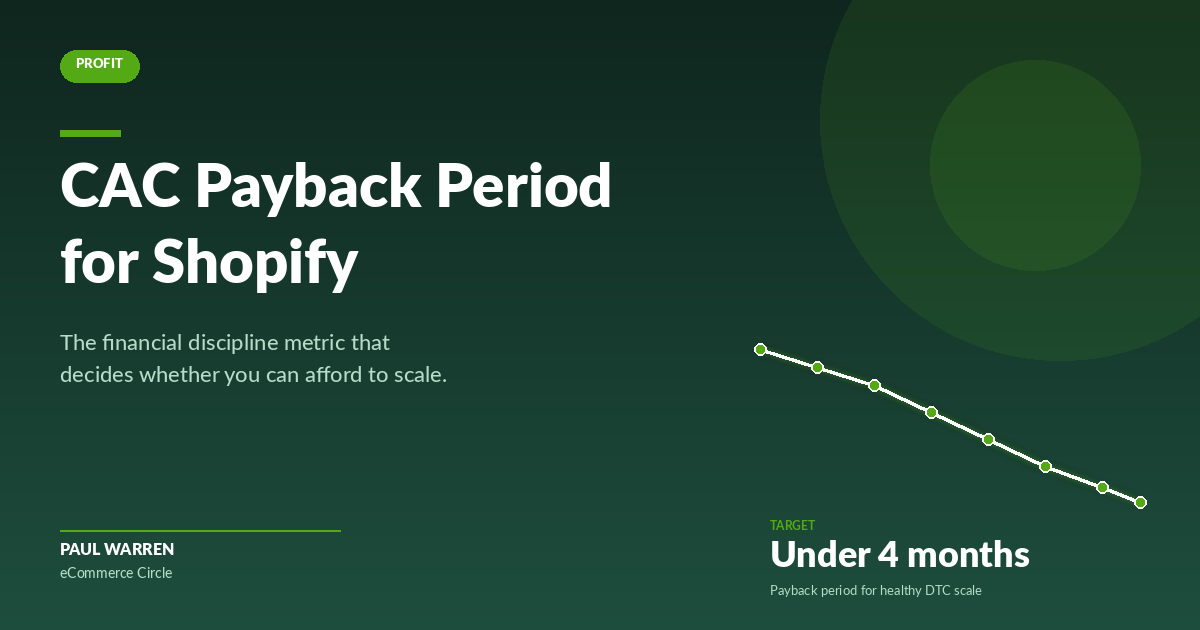
2. Customer Acquisition Cost (CAC) by Channel
Your blended CAC (total marketing spend divided by total new customers) is a useful starting point, but it hides the real story. You need to know your CAC by channel — Meta Ads, Google Ads, email, organic, influencer, and any other acquisition channel you are using.
Why? Because a $30 blended CAC might actually be a $45 Meta CAC, a $22 Google CAC, and a $0 organic CAC blended together. If you are planning to scale by increasing Meta spend, your true scaling CAC is $45, not $30. This distinction matters enormously for forecasting and budget allocation.
For most Australian Shopify stores, a healthy CAC is 20-30% of the first order value. If your average first order is $100, your CAC should be under $30. If it is consistently above that, you either have a CAC problem (targeting, creative, funnel efficiency) or a retention problem (you need repeat purchases to justify higher acquisition costs).
3. Customer Lifetime Value (LTV) — The 12-Month Version
LTV is the total revenue a customer generates over their relationship with your brand. The mistake most store owners make is using all-time LTV, which can be misleading for newer stores. Instead, calculate your 12-month LTV: the average revenue per customer in their first 12 months.
Here is a simple way to calculate it: take all customers who first purchased 12-18 months ago, and average their total spend over their first 12 months. For most Shopify stores, 12-month LTV is 1.5-2.5x the first order value. If your average first order is $80, a healthy 12-month LTV is $120-$200.
The golden ratio to watch is LTV:CAC. You want this to be at least 3:1 — meaning every dollar of acquisition spend generates at least three dollars in 12-month revenue. Below 2:1 is a warning sign. Above 4:1 means you are probably under-investing in growth and leaving money on the table.
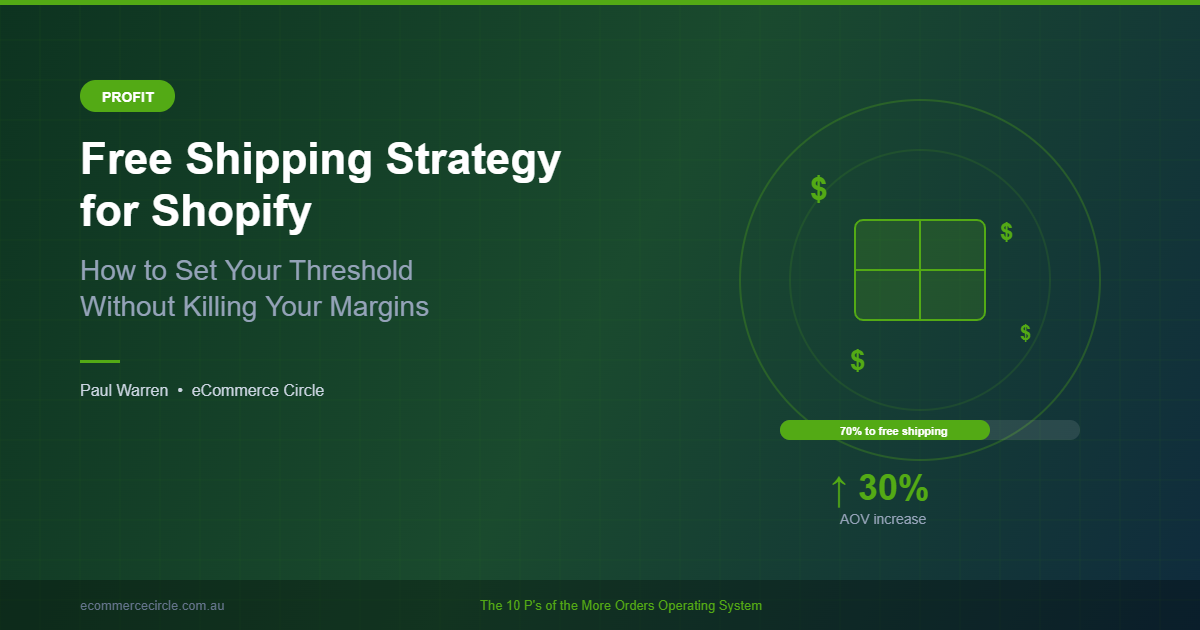
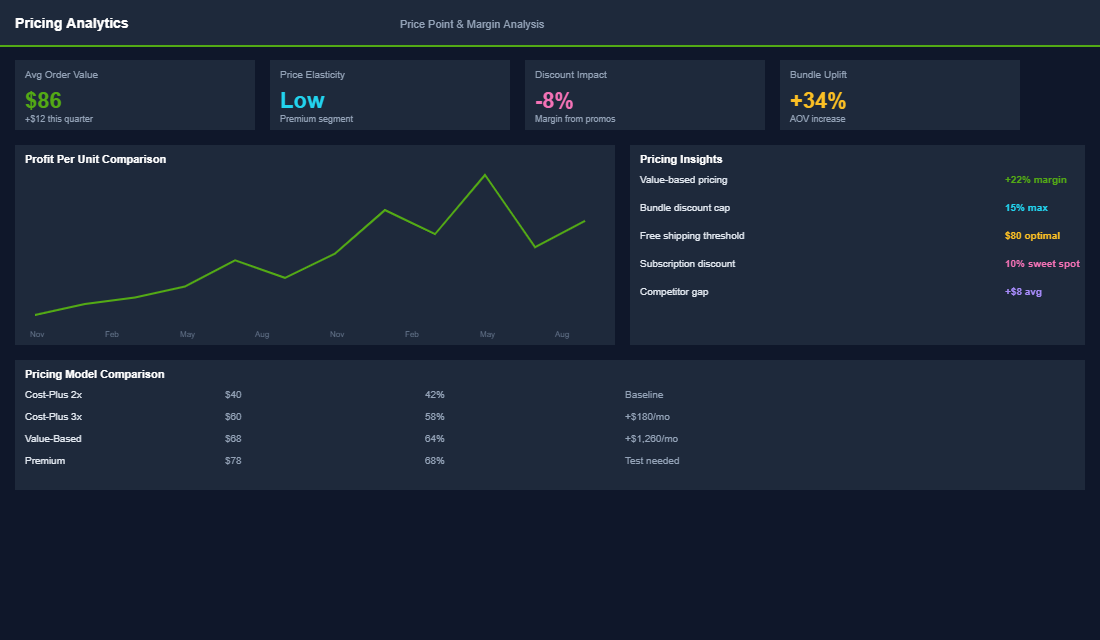
4. Average Order Value (AOV) and How to Grow It
AOV is the simplest lever you have for improving profitability. A 10% increase in AOV drops almost entirely to your bottom line because the customer already exists — you are just getting more from each transaction. The beauty is that increasing AOV does not require more traffic or more ad spend.
Track your AOV weekly and set a target that is 15-20% above your current baseline. Then implement specific tactics to hit it: upsells on the product page, cross-sells in the cart, free shipping thresholds set 20-30% above your current AOV, and bundled offers. For example, if your AOV is $85, set a free shipping threshold at $100-$110 AUD. Most customers will add another item to hit the threshold rather than pay for shipping.
Also track AOV by channel. Organic and email customers typically have 15-25% higher AOV than paid social customers. This affects your channel profitability calculations and should inform your budget allocation.
5. Cash Conversion Cycle (How Fast You Get Paid)
Cash flow kills more Shopify stores than profitability does. You can be profitable on paper and still run out of cash if your money is tied up in inventory for too long. The cash conversion cycle measures the gap between when you pay for inventory and when you receive payment from customers.
Cash Conversion Cycle = Days Inventory Outstanding + Days Sales Outstanding – Days Payable Outstanding. In plain English: how many days does your cash sit in inventory before it comes back to you as revenue? For a healthy Shopify store, aim for a cash conversion cycle under 60 days. Above 90 days means your cash is locked up too long, and you will need working capital to fund growth.
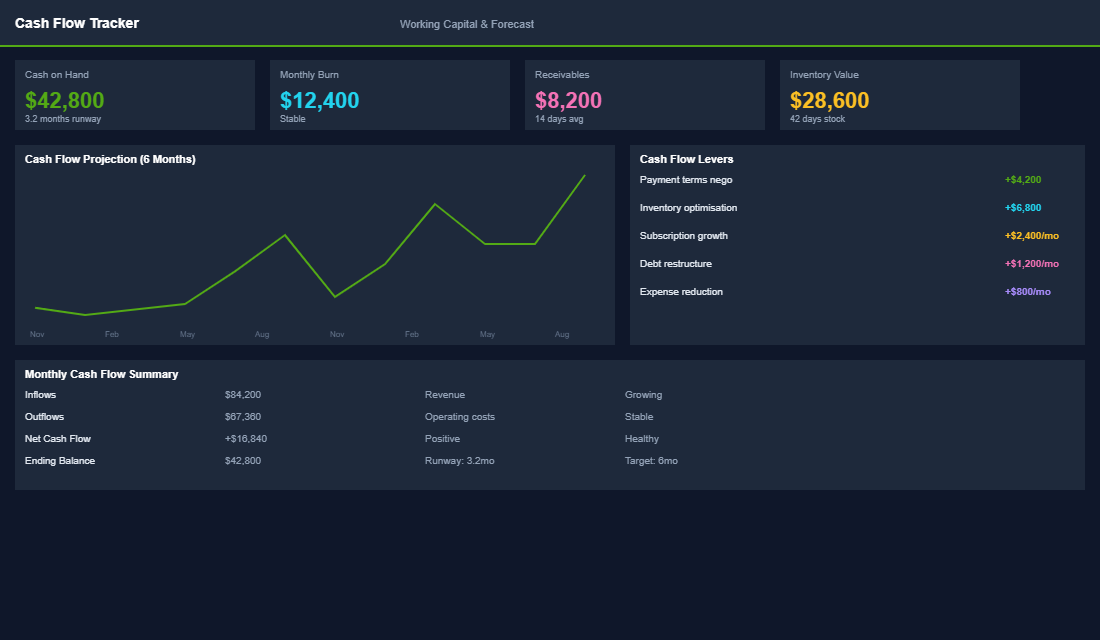
Practical ways to improve this: negotiate better payment terms with suppliers (net 30 instead of prepayment), reduce slow-moving inventory through flash sales or bundles, and forecast demand more accurately to avoid over-ordering. Some stores also use buy-now-pay-later tools like Afterpay to get paid upfront while the customer pays over time.
6. Return on Ad Spend (ROAS) — The Full Picture
ROAS is the metric every Shopify store owner watches, but most are reading it wrong. A 4x ROAS sounds great until you realise your contribution margin is 35% — meaning you only keep $1.40 of that $4 in revenue. After the $1 in ad spend, your profit per dollar spent is just $0.40.
The metric that actually matters is contribution-margin ROAS: (Revenue x Contribution Margin) / Ad Spend. If your contribution margin is 40% and your ROAS is 3x, your CM-ROAS is 1.2x — meaning every dollar of ad spend generates $1.20 in contribution margin. That is profitable, but barely.
For healthy scaling, target a CM-ROAS of 1.5x or higher. This gives you enough margin to cover fixed costs and generate profit. If your CM-ROAS is below 1.0x, you are losing money on every ad dollar spent, regardless of what your topline ROAS says.
7. Net Profit Margin (The Number That Actually Matters)
Revenue is vanity, profit is sanity. Your net profit margin is the final score — the percentage of revenue that remains after ALL costs: product, shipping, marketing, team, software, rent, insurance, everything. For ecommerce, a healthy net profit margin is 10-20%. Below 10% and you are vulnerable to any cost increase or revenue dip. Above 20% and you are likely under-investing in growth.
Track net profit monthly using a simple P&L. Most Shopify store owners do not have a clear P&L, and that is a problem. You do not need fancy accounting software — a well-structured spreadsheet that captures revenue, COGS, marketing spend, fixed costs, and variable costs will tell you exactly where your money is going and whether the business is actually making money.
One critical note: pay yourself a market-rate salary in your P&L, even if you do not actually take it. If your store is “profitable” only because you are working 60 hours a week for free, that is not a real business — it is a job with bad pay. Your net margin should be calculated after a reasonable salary for the work you do.
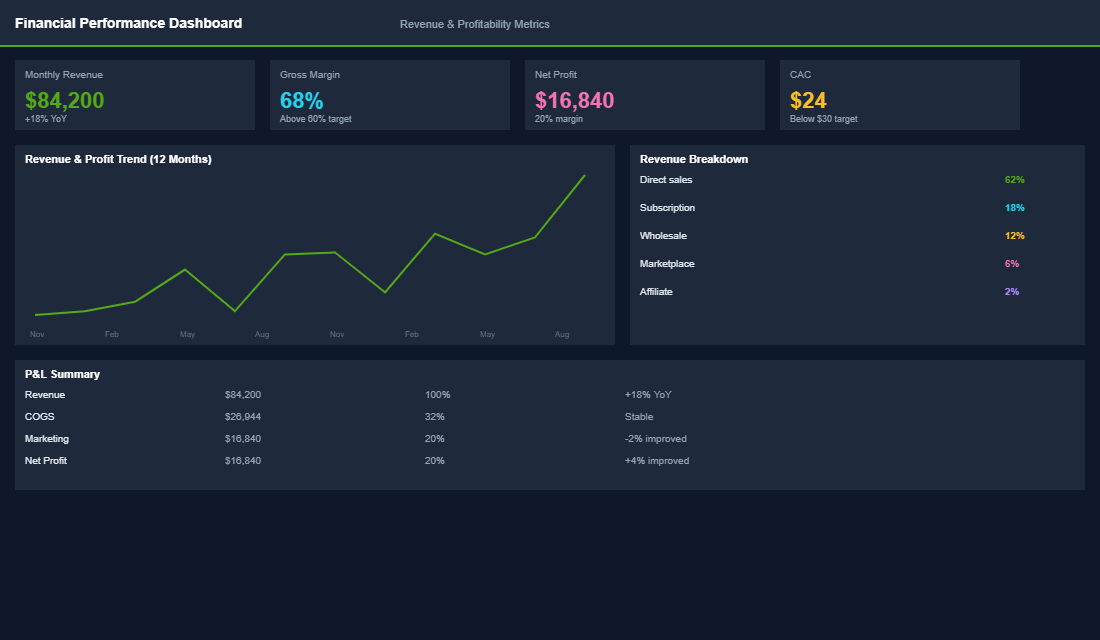
Putting It All Together: Your Financial Dashboard
These seven metrics tell a complete story about your business health. Contribution margin and AOV tell you about unit economics. CAC and LTV tell you about customer economics. Cash conversion cycle tells you about financial health. ROAS tells you about marketing efficiency. And net profit margin tells you the final score. Track them weekly or monthly, look for trends rather than day-to-day fluctuations, and use them to make decisions with confidence instead of anxiety.
Inside the eCommerce Circle, financial literacy for store owners falls under our Profit pillar — it is one of the first things we work on because everything else depends on knowing your numbers. If you are not sure where your margins stand or how to calculate these metrics for your specific store, that is exactly the kind of thing our coaching is built for. Knowing your numbers is not optional — it is the foundation everything else is built on.
What “Good” Looks Like: Aussie Shopify Benchmarks
Numbers without context are just noise. Before you panic about your CAC or celebrate your AOV, you need to know what good looks like for an Australian Shopify brand doing $500K to $5M a year. These ranges are not gospel — they shift by category, price point, and channel mix — but they give you a benchmark to compare against.
- Contribution Margin: 35-55% after COGS, shipping, payment fees, and pick-and-pack. Below 30% and you cannot afford to scale paid traffic.
- Blended CAC: $25-$60 AUD for sub-$100 AOV brands. Higher for considered-purchase categories (skincare, supplements, furniture).
- 12-Month LTV: 1.5x to 3x your AOV. A repeat rate under 20% in 12 months means you have a one-time purchase problem.
- AOV: Apparel $85-$140, supplements $70-$110, homewares $120-$220. Track yours against direct competitors, not industry averages.
- Net Profit Margin: 10-20% is healthy. Under 5% and you are running a charity. Over 25% usually means you are under-investing in growth.
- Cash Conversion Cycle: 30-60 days is normal. Anything over 90 days and you have a working capital problem disguised as a sales problem.
If you are tracking three or fewer of these metrics, you are guessing. If you are tracking all seven on a weekly rhythm, you are operating like a real business.
The Tools That Make This Tracking Actually Doable
The reason most store owners do not track these metrics is not laziness — it is friction. Shopify’s native reports only get you part of the way, and stitching together ad platforms, email, fulfilment costs, and refunds in a spreadsheet eats half your week. Here is the modern stack we recommend at eCommerce Circle for Aussie brands that want clean numbers without hiring a CFO.
- Lifetimely or Polar Analytics: Best-in-class for contribution margin, LTV cohorts, and blended CAC by channel. Lifetimely sits inside Shopify, Polar is a standalone dashboard.
- Triple Whale or Northbeam: If you spend more than $10K AUD a month on paid ads, you need post-iOS14 attribution that matches your real numbers. ROAS in-platform almost always overstates by 20-40%.
- Shopify Reports (Plus tier): Free if you are on Shopify Plus. Custom reports get you cohort analysis, contribution margin by SKU, and repeat purchase windows.
- Bench, Thriday, or your accountant’s Xero dashboard: For the true net profit margin once GST, super, software, and salaries are stripped out. The number that pays your mortgage.
- Google Sheets + a weekly cadence: The simplest tool of all. A one-page dashboard updated every Monday morning beats the most expensive platform if you never open it.
The Cadence That Actually Drives Decisions
Tracking the right metrics matters less than tracking them on the right rhythm. Check your CAC daily and you will chase noise. Check your LTV monthly and you will miss a churn problem before it bleeds you dry. Use this cadence as a starting point and adjust to your business.
- Daily (90 seconds): Revenue, orders, top-of-funnel traffic. Just to spot anomalies.
- Weekly (15 minutes, Monday morning): Contribution margin, AOV, blended CAC, ROAS by channel. This is your operating rhythm.
- Monthly (45 minutes, first week of the month): 12-month LTV, repeat purchase rate, channel mix shifts, net profit margin from last month’s accounts.
- Quarterly (half a day): Cohort analysis, cash conversion cycle, contribution margin by SKU and by collection. This is where you spot the products quietly killing your margin.
If you are not sure where to start, build the weekly view first. The brands that scale past $1M+ are not the ones with the prettiest dashboards — they are the ones who actually look at them every Monday. If you want a structured way to install this rhythm across the whole business, our Insights library covers the operating cadence in more depth, and the 30/60/90 onboarding framework shows how to embed it with a new operator in their first quarter.
Common Mistakes Aussie Founders Make With Their Numbers
- Counting GST in revenue: Your $1M “revenue” is $909K once GST is stripped. Track ex-GST or you will overestimate margins by 10%.
- Using in-platform ROAS as gospel: Meta’s reported ROAS is almost always 1.3-1.8x your blended truth. Triangulate with Triple Whale, GA4, and your bank account.
- Ignoring returns and chargebacks: A 4% return rate quietly eats 4% off your top-line. Build it into your contribution margin formula, do not pretend it does not exist.
- Treating shipping as a fixed cost: Free shipping on a $45 order to Perth from Sydney can destroy a $20 margin. Track shipping cost per order by zone.
- Confusing busyness for progress: Twenty new SKUs launched does not equal more profit. Often the opposite. Net profit margin is the only number that pays you.
Let’s Talk About Your Numbers
If you are reading this and quietly realising you do not know three of these numbers off the top of your head, you are not behind — you are normal. Most Shopify store owners doing $50K to $500K a month are flying with two or three instruments on the dashboard. The brands that scale past that all install a financial rhythm. That is the work we do with operators inside the eCommerce Circle coaching program.