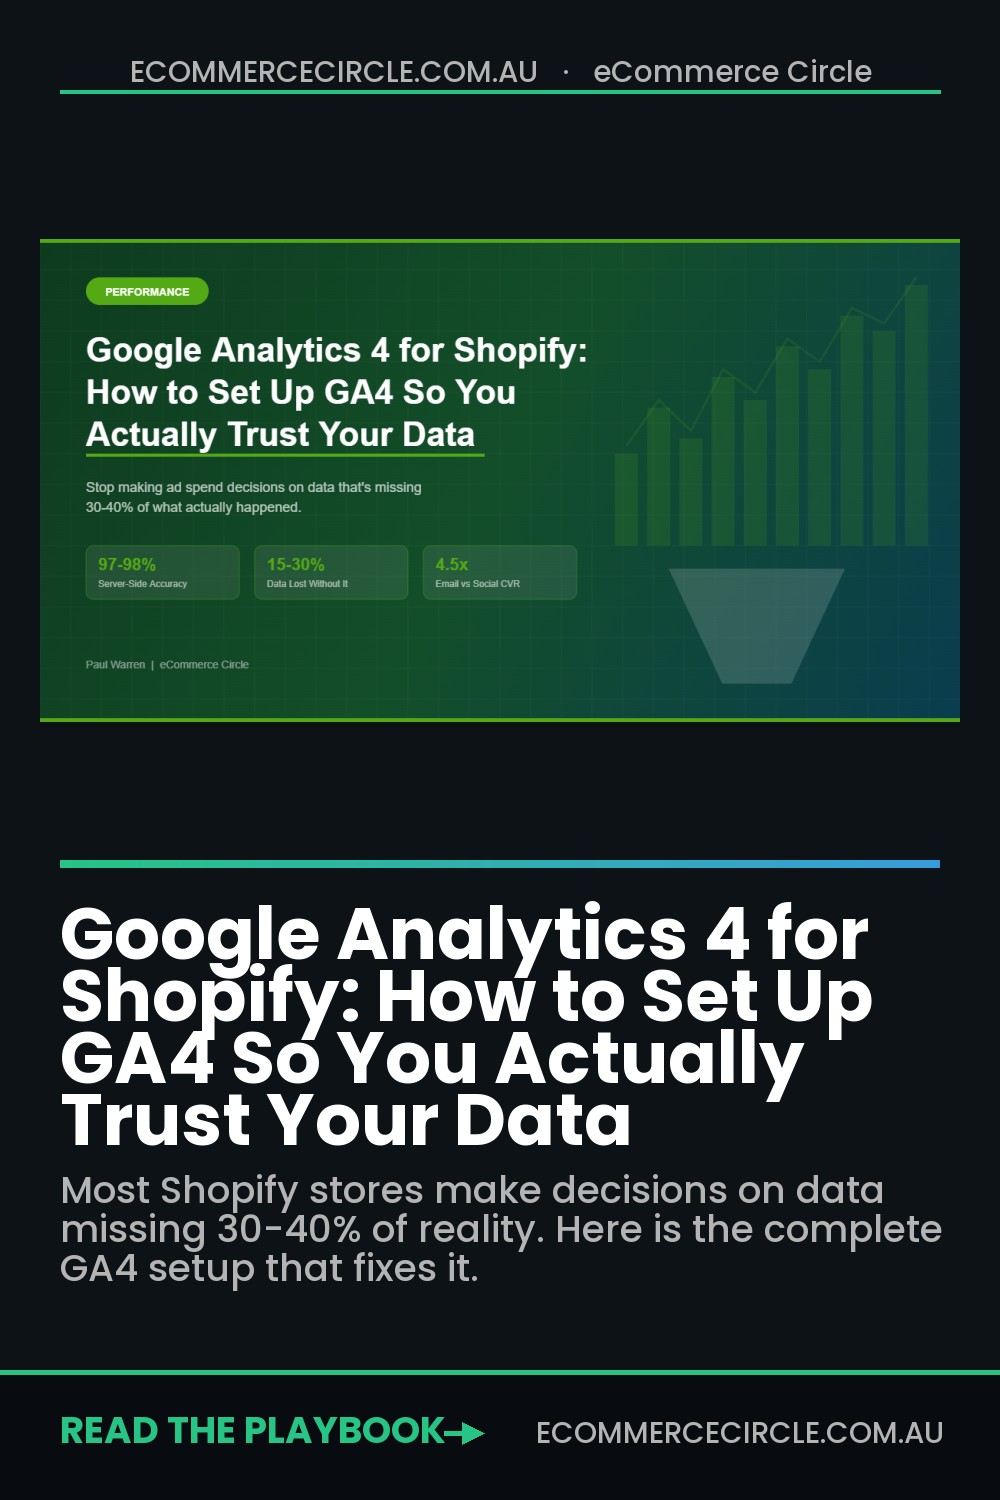
Here’s a hard truth most Shopify store owners don’t want to hear: the data you’re using to make marketing decisions is probably wrong. Not “slightly off” wrong. We’re talking 30-40% of your actual customer behaviour going completely untracked.
What’s in This Article
You’re spending thousands on Meta Ads, Google Shopping, email campaigns, and influencer deals — then logging into a Google Analytics 4 dashboard that’s missing a third of what happened. You see a channel “isn’t working,” so you cut the budget. Except it was working. Your tracking just couldn’t see it.
The stores that consistently grow past seven figures aren’t just running better ads. They’ve built a measurement foundation they can actually trust. They know which channels drive revenue, where customers drop off, and what’s worth scaling — because their GA4 setup tells the truth. This guide will show you exactly how to get there.
Why Your Default GA4 Setup Is Lying to You
When you install GA4 on Shopify through the Google & YouTube channel app, you get basic tracking out of the box. Page views, some ecommerce events, maybe a purchase event if you’re lucky. Most store owners stop there and assume they’re covered.
They’re not. Standard client-side GA4 tracking gets blocked by ad blockers, browser privacy settings, and iOS restrictions in 15-30% of all sessions. That means for every 100 customers who buy from you, GA4 might only record 70-85 of those purchases. The rest vanish into thin air.
On top of that, GA4 and Shopify count sessions, users, and conversions differently. Shopify typically reports conversion rates 0.1-0.3 percentage points higher than GA4 because of how each platform handles things like abandoned cart recovery sessions. The result? Two dashboards telling you two different stories about the same store.
Even when GA4 is tracking correctly, the default setup misses critical ecommerce events. Payment methods like Shop Pay, PayPal, and Apple Pay bypass the standard checkout flow, which means GA4 never fires the purchase event. Your best-converting payment options are literally invisible to your analytics.
If you’ve ever looked at your GA4 revenue and thought “that doesn’t match Shopify at all” — this is why. And you can fix it.
Step 1: Get the Foundation Right (The 20-Minute Setup)
Before you touch anything advanced, make sure the basics aren’t broken. Most tracking problems stem from a rushed initial setup, not from needing fancy tools.
Install via the Google & YouTube channel app. Go to your Shopify admin, navigate to Sales Channels, and add the Google & YouTube app if you haven’t already. Connect your Google account, then link your GA4 property. This takes about 10 minutes and gives you automatic tracking for core ecommerce events: view_item, add_to_cart, begin_checkout, and purchase.
Match your time zones and currency. This sounds obvious, but it’s one of the most common causes of data discrepancies. Your Shopify store, GA4 property, and Google Ads account should all be set to the same time zone (use AEST or AEDT for Australian stores) and the same currency (AUD). Mismatched settings create phantom discrepancies that’ll drive you mad trying to debug.
Verify events are actually firing. Open your store in an incognito browser, navigate to a product page, add something to cart, and start checkout. While you do this, open GA4’s Realtime report (Reports → Realtime). You should see page_view, view_item, add_to_cart, and begin_checkout events appearing within seconds. If any of these are missing, your tracking is broken before you’ve even started.
Enable Enhanced Measurement. In GA4, go to Admin → Data Streams → your web stream → Enhanced Measurement. Make sure scrolls, outbound clicks, site search, and file downloads are all toggled on. These give you behavioural data that reveals how customers actually interact with your store — not just what they buy.
This basic setup gets you to roughly 85-92% tracking accuracy compared to Shopify’s numbers. That’s the architectural baseline — GA4 will always underreport slightly because of how client-side tracking works. But there’s a massive difference between 85% accuracy and the 60-70% accuracy most broken setups deliver.
Step 2: Configure the Ecommerce Events That Actually Matter
GA4 tracks dozens of ecommerce events, but you don’t need all of them. Focus on the ones that map directly to your purchase funnel and give you actionable data.
The core funnel events you need firing correctly are:
- view_item. Fires when someone lands on a product page. This is the top of your funnel. If this number is high but add_to_cart is low, your product pages need work — pricing, imagery, copy, or social proof.
- add_to_cart. The first buying signal. A healthy add-to-cart rate for Shopify stores sits between 4-8% of sessions. Below 3%? Your product pages aren’t compelling enough. Above 10%? You’re doing something right — figure out what and double down.
- begin_checkout. This is where intent gets serious. The drop-off between add_to_cart and begin_checkout reveals whether your cart experience creates friction — unexpected shipping costs, missing trust signals, or confusing cart layouts.
- add_payment_info. Often overlooked, but critical. A big drop between begin_checkout and add_payment_info usually means your checkout form is too long, you’re not offering enough payment options, or your trust signals disappear at checkout.
- purchase. The money event. Every purchase should fire with correct revenue, tax, shipping, currency (AUD), and transaction ID. If this event is missing items or showing $0 revenue, nothing else in your analytics matters.
Since Shopify completed its migration away from checkout.liquid in early 2026, GA4 now tracks checkout events more reliably through Shopify’s Customer Events API. If you set up your tracking before 2026 and haven’t revisited it, now is the time. The old methods may be firing duplicate or incomplete events.
Pro tip: go to GA4’s DebugView (Admin → DebugView) while you run through a test purchase. You’ll see every event fire in real time, along with all the parameters attached. This is the fastest way to spot missing data, incorrect values, or duplicate events.
Step 3: Build Your Funnel Exploration (Find Where the Money Leaks)
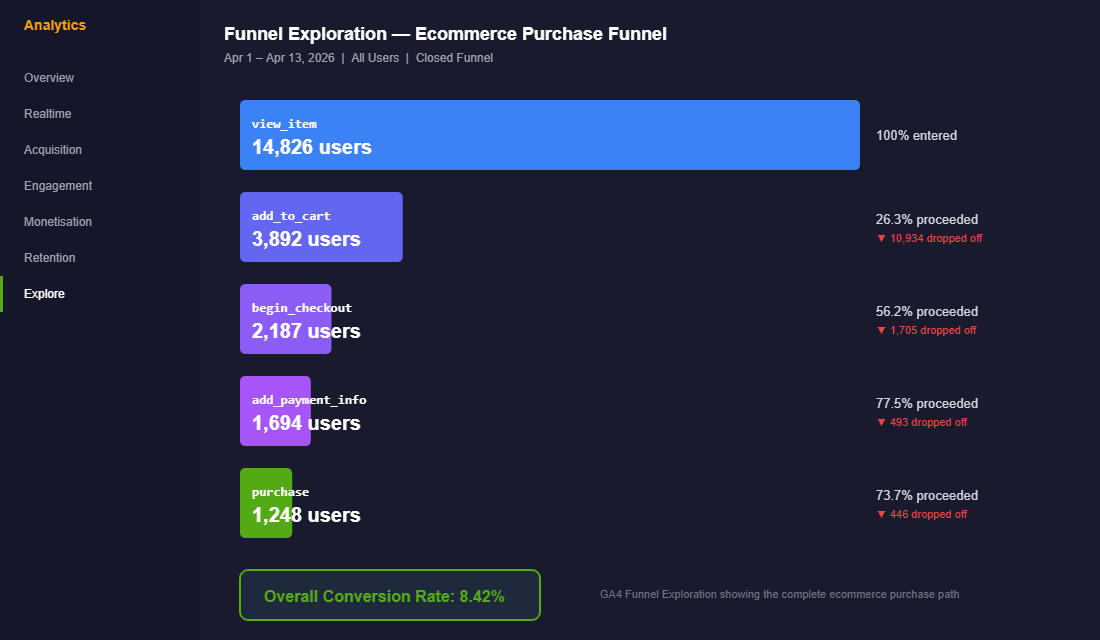
This is where GA4 earns its keep. Shopify’s built-in analytics show you top-level numbers, but GA4’s Funnel Exploration tool lets you see exactly where customers drop off — and why.
Here’s how to set up your core ecommerce funnel in under five minutes:
Go to Explore → Funnel Exploration. Add these steps in order: view_item → add_to_cart → begin_checkout → add_payment_info → purchase. Set it as a “closed” funnel (users must enter at step one) for the most accurate view of your conversion path.
Now add a breakdown dimension. Start with Device category. This will instantly show you whether your mobile and desktop funnels behave differently. Globally, desktop converts at roughly 3.2% while mobile sits around 1.8% — a 78% performance gap. If your gap is wider than that, your mobile experience needs attention. (If you want to go deeper on mobile UX, we’ve covered that in detail in our Mobile UX for Shopify guide.)
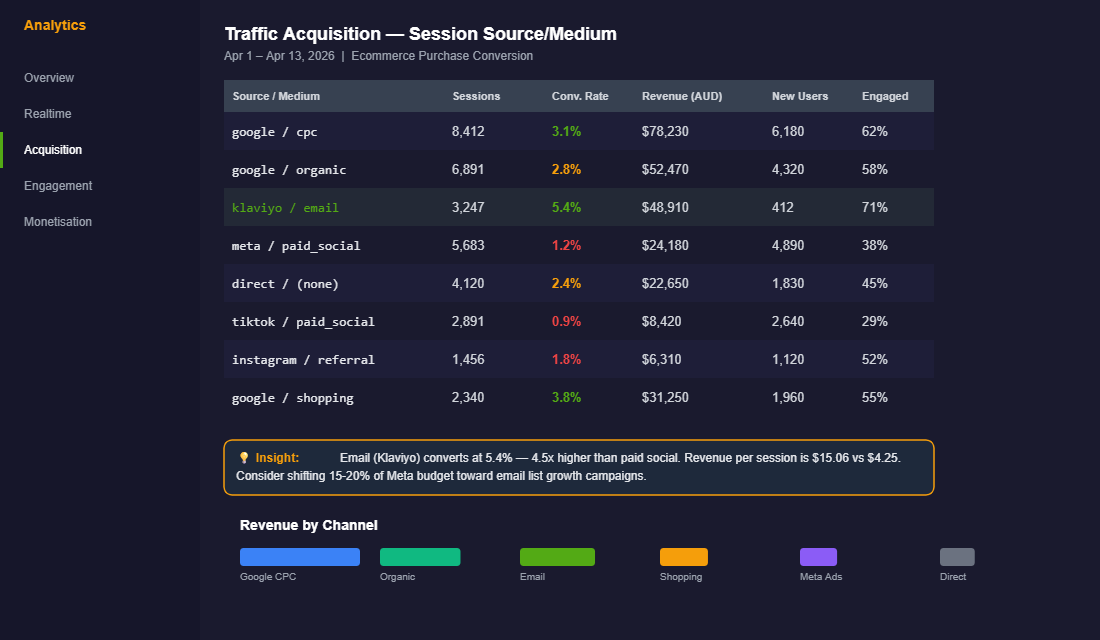
Next, try breaking down by Session source/medium. This reveals which traffic sources have the healthiest funnels and which leak customers. You might discover that your Google Shopping traffic adds to cart at 8% but only 2% reach checkout — suggesting a price or shipping expectation mismatch. Or that email traffic converts at 3.8% while paid social converts at just 0.9%, confirming that your email list is 4x more valuable per session.
The power of funnel explorations isn’t just seeing drop-off rates. It’s comparing them across segments. When you spot that mobile users drop off 40% more at checkout than desktop users, you’ve found a specific problem to fix — not just a vague “conversion is low” complaint.
Step 4: Set Up Custom Audiences for Smarter Remarketing
Most Shopify store owners create their remarketing audiences in Meta or Google Ads directly. That works, but GA4 audiences are more powerful because they’re based on actual on-site behaviour — not just pixel data that’s increasingly blocked.
Here are four GA4 audiences every Shopify store should build:
- Cart Abandoners (High Intent). Users who triggered
begin_checkoutbut notpurchasein the last 7 days. These people were moments away from buying. A targeted ad or email sequence addressing common objections (shipping costs, returns policy, payment security) can recover 10-15% of these abandoned checkouts. - Product Viewers Who Didn’t Add to Cart. Users who triggered
view_itemat least twice but neveradd_to_cart. They’re interested but not convinced. Retarget them with social proof — reviews, UGC, or “as seen on” content. - Repeat Purchasers. Users with two or more
purchaseevents. These are your best customers. Build a lookalike audience from this group in Google Ads, and you’ll find new customers who behave similarly. - High-Value Browsers. Users who’ve visited 5+ pages in a single session but haven’t purchased. They’re deep in research mode. A well-timed offer or live chat prompt can tip them over the edge.
When you link your GA4 property to Google Ads (Admin → Product Links → Google Ads), these audiences automatically sync. You’re building remarketing lists from first-party behavioural data — which is far more reliable than cookie-based pixel tracking in a privacy-first world.
If you want to understand which channels are actually driving these audiences, check out our guide on ecommerce marketing attribution — it pairs perfectly with this GA4 setup.
Step 5: Close the Data Gap With Server-Side Tracking
If you’re serious about data accuracy — and you should be if you’re spending more than $3,000/month on ads — server-side tracking is the single biggest upgrade you can make.
Here’s the problem with standard (client-side) tracking: it relies on JavaScript running in the customer’s browser. Ad blockers, privacy extensions, Safari’s Intelligent Tracking Prevention, and iOS App Tracking Transparency all interfere with this. The result is 15-30% of your purchase data going missing.
Server-side tracking solves this by sending event data directly from your server to GA4, bypassing the browser entirely. Instead of hoping the customer’s browser cooperates, your Shopify store sends the data itself — every add-to-cart, every checkout, every purchase.
The accuracy improvement is dramatic. Standard client-side setups achieve 80-90% tracking accuracy. A properly configured server-side setup pushes that to 97-98%. For a store doing $50,000/month in revenue, that’s the difference between GA4 showing $40,000-$45,000 and showing $48,500-$49,000. You’re suddenly making decisions on data that reflects reality.
How to implement it on Shopify:
The easiest path for most Shopify stores is an app like Analyzify or Littledata. Both integrate with Shopify’s server-side APIs and send ecommerce events directly to GA4 without depending on client-side scripts. Setup takes 30-60 minutes, and both offer guided onboarding.
If you want more control, you can set up a Google Tag Manager Server Container hosted on a service like Stape.io (from around $20 USD/month). This gives you full control over which events get sent, how they’re processed, and where they go. It’s more technical but gives you a tracking infrastructure that scales.
Server-side tracking also captures revenue from payment methods that bypass your standard checkout — Shop Pay, PayPal Express, Apple Pay, and buy-now-pay-later options like Afterpay. These transactions often go completely untracked in client-side setups. With server-side tracking, you capture 100% of revenue regardless of how the customer pays.
Step 6: Build the Three Reports You’ll Actually Use Every Week
GA4 has hundreds of reports. You need three. These are the ones that drive weekly decisions for the Shopify stores we work with inside eCommerce Circle.
Report 1: Traffic Acquisition by Source/Medium. Go to Reports → Acquisition → Traffic Acquisition. Sort by “Session source/medium” and look at three columns: Sessions, Conversion Rate, and Revenue. This tells you which channels bring traffic that actually buys — not just traffic that visits. If a channel drives high sessions but near-zero revenue, it’s eating budget without contributing. If a channel has low sessions but a 5%+ conversion rate, it’s underinvested.
Report 2: Landing Page Performance. Go to Reports → Engagement → Landing Page. This shows you which pages people arrive on and what happens next. Your top landing pages should convert above your store average. If your homepage is your top landing page but converts below 1%, your homepage isn’t doing its job — it needs stronger CTAs, better product showcasing, or clearer navigation. (Our article on the 12 metrics every Shopify dashboard needs covers which benchmarks to aim for.)
Report 3: Funnel Exploration by Device. The funnel you built in Step 3, filtered by device. Check this weekly. Your mobile funnel will almost always underperform desktop, but the gap should be narrowing over time as you optimise. If the gap is widening, something broke — a recent theme update, a new app causing layout issues, or a checkout change that hurts mobile users.
Save these as custom reports in GA4 (click the “Save” icon in Explorations, or customise the standard reports via the pencil icon). Checking these three reports takes 15 minutes a week and gives you more actionable insight than spending an hour scrolling through Shopify’s analytics dashboard.
Step 7: Handle Consent Mode (Don’t Get Caught Out)
If you sell to customers in the EU, EEA, or UK — or if you simply want to future-proof your setup — you need Google Consent Mode v2 configured. As of 2025, Google requires Consent Mode v2 for all GA4 and Google Ads tags. Without it, your ads targeting and conversion tracking in those regions breaks completely.
For Australian stores, GDPR doesn’t apply directly to domestic sales. But if you ship internationally — and many Aussie brands do — you need consent management. Even domestically, the Australian Privacy Act reforms are tightening, and getting ahead of compliance now saves headaches later.
The simplest approach for Shopify: install a consent management app like Consentmo or Pandectes, which integrates with GA4’s Consent Mode v2. When a visitor declines tracking, GA4 switches to modelled conversions — using machine learning to estimate what it can’t directly measure. It’s not perfect, but it’s far better than a blank gap in your data.
Configure this once and forget about it. But don’t skip it. A single GDPR complaint from an EU customer can cost more than your entire year of marketing spend.
The Compound Effect: How Accurate Data Changes Everything
Each step in this guide fixes one piece of a broken measurement system. But the real power shows up when they work together.
With accurate ecommerce events, you know exactly where your funnel leaks. With server-side tracking, you trust the numbers enough to act on them. With funnel explorations, you spot problems by device and channel before they cost you thousands. With custom audiences, you retarget based on real behaviour instead of guesswork.
Here’s what that looks like in practice: you notice in your weekly funnel report that mobile add-to-cart rates dropped 2% after a theme update. You check your heatmaps (we’ve covered how to use heatmaps for Shopify if you need a refresher) and find that the “Add to Cart” button shifted below the fold on smaller screens. You fix it in 20 minutes. That 2% recovery on mobile — where 65% of your traffic comes from — might be worth $3,000-$5,000/month in recovered revenue.
Without trusted data, you’d never spot the drop. Without the funnel breakdown by device, you wouldn’t know it was a mobile-specific issue. Without accurate tracking, you might have blamed the wrong channel and cut budget instead of fixing a button.
That’s the compound effect of getting analytics right. It doesn’t just give you better reports. It gives you better decisions. And better decisions compound faster than any single marketing tactic.
Your GA4 Setup Checklist
Use this as your implementation roadmap. Tick these off in order and you’ll have a GA4 setup that most agencies would charge $2,000+ to build:
- ☐ Install GA4 via the Google & YouTube channel app on Shopify
- ☐ Match time zone (AEST/AEDT) and currency (AUD) across Shopify, GA4, and Google Ads
- ☐ Verify all five core ecommerce events fire correctly using GA4 Realtime and DebugView
- ☐ Enable Enhanced Measurement (scrolls, site search, outbound clicks)
- ☐ Build a closed funnel exploration: view_item → add_to_cart → begin_checkout → add_payment_info → purchase
- ☐ Add device and source/medium breakdowns to your funnel
- ☐ Create four custom audiences (cart abandoners, product viewers, repeat purchasers, high-value browsers)
- ☐ Link GA4 to Google Ads for automatic audience syncing
- ☐ Install server-side tracking (Analyzify, Littledata, or custom GTM server container)
- ☐ Configure Consent Mode v2 if selling internationally
- ☐ Save your three weekly reports and schedule 15 minutes every Monday to review them
This isn’t a “nice to have” project. Every week you run ads without accurate tracking, you’re making budget decisions on incomplete data. The stores that grow fastest are the ones that measure correctly first, then optimise based on truth.
Ready to Build a Measurement System You Can Trust?
Inside the eCommerce Circle, analytics and measurement is one of the first pillars we fix with every member. Because you can’t optimise what you can’t measure — and most stores are measuring wrong. We walk you through the exact setup covered here, help you interpret your data, and build weekly reporting rhythms that turn numbers into growth decisions.
If you want help getting your Shopify store’s analytics sorted once and for all — Let’s Talk.