Every Aussie Shopify founder I talk to can rattle off three numbers from memory. Conversion rate. Average order value. ROAS. And every one of those numbers, on its own, is lying to them.
What’s in This Article
You can have a 4% conversion rate and lose money. You can have a $180 AOV and lose money. You can have a 4x ROAS and still watch your bank balance shrink every Friday. We see it constantly inside eCommerce Circle. Founders optimising the wrong metric, then wondering why the dashboard looks healthy and the cash flow looks like a horror movie.
The fix is one number. Profit-Per-Visitor, or PPV. It is the metric that fuses every input that matters into a single dollar figure that tells you exactly what the next visitor walking onto your store is worth in profit. Shopify’s own benchmark research shows the platform median sits around $1.21 in profit per visitor, and the gap between top performers and the bottom half is wider than for any other metric on the dashboard. That gap is where your business lives.
Why CR, AOV And ROAS Lie To You In Isolation
Three quick scenarios from real audits we have run this year. Every one of them is a brand that thought their headline metric was the win.
The 4% conversion rate that broke the bank. A skincare brand running a 25% sitewide promo for six weeks. CR jumped from 2.6% to 4.1%. The owner was thrilled. We pulled the contribution margin and it had collapsed from 38% to 21%. Profit per visitor dropped from $1.18 to $0.93. They were converting more, earning less, and burning through stock at a rate they could not replenish.
The $180 AOV that ate the calendar. A homewares brand chasing AOV with a free-gift threshold at $200. AOV climbed from $138 to $179. The free gift cost $14 to source and $9 to ship. CR dropped from 2.8% to 2.1% because shoppers were anchoring on the threshold and bouncing. PPV slid from $1.42 to $1.08. They had built a beautiful AOV chart and a worse business.
The 4.2x ROAS hiding a hole. A supplements brand crowing about a 4.2x return on ad spend. We rebuilt the picture from the ground up using the same logic we cover in our piece on Marketing Efficiency Ratio replacing ROAS, and the true contribution after returns, COGS, fulfilment and discount stacking was negative on first order. The ROAS was platform-attributed garbage. PPV from paid traffic was $0.41 against an acquisition cost of $0.78. Every paid visitor was costing them 37 cents.
None of those founders were stupid. They were tracking the wrong number. PPV is the only metric that catches all three patterns at once.
The PPV Formula (And Why It Beats Everything Else)
PPV is brutally simple. Two ways to express it, both useful.
The headline form:
PPV = Total Contribution Profit / Total Sessions
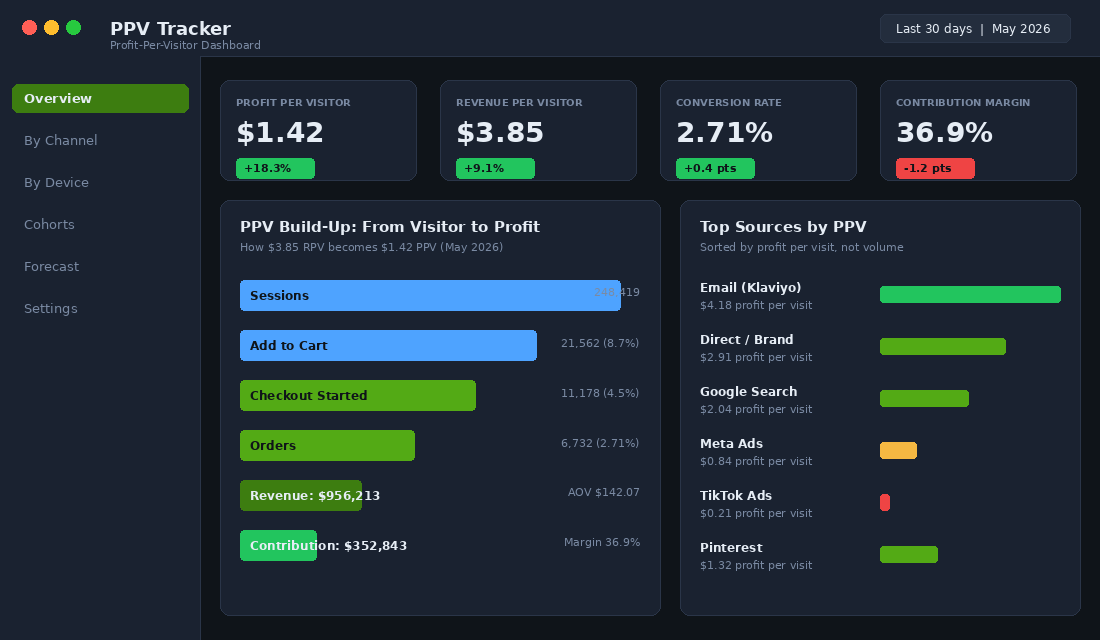
Take the contribution profit your store generated in a window (revenue minus product cost, fulfilment, payment fees, discount value, and returns) and divide by sessions. That is the dollar figure each visit produced. If you ran 100,000 sessions and netted $142,000 in contribution, your PPV is $1.42.
The diagnostic form:
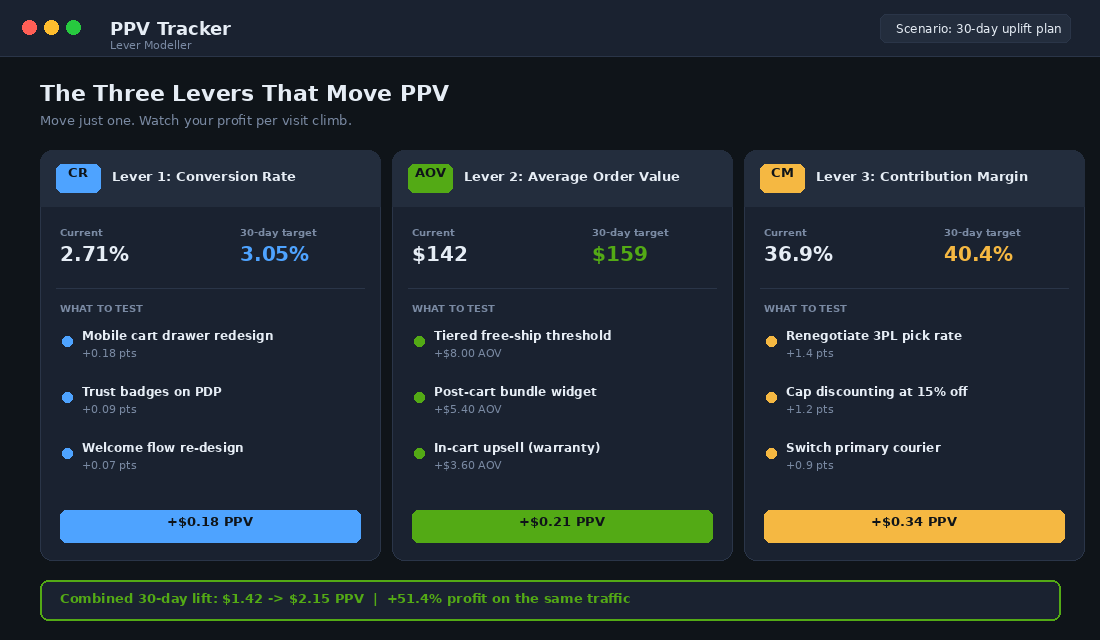
PPV = Conversion Rate × Average Order Value × Contribution Margin %
So 2.71% CR × $142 AOV × 36.9% margin = $1.42 PPV. Identical answer. The diagnostic form is more useful day to day because it tells you which lever to pull when the number moves. PPV down? You know the only three places to look.
Step 1: Calculate Your Baseline PPV In Shopify (15 Minutes)
You do not need a fancy app to start. You need three numbers and a calculator. Pull a clean 30-day window from Shopify Analytics.
- Sessions. Shopify Admin > Analytics > Reports > Online store sessions. Note the total.
- Net sales after returns. Same Reports area. Net sales = gross sales minus discounts minus returns. Do not use gross.
- Contribution costs. Add up COGS, transaction fees (typically 1.7% to 2.4% with Shopify Payments in AUD), shipping cost paid to the carrier, pick and pack cost from your 3PL, and any per-order app fees. Subtract this total from net sales to get contribution profit.
Divide contribution profit by sessions. That is your baseline PPV. Now compare against the bands we see across the hundreds of Aussie Shopify founders we work with each year:
- Below $0.50: The store is unprofitable on session economics. Either traffic quality is poor or the funnel is leaking everywhere. Stop scaling spend until you fix it.
- $0.50 to $1.20: Early to growing brand range. Workable, fragile. One promo gone wrong erases the month.
- $1.20 to $2.00: Healthy. You can afford to acquire customers. You have margin to absorb mistakes.
- $2.00 to $3.50: Strong. This is where you can outbid competitors on paid channels and still print profit.
- Above $3.50: Elite. Usually a brand with serious retention, premium AOV, or a defensible niche.
For context, Shopify-wide median PPV sits at roughly $1.21 according to platform-level benchmarks, and the average has climbed from $0.36 in 2015 to $1.87 in 2025. The brands moving that average up did not get there by chasing CR alone. They built the full PPV stack.
Step 2: The Three Levers That Move PPV (And Where Most Brands Get It Wrong)
Once you have your baseline, you have three places to push. Conversion rate. AOV. Contribution margin. Each lever moves PPV multiplicatively, which means small wins compound fast.
Lever 1: Conversion Rate Without The Discount Crutch
The Shopify platform median CR is around 1.4%. The top 20% of stores convert at 3.1% to 3.5%. The top 10% sit above 4.7%. Those numbers are useful only if you compare within your AOV band, because stores under $60 AOV convert at roughly 4.6% median while stores above $200 AOV sit closer to 0.95%. Higher considered purchase, lower CR. Always.
Where to push without burning margin:
- Mobile cart drawer. 70% of Aussie Shopify traffic is mobile. A clean drawer with progress bar, free-ship threshold, and a single relevant upsell typically lifts CR by 0.15 to 0.30 points. Our deep dive on this lives in the cart drawer 8-element framework.
- Trust signals on the PDP. Reviews block above the fold, Afterpay or Klarna badge near the price, dispatch promise, returns policy in plain English. The Aussie shopper in particular is sceptical, and missing Afterpay alone has been shown to soften conversion in this market.
- Welcome flow. Klaviyo benchmark data has welcome series converting 5 to 10% of new subscribers. If yours is under 5%, the offer is the problem. Tighter offer, faster send, fewer steps.
Common mistake: stacking discounts to lift CR. Yes, the bar moves. PPV usually does not. A 25% sitewide promo that lifts CR by 0.5 points but cuts margin by 8 points is a net loss on the metric that counts.
Lever 2: AOV Engineering That Lifts Profit Per Visitor, Not Just Order Size
The DTC Shopify median AOV sits at $85 to $95. AOV across verticals ranges from $45 in food and beverage to $436+ in jewellery and high-end electronics. There is no “good” AOV in the abstract. There is only “AOV that lifts PPV in your category.”
The plays that work:
- Tiered free-ship threshold. Set the threshold 25 to 35% above current AOV. Show progress to the threshold in the cart drawer. Most brands lift AOV by 6 to 12% within 30 days.
- Post-cart bundle. A 3-product bundle widget shown after add-to-cart. We see 8 to 14% attach rates with the right bundle composition.
- In-cart upsells with utility. Warranty, faster shipping, gift wrap. Margin on these is usually 70%+. They lift AOV without dragging margin down.
- Quantity break above the second unit. “Buy 2, save 10%. Buy 3, save 18%.” Anchors the first purchase to a 2-unit purchase. Works particularly well in consumables.
What to avoid: free-gift thresholds that cost you more than the AOV uplift. Run the maths before you ship. If the gift costs $14 and only adds $9 of marginal contribution, you have just bought yourself a worse business.
Lever 3: Contribution Margin Protection (The Lever Most Brands Ignore)
Margin is the lever with the highest PPV elasticity, and the one most operators leave alone because it sits in operations rather than marketing. A 1 percentage point margin lift on a $142 AOV at 2.71% CR moves PPV by roughly $0.04. Three points moves it by $0.12. Compare that to the work needed to lift CR by 0.1 points and the picture is obvious.
Where to find the margin:
- 3PL pick and pack rates. Re-tender annually. We have seen Aussie 3PL costs swing 15 to 30% between providers for the same SKU profile.
- Discount discipline. Cap promotional depth at 15% sitewide unless it is BFCM. Use bundle pricing or threshold gifts to feel like a deal without giving away margin.
- Carrier mix. Use Sendle, Aramex, Australia Post and Couriers Please by zone. A zone-based carrier matrix can save $1.20 to $2.40 per parcel.
- Free-ship threshold tuned to true cost. If your average parcel cost is $11 and your free-ship threshold sits at $80, you are giving away 13.7% of every threshold order to the carrier. Lift the threshold, not the discount.
For more on the margin maths, our piece on contribution margin and how to scale profitably walks through the full waterfall.
Step 3: PPV By Channel (The Allocation Table That Replaces ROAS)
Here is where PPV gets really powerful. Calculate it per channel. Now you have an allocation table that tells you exactly where the next dollar of media spend should go.
Most brands rank channels by revenue. Wrong frame. A channel can drive a quarter of your revenue while bleeding contribution. Rank by PPV instead and the picture changes overnight.
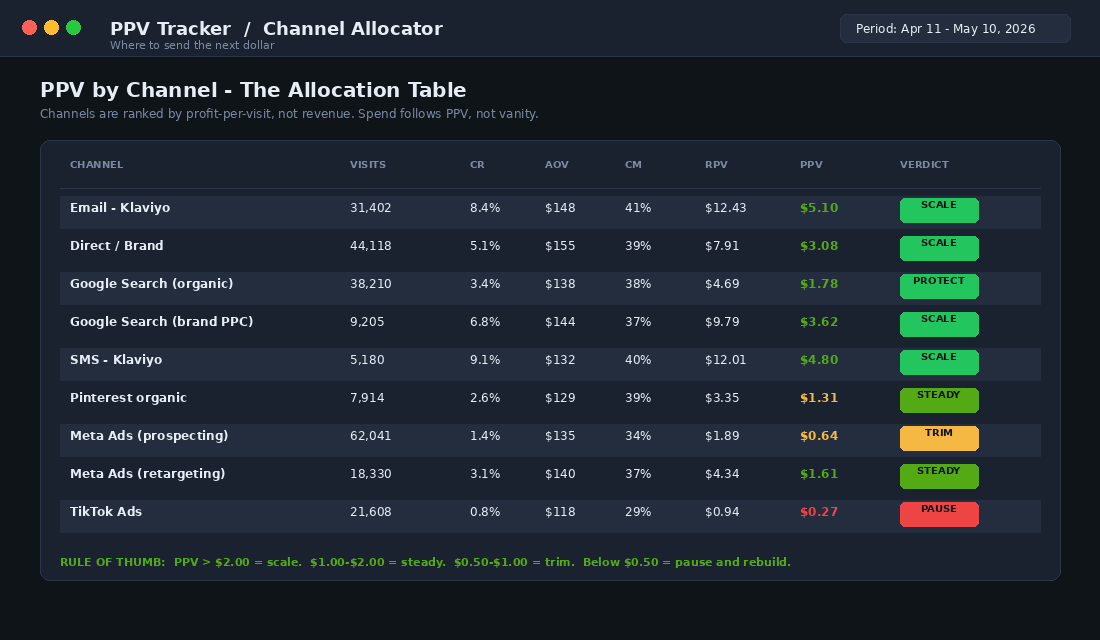
How to read the table. Email and SMS via Klaviyo sit at $5.10 and $4.80 PPV. Direct and brand search sit at $3.08 and $3.62. Cold Meta prospecting sits at $0.64. TikTok at $0.27. Total revenue from Meta is bigger than total revenue from email, but the profit produced per visit is one-eighth.
The reallocation rules we apply with members:
- PPV above $2.00: Scale. Find the budget ceiling. This is where you grow profitably.
- PPV $1.00 to $2.00: Steady state. Maintain spend, A/B test creative or audiences quarterly.
- PPV $0.50 to $1.00: Trim. Cut the worst-performing campaigns and reallocate to scaled channels.
- PPV below $0.50: Pause and rebuild. Either the creative is wrong, the audience is wrong, or the channel does not fit your offer. Either way, do not feed it more money.
Tool To Set Up: Triple Whale Or A DIY Sheet (Both Work)
You do not need to buy a tool to track PPV. A clean Google Sheet, refreshed weekly, will do the job for the first 12 months. We pre-build this for new Connect members. The columns are simple:
- Channel name
- Sessions (from Shopify or GA4 by source)
- Conversion rate (orders / sessions)
- AOV (channel revenue / orders)
- Contribution margin % (your blended margin, refined per channel if you have the data)
- RPV (AOV × CR)
- PPV (RPV × CM%)
- Verdict (Scale / Steady / Trim / Pause)
If you want it automated, Triple Whale, Polar Analytics, and TrueProfit will all calculate a version of PPV natively once you connect Shopify, your ad platforms, and your COGS. Triple Whale’s “NC-PPV” (new customer profit-per-visit) is essentially the same metric, sliced for first-time buyers. Pricing in AUD sits roughly between $159 and $499 a month depending on revenue band, so most growing brands run the sheet for free until they pass $200k a month and the labour cost outweighs the tool cost.
Setup steps for the sheet version:
- Pull the last 30 days of sessions and orders by source from Shopify (Reports > Sessions by traffic source).
- Pull channel revenue from each ad platform plus organic. Reconcile to Shopify Analytics for source-of-truth orders, not platform-claimed orders.
- Calculate blended contribution margin from your last full month P&L. Use that as the channel default until you can refine it.
- Apply RPV and PPV formulas in the sheet.
- Add a Verdict column with the four bands above.
- Refresh every Monday morning before your weekly numbers meeting.
The Compound Effect: Why Tiny PPV Lifts Crush Vanity Metrics
Here is what makes PPV so powerful. The three levers compound. They do not add. Move CR by 12%, AOV by 12%, and margin by 12%, and PPV does not move 36%. It moves 40.5% (1.12 cubed). On the same traffic.
Run the maths on a brand doing 250,000 sessions a month at $1.42 PPV. That is $355,000 in monthly contribution. A 30% PPV lift to $1.85 produces $462,500. A $107,500 a month uplift, $1.29M annualised, with zero additional traffic and no extra ad spend. That is what these levers do when you stop optimising the wrong number.
Compare that to the equivalent ad spend lift. To produce $107,500 of new contribution at a 2.5x MER on the existing PPV, you would need to spend an extra $115,000 a month. Same outcome, much bigger risk, much worse cash flow.
This is also why the metric matters more than ever in the current environment. The average new customer in DTC loses brands roughly $29 on first order across categories. If your acquisition is unprofitable, your only paths to a profitable business are repeat purchase and PPV uplift. PPV is the lever you can pull this week. Repeat takes months.
A Real Australian Example: How A Homewares Brand Doubled PPV In 90 Days
One of the brands inside the Connect program runs a mid-range homewares range out of Melbourne, doing roughly $180k a month at the start of the year. Baseline PPV in February was $0.94. CR sat at 1.9%, AOV $128, margin 38.7%. Workable, fragile.
Three changes over 90 days, run sequentially so we could attribute cleanly:
- March: Cart drawer rebuild plus reviews block above the fold on top 20 PDPs. CR moved from 1.9% to 2.4%. PPV: $1.19.
- April: Free-ship threshold raised from $80 to $110, two-tier bundle widget added on hero category. AOV moved from $128 to $147. PPV: $1.46.
- May: 3PL re-tender saved 18% on pick rate, sitewide promo cap moved from “as needed” to a hard 15% rule outside campaign weeks. Margin moved from 38.7% to 42.1%. PPV: $1.93.
End-of-quarter PPV: $1.93, up 105% from baseline. Same traffic. Roughly $190k of additional contribution profit over the quarter. Zero new spend on top of existing media budget.
This is what disciplined PPV optimisation looks like. Three levers. One quarter. Compound effect.
The Weekly PPV Scorecard (Steal This Template)
Use this scorecard in your weekly numbers meeting. Five rows, refreshed every Monday from last week’s data.
- Sessions (week vs prior 4-week avg): Spotting traffic shifts before they bite.
- Conversion rate (week vs target): If down, audit cart drawer, PDP, and welcome flow first.
- AOV (week vs target): If down, check threshold attainment rate and bundle attach rate.
- Contribution margin % (week vs target): If down, run a discount audit and a fulfilment cost check.
- PPV (the headline): The number that proves whether the week was real or vanity.
Add a sixth row once you trust the data: PPV by channel, with the verdict column. That is the column that drives next week’s media decisions. Drop your PPV scorecard into a one-page Notion or Google Doc. Print it. Stick it on the wall. Do not let any decision get made in a marketing meeting that is not graded against this number.
For context on which other dashboards belong next to this one, our piece on the 12 metrics every Shopify dashboard should track sits PPV in the broader operating rhythm.
Where Most Brands Get PPV Wrong (Avoid These Three Traps)
Three patterns we see consistently when we audit brands attempting PPV tracking on their own.
Trap one: using gross margin instead of contribution margin. Gross margin includes only COGS. Contribution margin includes COGS, fulfilment, payment fees, and discount value. The first number flatters you. The second number is the truth. Use the truth.
Trap two: using gross sales instead of net sales. Returns matter. Discounts matter. Net sales is the only line that ties to your bank account. Anyone running a returns rate above 8% (apparel, footwear, jewellery) needs net not gross or the PPV figure will be 10 to 18% inflated.
Trap three: using Shopify-attributed channel revenue. Platform-claimed orders inflate paid PPV by 30 to 60% because of duplicate attribution. Use Shopify’s Sales by traffic source as the source of truth. Yes, your Meta dashboard will lie to you. That is the point.
PPV And The Bigger Picture: How It Connects To Your Operating System
PPV is the headline metric for the Performance pillar inside the More Orders Operating System. It sits alongside MER (the spend efficiency metric) and contribution margin (the profitability metric). Together those three numbers are the only diagnostic dashboard a CEO needs in a weekly numbers meeting. Everything else is detail.
The reason we anchor everything on PPV is that it cannot be gamed. You can game CR with discounts. You can game AOV with thresholds. You can game ROAS with branded retargeting. You cannot game PPV. Either the visit produced profit or it did not. The number tells the truth.
Run it for one quarter and you will start making different decisions. Quieter promotions. Tighter media reallocation. More spend on owned channels. Cleaner thresholds. Fewer hero campaigns that look great in the deck and bleed in the bank account.
Your 7-Day PPV Setup Plan
- Day 1: Pull 30 days of sessions, net sales, and contribution costs. Calculate blended PPV.
- Day 2: Build the channel allocation sheet. Get PPV per source.
- Day 3: Identify your one biggest CR opportunity. Brief it to the team.
- Day 4: Run the AOV maths on your free-ship threshold. Adjust if the gap is over 35% above current AOV.
- Day 5: Audit your last 30 days of discount activity. Cap the next 30 days at 15% sitewide unless it is a planned campaign.
- Day 6: Set up the weekly scorecard in Notion or Google Sheets. Schedule a 30-minute Monday review.
- Day 7: Brief the team on the Verdict column. Move budget from any channel sitting below $0.50 PPV.
Profit Per Visitor by Channel: 2026 Benchmarks for Aussie Shopify Brands
Once you start measuring PPV at the channel level, the spending decisions get much sharper. Here are the AUD-blended PPV numbers we see across well-run Aussie Shopify stores in 2026, mid-tier brands ($30K-$300K/month revenue):
- Branded Google Search: PPV $4.20-$8.10 — almost always your highest PPV channel. If it is not, your brand demand is leaking or your branded campaigns are misconfigured.
- Email (Klaviyo): PPV $2.80-$6.40 — close second to branded search. The cost per visit is near zero, so almost all visit value flows to profit.
- Organic / SEO: PPV $1.90-$4.80 — variable by niche, but every $1 of PPV here is gold because the cost is near zero ongoing.
- SMS: PPV $3.40-$7.20 — small audience, high intent. Costs about 8-12c per send so net PPV is strong.
- Meta Ads (cold): PPV $0.40-$1.20 — make or break. If you are below $0.70 on cold, you are probably burning cash to grow ROAS.
- Meta Ads (retargeting): PPV $1.80-$4.20 — should beat cold by 3-4x. If not, the funnel is broken upstream.
- TikTok Ads: PPV $0.30-$0.90 — viral upside, but average PPV trails Meta. Lean in only when the brand-build justifies the lower per-visit value.
- Google Shopping: PPV $1.40-$3.20 — solid middle of the pack. Feed quality is the biggest swing factor.
Use these as a baseline, not gospel. The big move: rank every channel you spend on by PPV, then cut the bottom 20% and reinvest in the top quartile. We have seen Aussie founders reveal $30K-$80K/year of contribution profit doing exactly this — no new tactics, just reallocating against what already works.
PPV Benchmarks: What “Good” Looks Like for Aussie Shopify Brands
A single PPV number is useless until you have something to compare it against. Here are the bands we see across the 100-plus Aussie Shopify stores we work with each year, by maturity and category. Use them as a sanity check, not a target.
Sub-$500K revenue stores. PPV typically sits between AUD $0.30 and $0.90. Anything below $0.30 usually means you are buying low-intent traffic (poorly targeted Meta prospecting, broad Google generic terms, untracked influencer fluff). Anything above $0.90 at this stage usually means the offer is hot but the volume is too small to be a real business yet — you need to push traffic, not optimise margin.
$500K to $2M revenue stores. Healthy PPV sits between AUD $0.80 and $1.80, depending on AOV. A high-AOV brand (over $150) should be closer to $1.50; a sub-$60 AOV brand will sit closer to $0.80. If yours is below $0.50 at this revenue band, you have a margin leak — almost always either a discounting habit, a free-shipping threshold set too low, or a paid channel that is converting but losing money on every sale.
$2M-plus stores. Top quartile PPV is AUD $2.00 to $4.50. By this scale, your traffic mix should be 40 to 60% non-paid (organic, email, SMS, referral, brand search) and your owned-channel PPV should be 3 to 5x your paid PPV. If you have not built that owned-channel flywheel by $2M, your growth has a profitability ceiling waiting to hit you.
What to track alongside PPV each week. PPV by channel (Meta, Google, email, organic, direct), PPV by landing-page template, PPV by first-time vs returning visitor, and 90-day rolling PPV trend. Put these on a single 1-page weekly dashboard — we cover the full structure of that operating cadence in our monthly business review playbook — and the metric stops being abstract and starts driving real decisions.
Why PPV Replaces ROAS for Brands Scaling Past M
ROAS lies. Specifically, ROAS at the platform level (Meta says 3.2x, Google says 4.1x) is almost always inflated by attribution overlap and view-through windows. PPV is built on three things you can actually measure: real visitors (GA4 sessions), real orders (Shopify), and real margin (your contribution math). It does not care which platform claims credit.
This is also why PPV pairs naturally with Marketing Efficiency Ratio (MER) as your two scaling metrics. MER tells you whether the total marketing engine is healthy at the brand level. PPV tells you where, inside that engine, every visit converts most profitably. Together they are the operating dashboard that lets Aussie Shopify founders scale past $1M without flying blind.
Inside eCommerce Circle, PPV is the metric every Connect member tracks weekly. It is the single best indicator of whether the work happening across marketing, merchandising, and operations is actually building a more profitable business or just a busier one. If you want a second opinion on yours, let’s talk.