You are scaling Meta and Google. ROAS is hovering somewhere between 2 and 3. MER looks fine on paper. Your accountant calls and asks why the bank account is shrinking while revenue is growing. You stare at the dashboard for a minute and realise you cannot answer the question. That gap, the gap between what your ad reporting says and what your bank balance actually does, is almost always a CAC payback problem.
What’s in This Article
Most Aussie Shopify founders are flying blind on payback period. They optimise toward ROAS or MER, then wonder why scaling feels like running on a treadmill that keeps speeding up. Ecommerce CAC has climbed 222% in the last eight years. Meta CPMs in beauty, apparel and supplements are up 30 to 40% year over year. Google CPCs on commercial keywords are up 15 to 20%. The cost of a new customer is rising faster than most stores can recover it, and that is a cash flow problem, not a marketing problem.
This is the playbook we use inside eCommerce Circle to pull the focus off ROAS and onto the one metric that decides whether your store grows or quietly bleeds out. You will see how to measure CAC payback properly, how to diagnose it by channel, the 3 signals that tell you when to scale, hold or pull back, the 5 levers that compress payback fastest, and the weekly dashboard that keeps it visible. Real numbers, Aussie context, no fluff.
Why CAC Payback Period Is the Metric That Replaces ROAS as Your Scaling North Star
ROAS tells you the revenue you generated divided by the ad spend. It says nothing about cost of goods, shipping, packaging, payment fees, returns, or how long the customer takes to repurchase. A 2.5x ROAS on a 25% margin product is a real cash loss the moment you account for COGS and operational cost. A 3x ROAS on a 65% margin subscription product is a money printer. The number on the dashboard hides which one you are running.
MER (Marketing Efficiency Ratio) is a step closer to the truth because it blends paid spend with total revenue, but it still does not answer the cash question. The cash question is simple: how many days, weeks, or months does it take for a new customer to generate enough profit to pay back what you spent acquiring them? That number, expressed in months, is CAC payback period. Sub-3 months and you are running a printer. 3 to 6 months and you have headroom. 6 to 12 months and you need outside capital or extreme retention to survive. Past 12 months without funding and you are already cooked, you just have not seen the bank balance yet.
The reason Aussie founders feel cash poor while their revenue is growing is almost always this. They are scaling top-line on a payback period that is too long for their working capital, and inventory plus paid spend is eating the float faster than customers can repurchase. Fix payback period and you fix the cash flow problem. Pair it with the MER framework and you have the full picture: MER for efficiency, payback for cash velocity.
The CAC Payback Formula (And the 4 Inputs Most Aussie Stores Get Wrong)
The formula is honestly not the hard part. The discipline is in the inputs. Most stores plug in soft numbers and get an answer that lies to them.
Core formula:
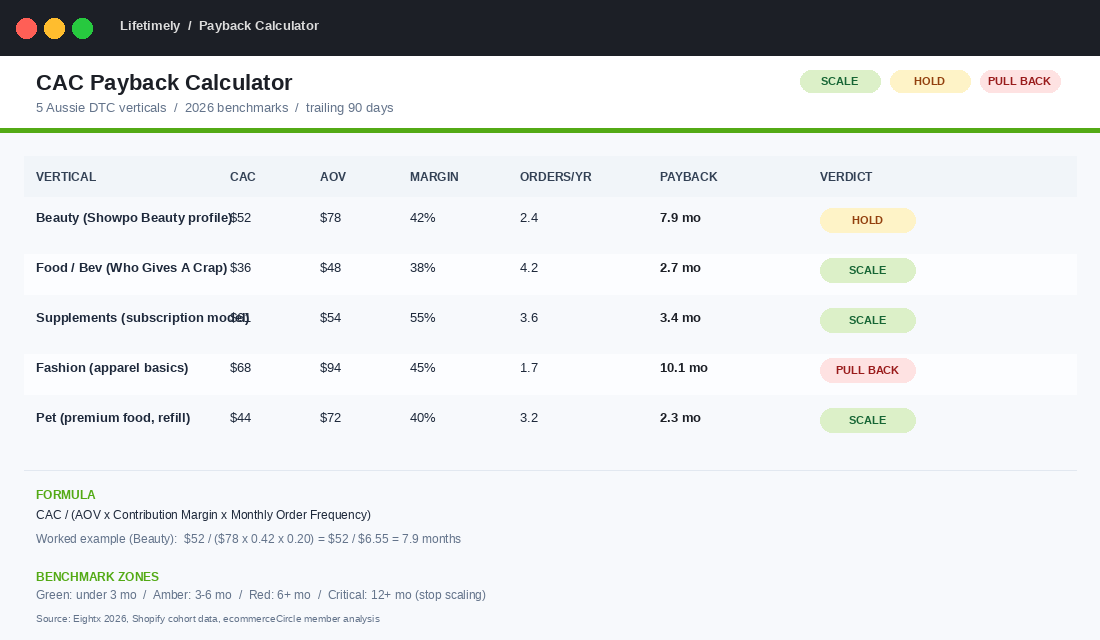
- CAC Payback Period (months) = CAC / (AOV x Contribution Margin x Monthly Order Frequency)
Worked example for an Aussie beauty brand: CAC $52, AOV $78, contribution margin 42% (after COGS, payment fees, packaging, shipping subsidy), 2.4 orders per year per customer in the first 12 months (or 0.20 per month). Monthly profit per customer = $78 x 0.42 x 0.20 = $6.55. Payback period = $52 / $6.55 = 7.9 months.
The 4 inputs that destroy accuracy if you fudge them:
- CAC. Total paid acquisition spend divided by new customers acquired (not orders, not sessions, not subscribers). If you spent $24,000 on Meta and Google last month and added 462 new customers, your blended CAC is $51.95. Many founders divide spend by orders, which inflates CAC because returning customers buy through ads too. Use new customers only.
- Contribution margin. Gross margin minus variable cost to fulfil. COGS, payment processing, packaging, freight subsidies, returns provision, app fees that scale with orders. Not your accountant’s gross profit, which excludes the messy real costs. Pull this from a contribution margin audit before you trust the payback number.
- Order frequency. The number of orders an average new customer places in their first 12 months. Pull this from Shopify cohort reports. Industry average sits around 27 to 28% repeat purchase rate, which means most new customers order 1.3 to 1.5 times in year one. Subscription and consumables run much higher (2.5 to 4 orders per year). Furniture and one-off categories run lower (1.1 to 1.2).
- AOV by acquisition channel. Meta customers spend differently to Google Shopping customers. Email signups have a different AOV again. Use blended AOV for the headline number, channel-specific AOV when you are diagnosing.
Get those 4 inputs accurate and your payback period stops being a vanity metric and starts being a cash flow forecast. Wave them off and you will keep scaling spend on the assumption that ROAS solves cash flow. It does not.
Stage 1: Measure Your True CAC Payback Period (and Where You Sit on the Benchmark Curve)
Before you can decide what to do, you need to know where you stand. Run the formula on the last 90 days. Then check your number against the 2026 vertical benchmarks. These are the ranges that separate sustainable DTC from “scaling toward a wall”.
- Food and beverage. 1 to 3 months. Consumables repurchase fast and category margins are tight, so payback compresses naturally.
- Beauty. 2 to 4 months. Replenishment cycles plus higher AOV give beauty brands one of the strongest payback curves in DTC.
- Pet. 2 to 4 months. Same dynamics as beauty, often with subscription boost.
- Supplements. 3 to 6 months. Higher CAC because the category is paid-media-saturated, but subscription rescues payback.
- Fashion and apparel. 3 to 6 months. AOV is high, but repeat rates are softer (20 to 30% second-order rate).
- Electronics and homewares. 6 to 12+ months. Big-ticket, infrequent repurchase. These brands need a serious second-order or accessory engine to survive.
The decision matrix that follows from your number:
- Under 3 months payback. You are running a money printer. Reinvest every spare dollar into top-funnel acquisition. Cash conversion is fast enough that growth funds itself.
- 3 to 6 months payback. Healthy zone. You can scale, but you need to plan working capital because inventory and ad spend are still ahead of cash inflow.
- 6 to 12 months payback. Caution zone. You need strong retention, a credit line, or external capital to scale safely. Most bootstrapped Aussie brands die here.
- 12+ months payback. Stop scaling. Fix unit economics first. More spend will accelerate the cash burn, not fix it.
Plot yourself honestly. If you are a beauty brand at 6 months payback, you are off-benchmark and need to compress. If you are a furniture brand at 9 months payback, you might be on-benchmark and need to focus on second-order economics instead.
Stage 2: Diagnose Channel-Level Payback (Where the Cash Is Actually Leaking)
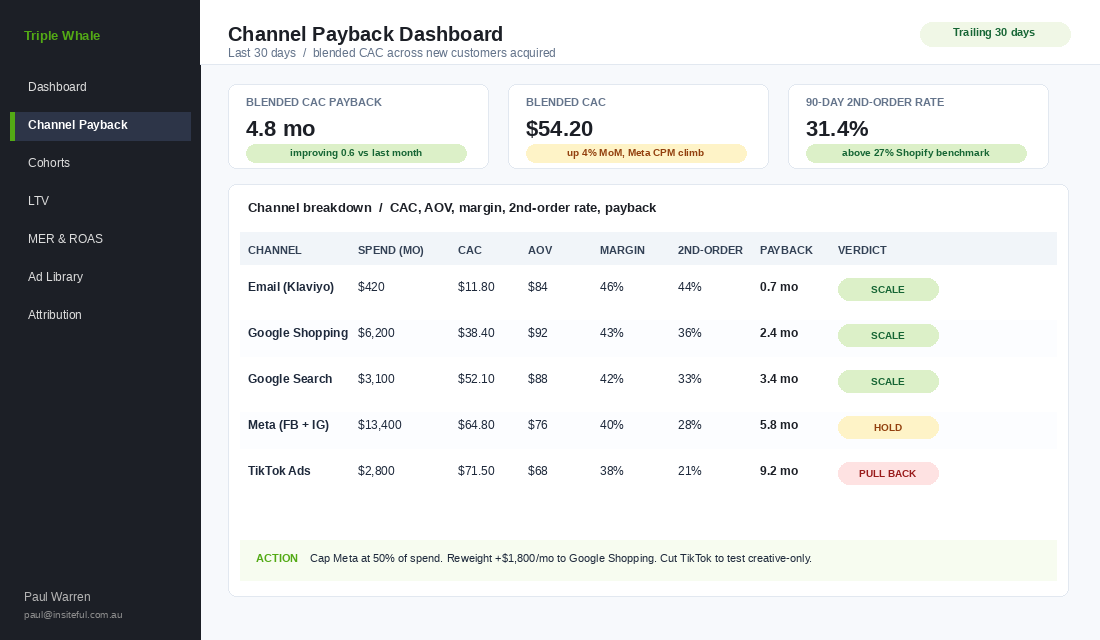
Blended payback is the headline. Channel payback is where the work gets done. Different channels have wildly different CAC, AOV, and second-order behaviour, and the average hides the truth.
Current 2026 channel CAC benchmarks for DTC ecommerce:
- Email. $8 to $15 per new customer. The cheapest channel because media cost is near zero. Klaviyo welcome and abandoned cart flows will sit in this band if your list is healthy. Highest ROI: $36 to $79 per dollar spent.
- Google Shopping. $28 to $52. High intent because the user is actively searching. ROAS often hits 5x+ on product-led campaigns.
- Google Search. $35 to $65. Slightly higher than Shopping because text ads pull broader queries.
- Meta (Facebook and Instagram). $45 to $75. Higher because Meta drives discovery, not intent. CPMs in competitive verticals are up 30 to 40% year over year. Despite the cost, Meta is still the volume channel for most Aussie DTC brands.
- TikTok. $40 to $80 depending on creative cadence and audience. ROAS averages 2.2x, but variability is huge.
- Affiliate and influencer. Variable. Properly negotiated affiliate can hit Google Shopping economics. Untracked influencer often runs at Meta CAC with worse repurchase.
Now layer in second-order behaviour. This is the part most channel analyses miss. A Google Shopping customer who searched “Frank Body coffee scrub Australia” already knows the brand and product, and her second-order rate is materially higher than a Meta cold-prospecting customer who clicked a video she saw at 11pm. Channel CAC matters, but channel-level payback matters more, because second-order rate determines how fast each channel pays back.
What to do once you have channel payback in hand:
- Reweight spend toward the fastest-payback channels. If Google Shopping pays back in 2 months and Meta in 6, the marginal dollar should bias toward Shopping until Shopping efficiency starts to soften.
- Set a Meta cap. Meta is the discovery engine you cannot live without, but you can cap it as a percentage of total spend until payback improves through better retention.
- Fund email and SMS aggressively. The single highest-ROI lever you control. The cost of a Klaviyo flow is fixed. Every additional dollar of email revenue compresses blended CAC.
- Audit affiliate. Make sure your affiliate spend is genuinely incremental and not just cannibalising Direct or Email. Use a geo-holdout test if you are not sure.
Stage 3: The 3 Scale Signals (When to Scale, Hold, or Pull Back)
This is where most Aussie founders make the wrong call. They look at ROAS or MER for a week, see it ticking up, and pour more spend in. Then they look at cash and panic. The decision should never be driven by a 7-day ROAS reading. It should be driven by these 3 signals, read together.
Signal 1: Trailing 30-day blended CAC payback. If your 30-day blended payback is improving (shrinking) week over week and is within or below your vertical benchmark, scaling is on the table. If payback is lengthening week over week, do not scale. Spending more on a lengthening payback curve accelerates cash burn.
Signal 2: Second-order rate at 30, 60 and 90 days. Pull this from Shopify cohort reports. If your 90-day second-order rate is climbing, your retention engine is working and payback will compress in the next quarter. If 90-day second-order rate is flat or falling, your retention engine is leaking, and any scale you push now will lengthen payback because new customers will not come back fast enough.
Signal 3: Cash on hand divided by monthly net cash outflow. Your runway. If your runway is less than 3x your payback period, you cannot afford to scale even if the unit economics support it. Example: 6 month payback, $30K/mo net cash outflow, $90K cash on hand. You only have 3 months of cash and your payback is 6 months. Scaling is suicide. Reduce spend, extend the float, then scale once cash catches up.
The decision matrix using all 3 signals:
- Scale. Payback shrinking + second-order rate rising + runway >3x payback. Add 15 to 25% to your spend this week, watch the same 3 signals.
- Hold. Payback flat + second-order rate flat + runway 2 to 3x payback. Keep spend steady, focus on the 5 compression levers below.
- Pull back. Payback lengthening + second-order rate flat or falling + runway <2x payback. Cut paid spend 20 to 30%, double down on email and SMS, fix retention, then re-scale once payback is back inside benchmark.
This is the framework we use with Aussie brands turning over $1m to $5m. It is unsexy and it is the difference between profitable scaling and quiet bankruptcy.
Stage 4: The 5 Levers to Compress Your Payback Period (Fast, In Order of Speed)
Once you know your payback period and where the leaks are, these are the 5 levers in order of how fast they move the number. Start at lever 1, do not skip ahead.
Lever 1: Lift AOV at the cart. The fastest payback compression you can ship this week. A 15% AOV lift on the same CAC drops payback period by roughly 13%. Cart drawer upsells, product bundles, free shipping threshold engineering, and post-purchase one-click upsells are the four ship-this-week tactics. Brands like Bondi Sands and MCoBeauty run aggressive bundle architectures on cart precisely for this reason. Read the 6-type bundle framework if you have not architected this yet.
Lever 2: Lift contribution margin. Renegotiate supplier costs, reduce shipping subsidies, audit app stack for revenue-share fees, drop the free-gift-with-purchase that is bleeding margin. A 3 percentage point lift in contribution margin (say 42% to 45%) compresses payback by 7%. Run a contribution margin audit, the linked piece above walks the framework.
Lever 3: Accelerate the second order. This is the heaviest lever in the medium term. Shopify benchmark second-order rate sits around 27%. Best-in-class beauty brands run 40%+. Closing that gap halves your payback period. The fastest second-order plays: post-purchase email and SMS sequences, replenishment reminders timed to product consumption, VIP early-access offers tied to second order, smart bounce-back coupons in the unboxing. After the second purchase, third-order probability jumps to 54%+, which is why the second order is the lever that moves the whole curve.
Lever 4: Rebalance channel mix. Most stores over-index on Meta. Email is sitting at $8 to $15 CAC and most Aussie founders are not investing enough in list growth (Klaviyo flows, pop-up architecture, lead magnets, content opt-ins). Shift 5 to 10% of Meta budget into list growth and lifecycle marketing. The blended CAC drops because email is doing more of the heavy lifting at near-zero media cost.
Lever 5: Improve top-of-funnel conversion. Site speed, PDP quality, checkout friction, abandoned cart recovery. A 10% lift in storefront conversion rate drops CAC by 10% because you are now acquiring more customers from the same spend. This is the slowest lever to ship but the most durable because it compounds every channel at once. Pair it with your conversion funnel audit for the full diagnostic.
The pattern: ship levers 1 and 2 in the first 4 weeks (they hit cash immediately), build lever 3 in weeks 5 to 12 (the heaviest medium-term lift), run levers 4 and 5 continuously. Stack the levers and you can take a brand from 7 month payback to 3 month payback in one quarter.
Stage 5: The Weekly Payback Dashboard (Govern Like It Is Cash, Because It Is)
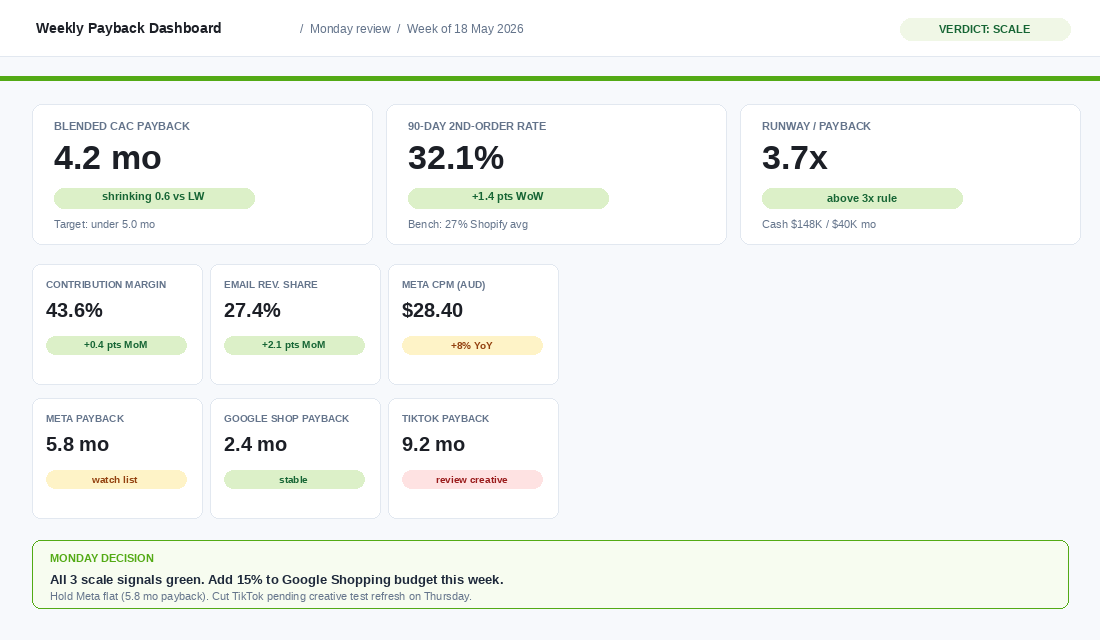
If you do not measure payback weekly, you will drift. Build a single dashboard, look at it every Monday before you touch a Meta budget.
The 6 cells your dashboard needs:
- Blended CAC payback (trailing 30 days). The headline number. Compare to last week and to your vertical benchmark.
- Channel payback (Meta, Google Shopping, Google Search, Email, TikTok). Where the leak is.
- 30, 60, 90 day second-order rate. Pulled from Shopify cohort reports.
- Contribution margin (rolling 30 days). If this drifts, payback lengthens regardless of CAC.
- Cash on hand divided by monthly net cash outflow. Runway expressed as months. Compared to payback. If runway < payback, you are at risk.
- Scale signal. Green (scale), amber (hold), red (pull back). One word, one decision.
Tools that will give you most of this without building it from scratch: Lifetimely (Shopify app for cohort and LTV reporting), TrueProfit (real-time profit and CAC), Triple Whale (multi-source attribution and payback), Bloom Analytics (Shopify-specific unit economics). Klaviyo gives you the email contribution side. Most Aussie founders we work with run Lifetimely plus a custom Google Sheet that pulls Shopify orders and ad spend daily, which keeps cost under $80/mo and gives you full control.
Set the cadence. Founder or CFO reviews the dashboard every Monday. Marketing reviews on Wednesday for mid-week course-correction. Pair this rhythm with a quarterly cohort analysis to spot whether payback is improving across cohorts (real progress) or just because last month’s customers were lucky (noise).
The Compound Effect of Sub-90-Day Payback (The Math Most Founders Miss)
Here is what changes when you compress payback from 7 months to 3 months on a brand doing $200K monthly revenue with $24K monthly ad spend.
At 7 month payback, every dollar of ad spend takes 7 months to come home. You need 7x your monthly spend (roughly $168K) tied up in working capital just to fund acquisition before the first dollar repays. Add inventory float on top and you need close to $300K in working capital to run a $200K/mo brand.
At 3 month payback, you only need 3x your monthly spend ($72K) tied up. That frees roughly $96K of working capital you can reinvest into more spend, more inventory, or pay yourself a salary. On the same $200K/mo brand, the cash flow profile completely changes. You can compound spend month over month because each new cohort pays back fast enough to fund the next one. This is how Aussie brands like Showpo, MCoBeauty, and Bondi Sands scaled without needing the kind of VC money US DTC brands burnt through.
The deeper truth: payback period is not just a marketing metric, it is the metric that decides whether you can scale on your own balance sheet or whether you need outside capital to grow. Aussie founders who run sub-90-day payback own 100% of their cap table and grow at their own pace. Founders who run 9 to 12 month payback either raise capital, slow growth, or quietly fold. There is no fourth option.
Payback by Entry Product: The Number That Sets Your Ceiling Before Any Channel Does
Stage 2 splits payback by channel. There is a second cut that is often more useful and almost nobody runs it: payback by the product a customer buys first.
Your entry product sets the ceiling on every payback number underneath it. Two customers acquired on the same Meta campaign at the same $48 AUD CAC can have wildly different payback periods depending on whether their first order was a $39 trial size or a $129 starter kit. Blend them together and the channel looks mediocre. Split them and you usually find one entry product is carrying the account and another is quietly making your CAC look bad.
Run the cut in about forty minutes. Export orders for the last 12 months, tag each customer with the product in their first order, then calculate three numbers per entry product:
- First-order contribution margin in dollars. Not percentage. A 65% margin on $39 is $25. A 45% margin on $129 is $58. The second product pays back more than twice as fast at identical CAC.
- 90-day repeat rate for that entry cohort. Anything above 25-30% means the product is doing its real job. Below 15% and you have bought a transaction, not a customer.
- 90-day cumulative contribution per acquired customer. This is the number that actually pays back the CAC, and it is the one to rank products by.
What you find is usually uncomfortable. In most Aussie DTC accounts we review, one or two entry products deliver a 90-day payback while the rest sit at 150-250 days. If your ads are pointing traffic at the whole catalogue, your blended payback is being dragged down by products that should never have been the front door.
Three moves once you have the ranking:
- Point cold traffic at the top two entry products only. Not the homepage, not a collection page. This alone typically moves blended payback by 15-25 days inside a quarter, because you have changed the mix rather than the media.
- Raise the floor on the weak entry points. A bundle or a two-pack that lifts first-order value from $39 to $62 changes the payback maths without touching CAC. That is a merchandising decision, not a media one, and it ships in a week.
- Stop paying to acquire on products with a sub-15% repeat rate. Keep selling them to existing customers. Just do not fund their acquisition with paid media.
Do this before you spend another month optimising creative. Creative moves CAC by 10-20% on a good run. Changing which product cold traffic lands on regularly moves payback by 30-40%, because it changes both sides of the equation at once. Our hero product playbook covers how to identify the product worth building the account around, and the entry product framework deals with designing a first purchase that pays back fast without cheapening the brand.
When Payback Is Fine but Cash Is Not: Financing the Gap
There is a scenario the five stages do not cover, and it is the one that kills otherwise healthy stores. Your payback period is a respectable 85 days. Your cohorts are improving. And you still cannot make payroll in six weeks.
This is not a payback problem. It is a timing problem, and the two get confused constantly. An 85-day payback on a business growing 40% year on year means the cash going out to acquire this month’s customers is always larger than the cash coming back from customers acquired three months ago, when the business was smaller. Growth itself consumes the cash. The faster you scale a profitable-on-paper account, the worse the hole gets before it gets better.
Diagnose it with one number: your cash conversion cycle. Days inventory outstanding, plus days receivables, minus days payables. For a typical Aussie DTC brand buying overseas on 30% deposit and holding 90 days of stock, that number is often 100-140 days. Put a 140-day cash cycle next to an 85-day payback and the picture resolves immediately. The ad spend is fine. The stock and supplier terms are the constraint.
Fix the timing before you fix the funding. In order of how quickly they free cash:
- Supplier terms. Moving from 100% upfront to 30/70 on shipment, or from net 0 to net 30, is usually worth 20-40 days of cycle. It costs one conversation and is almost always the highest-return hour of the quarter.
- Stock cover. Cutting from 120 days of cover to 90 on your slower half releases real cash without risking your top sellers. Most stores are over-stocked on the tail and under-stocked on the head.
- Payout timing. Check whether Shopify Payments is settling on the standard cycle for your plan. On thin cash, a two-day difference in payout timing across a peak week is material.
- Pace the scale. Increasing spend 20% a month instead of 50% keeps the gap survivable while payback does its work. This is the lever founders hate and need most.
Only after those should you look at inventory finance. If you do, price it properly against the payback number you already have. Facilities in this market commonly land somewhere around 1.5-3% per month, so borrowing to fund an 85-day payback costs you roughly 4-8% of the amount financed over the cycle. That is fine on a product with 40%+ contribution margin and it is ruinous on one at 22%. Run the comparison per product, not across the business.
The governance point matters as much as the maths. Put the cash cycle on the same weekly dashboard as your payback number from Stage 5. A store that watches payback without watching cash will scale confidently into a wall. Our cash conversion cycle playbook covers the five working-capital levers in detail, and the 8-week rolling forecast is the artefact that turns all of this into a decision you can make on a Monday rather than a surprise you discover on a Friday.
The 5-Stage Playbook in One Page
- Stage 1: Measure. Run the formula on the last 90 days using accurate CAC, contribution margin, AOV, and order frequency. Plot yourself against vertical benchmarks.
- Stage 2: Diagnose. Break payback down by channel. Reweight spend toward the fastest-payback channels. Cap Meta. Fund email and SMS.
- Stage 3: Decide. Read the 3 signals together (trailing payback trend, second-order rate trend, runway vs payback). Scale, hold, or pull back. No 7-day reactions.
- Stage 4: Compress. Ship AOV and margin levers in 4 weeks. Build the second-order engine in 12 weeks. Run channel mix and conversion levers continuously.
- Stage 5: Govern. Weekly dashboard, Monday review, quarterly cohort analysis. Make payback the single metric that gates every spend decision.
Inside eCommerce Circle, CAC payback period is one of the core pillars we work on with every member who is scaling paid media. If you want a second opinion on yours, let’s