Open your Meta Ads Manager right now and look at the ROAS number on your best campaign. Then open Shopify and look at what actually landed in the bank this week. The two numbers do not agree, and they have not agreed for years. One platform swears it drove 40 sales. Another claims 35 of the same orders. Your bank account saw one set of deposits. So who is telling the truth?
What’s in This Article
Here is the uncomfortable answer: none of them. Since Apple’s App Tracking Transparency rollout, roughly 85% of iOS users opt out of being tracked, and the Meta pixel that once captured 85 to 90% of conversions now sees just 40 to 60% in most accounts. You are making five and six figure budget decisions on data with a hole in the middle of it.
The fix is not another attribution app promising to “stitch” your data back together with a black box algorithm. The fix is older, cheaper, and far more honest. You ask the customer. A single post-purchase survey, set up properly, gives you the one data source no privacy update can take away: the buyer telling you, in their own words, how they found you. This is the playbook we run with Aussie founders to rebuild attribution from the ground up.
Why Your Ad Dashboard Has Been Lying To You
Before iOS 14.5, the pixel was good enough. Someone clicked your Facebook ad, browsed, bought, and Meta matched the order back to the ad with near-perfect accuracy. You could trust the ROAS column and scale on it. That world is gone and it is not coming back.
Three things broke at once. First, the identifier Meta used to follow people between apps disappeared for the 85% who opted out. Second, the attribution window collapsed from 28-day click down to 7-day click, 1-day view, so any sale that takes more than a week to close simply vanishes from the report. Third, and most damaging, the gap is not random. Channels that do not generate a click at all, like a podcast read, a TikTok someone watched without tapping, a mate’s recommendation at a barbecue, or increasingly a mention inside ChatGPT, are completely invisible to every pixel you own.
That last point is the killer. Word of mouth converts faster than almost any paid channel, yet it shows up nowhere in Ads Manager. So you keep pouring budget into the platforms that are best at claiming credit, not the channels actually driving demand. You over-fund Meta because Meta is loud about its wins, and you starve the channels quietly doing the heavy lifting.
A post-purchase survey closes the gap from the other direction. Instead of trying to track the customer’s journey with code, you wait until the moment they are most engaged, the second after they hit “complete order”, and you simply ask. Done right, this is the single highest-leverage data project most stores can run this quarter.
Stage 1: The One Question That Rebuilds Everything
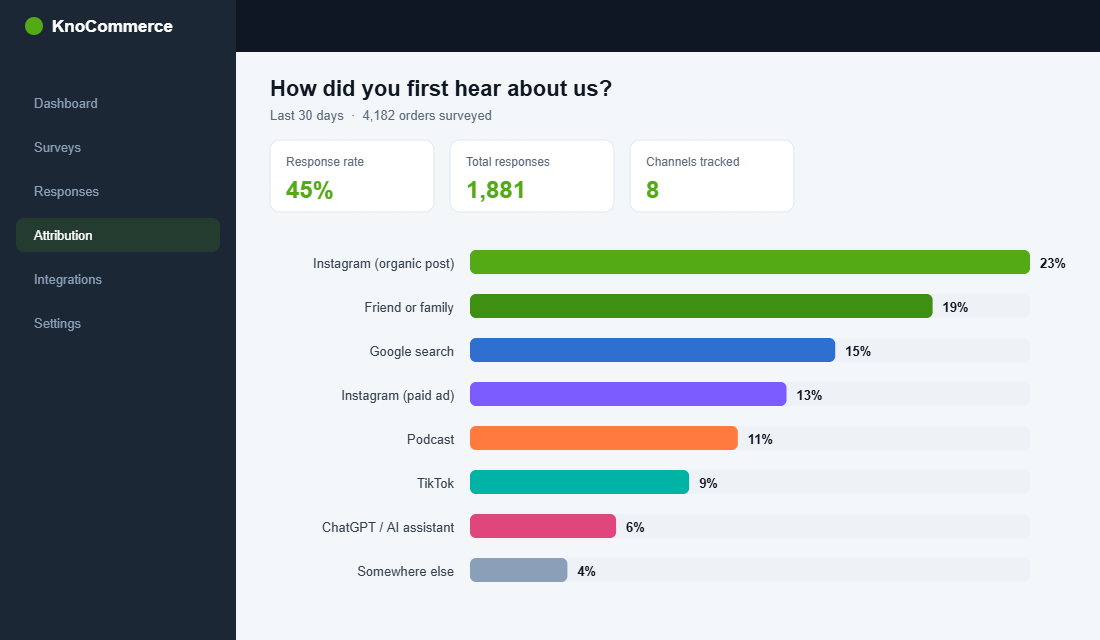
The cornerstone of attribution survey work is one deceptively simple question: “How did you first hear about us?” Marketers call it HDYHAU, and the word “first” is doing enormous work. You are not asking where they last clicked. You are asking what originally put you on their radar, which is exactly the information your pixel can never see.
The discipline here is restraint. The fastest way to wreck your response rate is to bury the customer in questions. Best practice across the industry sits at two to three questions maximum, and your attribution question should be the first one they see. Keep the answer options to a tight list of your real channels rather than a sprawling menu:
- Be specific, not generic. “Instagram” is fine, but “Instagram (saw your ad)” versus “Instagram (a friend or creator posted)” tells you whether to credit paid social or organic reach.
- Name the dark channels explicitly. Add options for “Podcast”, “Friend or family”, “TikTok”, “Google search”, and increasingly “ChatGPT or AI assistant”. If you do not list them, you will never measure them.
- Always include an open text option. “Somewhere else (tell us where)” catches the channels you did not think to list. This is where you discover the regional radio spot or the niche forum that is quietly converting.
- Avoid leading order. Randomise the option order if your tool allows it, so “Facebook” does not win simply because it sits at the top of the list.
This one question, asked of every buyer, builds a parallel attribution model within weeks. It will not match your pixel, and that is the entire point. The disagreement between the two is the map to where your real money is being made.
Stage 2: Choose Your Tool and Get It Live This Week
You do not need to build anything custom. Two purpose-built tools dominate this space on Shopify, and both install in an afternoon. KnoCommerce (KNO) is used by over 1,200 brands driving close to 2 million survey responses every month, and reports an average response rate around 45%. Fairing is the other heavyweight, with thank-you page completion rates that often land between 40 and 80%. Triple Whale also bundles a post-purchase survey if you already run their dashboard. For most Aussie stores, KnoCommerce or Fairing is the right starting point.
Here is the exact setup sequence to go live, using KnoCommerce as the example:
- Install from the Shopify App Store. Search “KNO Post Purchase Surveys”, add it, and approve the permissions. It hooks into your order confirmation page automatically, so there is no theme code to touch.
- Build the attribution question first. Create a single-select question titled “How did you first hear about us?” and load your real channel list as the answers, including the dark-channel options above.
- Set the display rule to 100% of orders. Do not sample. You want every buyer surveyed so your channel shares are statistically solid within the first few hundred orders.
- Add one follow-up logic branch. If someone selects “Instagram”, follow with “Was it an ad or organic post?” Conditional logic gets you precision without adding length for everyone.
- Connect it to Klaviyo. Map the survey answer to a customer profile property so the response flows into your email platform as a segmentable tag. This is the step most stores skip and later regret.
- Publish and watch the first 50 responses. Within a day you will have enough to sanity-check that the question reads clearly and the options cover reality.
That is the whole build. An hour of work, then you let the data accumulate while you get on with running the store.
Stage 3: Read the Data Without Fooling Yourself
Two weeks in, you will have a few hundred responses and a strong temptation to over-read them. Resist it. Survey data is powerful but it has its own biases, and treating it as gospel is as dangerous as trusting the pixel blindly. Here is how to read it like an operator, not a fan.
First, compare channel share, not absolute numbers. If your survey says 30% of buyers first heard about you on Instagram while Meta claims credit for 55% of revenue, that gap is your signal. It usually means Meta is over-claiming the last click on demand that was actually created somewhere else. Track the trendline of survey share against platform share week over week and look at where they diverge.
Second, expect under-reporting on direct-response channels and over-reporting on memorable ones. People remember a podcast host they love and forget the retargeting ad they saw nine times. A survey-informed multiplier helps here: if podcast redemptions in your codes say one thing and survey mentions say another, use both to triangulate rather than picking a winner. The honest answer is usually somewhere between what the pixel claims and what the survey claims.
Third, watch the emerging channels. Fairing’s recent benchmark data flagged a more than tenfold rise in AI assistant mentions, with roughly one in seven brands now seeing customers report they found them through an LLM like ChatGPT. Eighteen months ago that channel did not exist on anyone’s survey. If you are not listing it, you are blind to one of the fastest-growing discovery sources in retail.
The goal of this stage is not a single perfect number. It is a confident sense of direction: which channels are under-credited by your dashboards, and which are coasting on borrowed credit.
Stage 4: Layer In the Profit and Segmentation Questions
Once your attribution question is humming, the survey becomes a second engine: a zero-party data machine that feeds your marketing far beyond ad spend decisions. Zero-party data is information the customer hands you deliberately, and it is the most valuable data you own because no privacy regulation can touch it and no competitor can buy it.
The numbers back this up. Zero-party data has been shown to drive 25 to 40% higher email engagement compared with generic campaigns, and intent captured at the survey stage can lift repeat purchase rates meaningfully when you act on it. Here are the highest-value follow-up questions to rotate in once your attribution data is stable:
- “What almost stopped you from buying?” The single best source of conversion-rate optimisation ideas you will ever read. Patterns here point straight at your product page gaps.
- “Who are you buying this for?” Gift buyers behave completely differently from self-purchasers. Tag them and your post-purchase flow can stop assuming everyone is shopping for themselves.
- “What were you using before this?” Tells you who you are really competing against, in the customer’s own words, which is gold for your ad angles and landing copy.
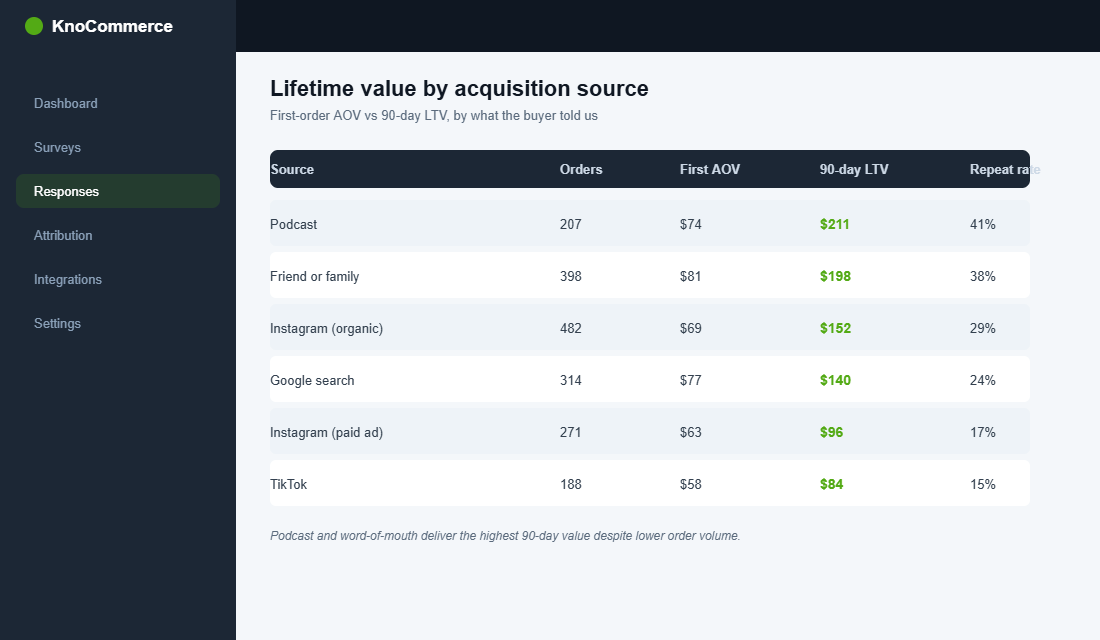
- “How did you hear about us?” cross-referenced with order value. Now you can see lifetime value by acquisition source, not just first-order revenue.
That last cross-reference is where attribution and profit meet. A channel that brings cheap first orders but low repeat value is very different from one that brings fewer, higher-value, loyal buyers. This is the same lens we apply in the Customer Lifetime Value playbook: stop judging channels on the first sale and start judging them on the customer they deliver.
Stage 5: Turn Answers Into Action
Data that does not change a decision is a vanity project. The whole point of this build is to move money and effort toward what works. Here is what action looks like once the responses are flowing.
Reallocate ad budget against survey share, not just platform ROAS. If your survey consistently shows a channel punching above the credit your dashboard gives it, test a budget shift and watch blended ROAS, the only ROAS that cannot lie because it is just total revenue divided by total spend. If blended improves, the survey was right.
Feed the segments into your email and SMS. Because you piped survey answers into Klaviyo in Stage 2, you can now build flows that respond to what people told you. Gift buyers get a different post-purchase sequence. People who found you via a creator get content that leans into community. This is the same segmentation discipline that powers a strong abandoned cart recovery flow, applied at the front of the relationship instead of the cart.
Double down on the dark channels the survey reveals. If “podcast” or “a friend recommended us” keeps climbing, that is your cue to invest in the channels the pixel ignores. A surprising number of brands discover their word-of-mouth and creator engine is their real growth driver, which is exactly the thesis behind the creator gifting playbook. The survey is what gives you the confidence to fund it.
The Compound Effect: Three Assets From One Question
Here is why this is the highest-leverage hour you will spend this quarter. A single post-purchase survey is not one tool. It is three assets compounding off each other.
Asset one is a privacy-proof attribution model that gets sharper every single day as responses accumulate, while your pixel gets weaker with every new privacy update. Asset two is a zero-party data layer that makes your email, SMS, and CRO smarter than any competitor relying on guesswork. Asset three is a decision-making discipline: you stop arguing about which dashboard to believe and start triangulating between the pixel, the survey, and your blended numbers.
None of these require more traffic, a bigger budget, or a new agency. They require one well-built question, asked of every buyer, and the discipline to act on the answers. The brands that win the next few years will not be the ones with the cleverest pixel workaround. They will be the ones who simply asked their customers and listened.
Your 7-Day Post-Purchase Survey Rollout Checklist
Print this, work through it one step a day, and you will have a working attribution engine inside a week.
- Day 1. Install KnoCommerce or Fairing from the Shopify App Store and connect it to your store.
- Day 2. Build the “How did you first hear about us?” question with your real channel list, including podcast, friend, TikTok, Google, and AI assistant options plus an open text field.
- Day 3. Set display to 100% of orders and add one conditional follow-up (ad versus organic) for your biggest social channel.
- Day 4. Connect survey responses to Klaviyo as a customer profile property so answers become segmentable tags.
- Day 5. Review your first 50 to 100 responses. Confirm the options cover reality and tidy any that are confusing.
- Day 6. Compare survey channel share against your Meta and Google reported share. Note the three biggest gaps.
- Day 7. Pick one channel the survey says is under-credited, shift a test budget toward it, and set a calendar reminder to check blended ROAS in 14 days.
That is it. Seven days, one question, and a permanent answer to “where are my customers actually coming from?”
Stop Guessing, Start Asking
The pixel is not going to get better. Privacy rules tighten every year, dark social keeps growing, and AI assistants are quietly becoming a discovery channel nobody can track with code. The founders who stay calm through all of it are the ones who built a direct line to the truth: their own customers, answering one honest question at the moment they care most.
Inside eCommerce Circle, understanding your prospects and where they truly come from is one of the core pillars we work on with every member. If you want a second opinion on your attribution and survey setup, let’s talk.