Almost every Aussie Shopify founder I speak to who runs a rewards program picked the earn rate the same way. They opened the app, saw the default of one point per dollar spent and one hundred points for five dollars off, thought “that sounds about right”, and switched it on. No modelling. No margin check. No idea what the thing costs.
What’s in This Article
That default is a 5% discount on every dollar your best customers spend. On a store running a 62% gross margin, that quietly removes about 8% of your contribution before a single extra order shows up. Most founders never notice, because the cost lands in a rewards app dashboard instead of on the profit and loss.
The frustrating part is that loyalty genuinely works when it is built properly. Businesses running tiered programs report an average return of 4.9 times program cost, and 90% of them land in positive territory. Members beat non-members on average order value by 15% or more. The programs that fail are not failing because loyalty is a bad idea. They are failing because nobody did the maths first.
Your Rewards Program Is a Discount Until You Prove Otherwise
Here is the mental shift that changes everything. A loyalty program is not a marketing channel. It is a permanent, automatic price cut that you have agreed to give to the customers who were most likely to buy again anyway.
That is not an argument against running one. It is an argument for knowing the number. If the price cut is 4% and it buys you an extra 1.4 orders per member per year, you are well ahead. If it is 7% and it buys you 0.3 extra orders, you have just handed margin to people who did not need convincing.
The Australian market makes this sharper than most. 93% of Australian consumers belong to at least one loyalty program, and the average member is signed up to about 10 when prompted with a list. But ask them unaided and they can only name 3.8. Only half say they are active in all the programs they have joined. Your points scheme is competing for attention against Flybuys, Woolworths Everyday Rewards and every other brand your customer buys from. Being forgettable is the default outcome.
So the question is never “should we run rewards”. It is “what is this costing, and what is it buying”.
Step 1: Work Out What One Point Really Costs You
Start with face value. If 100 points buys 5 dollars off, one point has a face value of 5 cents divided by 100, which is half a cent. Simple enough. But face value is not cost, and this is where most founders stop too early.
The real cost of a point depends on what it gets redeemed against. Five dollars off an order costs you five dollars of pure contribution, because the customer was buying anyway and you have simply collected less. A free product reward costs you the landed cost of that product, which on a 62% margin item might be 38 cents in the dollar. Free shipping on a reward costs you whatever your carrier charges, which in Australia is rarely under nine dollars for a regular parcel.
Run this calculation for every reward you offer:
- Cash-off rewards. Cost equals face value. A ten dollar reward costs ten dollars of contribution.
- Product rewards. Cost equals landed unit cost plus pick, pack and freight. Usually 35 to 50% of the retail value you are advertising.
- Free shipping rewards. Cost equals your actual average freight, not the rate you charge customers.
- Early access and member events. Cost is close to zero in cash terms. This is the cheapest currency you have and almost nobody uses enough of it.
Write the blended number down. If your program is 70% cash-off redemptions and 30% product rewards, your blended cost per point is not the face value. It is somewhere between, and it is the number that goes into every calculation from here.
Step 2: Be Honest About Redemption and Breakage
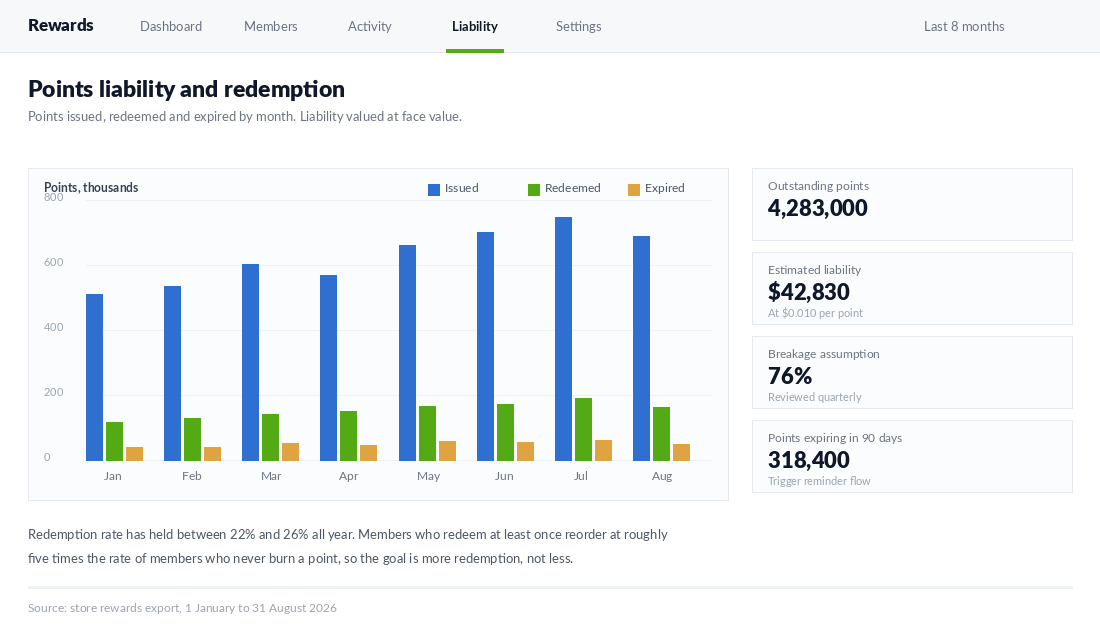
Not every point issued gets burned. The gap is called breakage, and it is the single biggest variable in your model. Healthy ecommerce programs sit at a 20 to 30% redemption rate, which means 70 to 80% of points are never spent. Around 27% of loyalty points go completely unused, and 11 to 12% expire outright.
Founders love breakage because it makes the program look cheap. Issue a million points, only 240,000 get redeemed, and suddenly the effective discount is a quarter of what you feared. That maths is correct. The conclusion most people draw from it is wrong.
Here is why. Customers who redeem at least one reward go on to buy again at roughly a 50% rate. Customers who never redeem sit at 10.7%. That is a 4.7 times difference in repeat purchase behaviour, driven by the act of burning points, not earning them. High breakage is not a saving. It is a signal that most of your members are inert and your program is doing nothing for them.
So model your program at two breakage rates. Model it at the breakage you have today, and model it at the breakage you would have if redemption doubled. If the program only works at 80% breakage, it does not work. You have built something that is profitable precisely because it is being ignored, and the moment it starts working it will start losing money.
Step 3: Price the Earn Rate Against Contribution, Not Revenue
This is the step that separates programs that add profit from programs that look busy. Everyone expresses reward cost as a percentage of revenue, because that is what the app dashboard shows. Revenue is the wrong denominator.
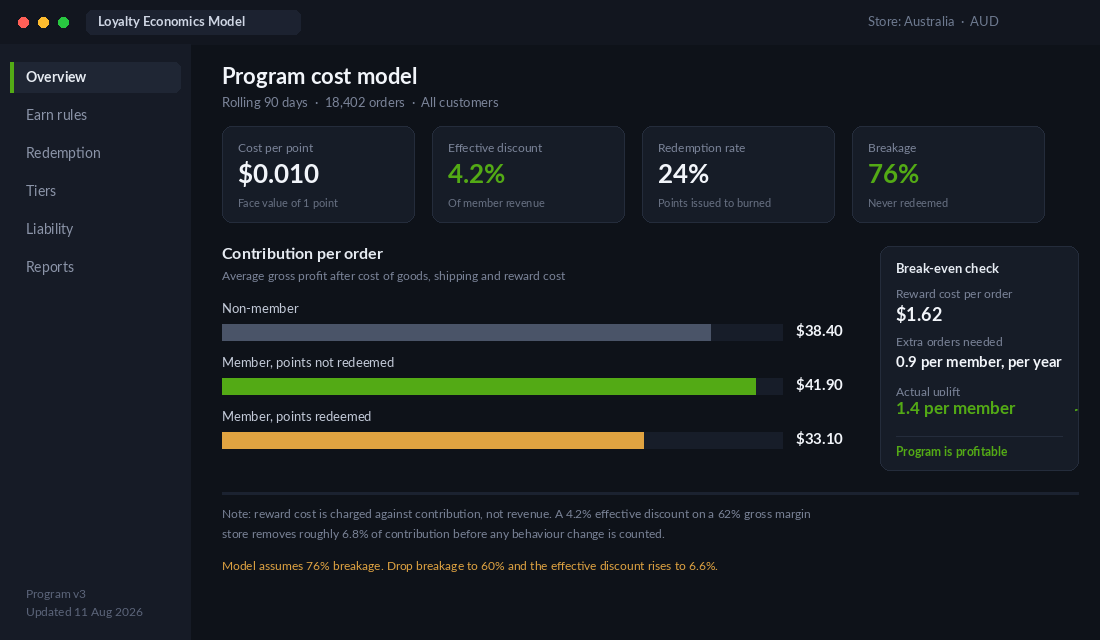
Work an example. Your average order is 104 dollars. Your gross margin after cost of goods and freight is 62%, so contribution per order is about 64 dollars. A one point per dollar earn rate with a 5 cents per 100 points redemption value, adjusted for a 24% redemption rate, costs you roughly 1.25 dollars per order.
As a share of revenue that is 1.2%, which sounds like nothing. As a share of contribution it is 2%, which is the number that actually matters. Now double the earn rate to two points per dollar because a competitor did, and you are at 4% of contribution. Add a 500 point welcome bonus and a birthday reward and you are through 6% before you have counted the app subscription.
Set a hard ceiling before you launch. For most Aussie DTC stores in the 40,000 to 500,000 dollars per month range, a sensible ceiling is 5% of contribution, all reward types and bonuses included. Anything above that and the program needs to be demonstrably driving incremental orders, not just decorating orders that were happening anyway.
Then calculate your break-even in orders. If the program costs 1.25 dollars per order and contribution per order is 64 dollars, each member needs to place roughly one extra order every two years to pay for themselves. That is a low bar, and it is exactly why loyalty is worth doing properly. But you have to know the bar exists.
Step 4: Build Tiers Around the Behaviour You Want to Buy
Flat point schemes reward everyone equally, which means they overpay your best customers and underwhelm everyone else. Tiers fix that, and the two best Australian examples are worth studying closely because they solved the same problem in different ways.
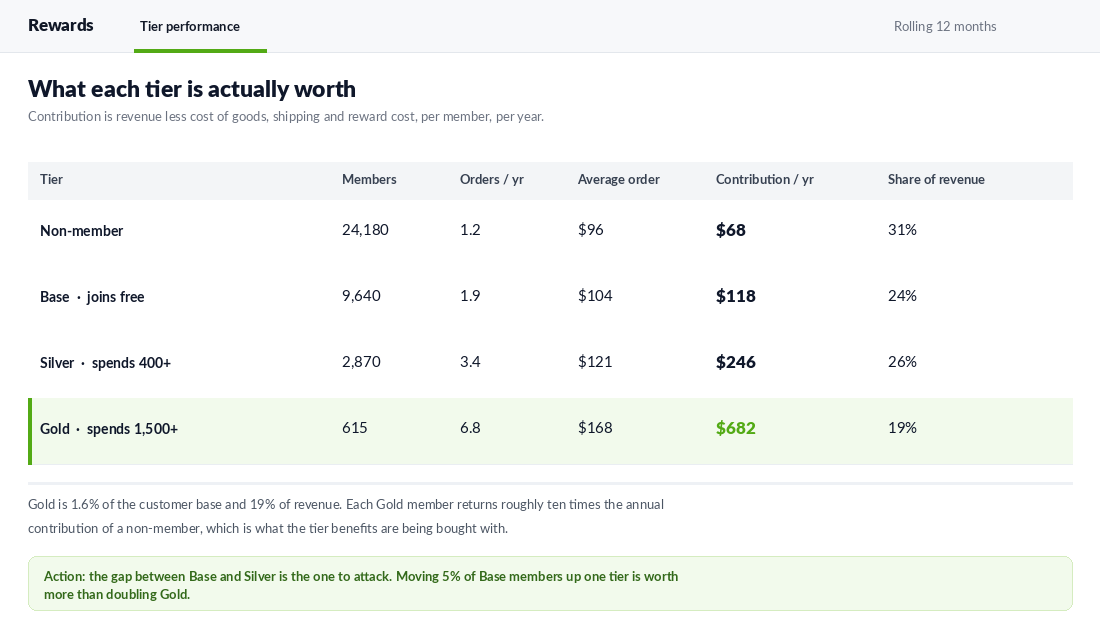
Adore Beauty runs Adore Society with three levels. Level 1 covers anyone up to 399 dollars of spend, Level 2 starts at 400 dollars, and Level 3 starts at 1,500 dollars, all measured over a rolling twelve months. Higher tiers get early access to launches, member-only offers and a welcome reward. Notice how much of that is access rather than discount.
Mecca runs Beauty Loop with five levels, starting at signup and stepping up at 300, 600, 1,200 and 3,500 dollars of annual spend. The rewards are heavily weighted towards samples, gifts and early access to new launches rather than money off. Mecca is buying frequency and brand attachment, not paying customers to come back.
Set your own thresholds using your own data, not theirs. Pull your last twelve months of customer spend and find the percentile breaks. A workable structure for most Aussie stores:
- Base. Free to join. Everyone lands here. Earn rate only, no extra benefits.
- Middle tier. Set the threshold at roughly the 75th percentile of annual customer spend. This is the tier you actually want people climbing into.
- Top tier. Set at the 95th percentile. Small population, disproportionate revenue, benefits that are mostly access and service rather than discount.
Three tiers is usually enough below a few million in revenue. Five tiers on a store doing 80,000 dollars a month just creates levels nobody can reach. And if you have not yet worked out who your highest-value customers are, start with the top 10% customer strategy before you design a single tier.
Step 5: Pay People in Things That Are Not Discounts
The cheapest reward currency you have costs you almost nothing and is the one most Australian stores ignore completely. Access.
Early access to a new drop costs you nothing. It shifts revenue forward and it makes the launch feel like an event. Member-only bundles cost you nothing beyond the merchandising work. A birthday gift with purchase costs you the landed cost of a sample, not the retail price. Free returns for top-tier members costs you a few dollars per return and removes the single biggest hesitation on a considered purchase.
Compare that to the alternative. One case study worth knowing: a European retailer replaced discount-based incentives with gamified challenges and lifted average order value by 41% without discounting at all. The lift came from engagement, not price.
A practical split for a store under a million a year: make roughly 60% of your reward value non-cash. Early access, samples, free shipping thresholds, member events, first look at restocks. Keep cash-off rewards for the moments where you genuinely need to trigger a purchase, such as reactivating someone who has gone quiet. That is a job for a proper win-back flow, not for a permanent standing discount.
Step 6: Track the Four Numbers That Tell You It Is Working
Most rewards app dashboards are built to make you feel good. They show points issued, members enrolled and total rewards claimed. None of those tell you whether the program is profitable. Four numbers do.
- Redemption rate. Points burned divided by points issued, over a rolling twelve months. Target 20 to 30%. Below 15% and your members are inert. Above 40% and check your earn rate is not too generous.
- Effective discount on contribution. Total reward cost divided by member contribution. Keep it under 5%. Review monthly.
- Member versus non-member contribution per customer. Not revenue, contribution. Members should be running at least 1.4 times non-members. Program members typically generate 12 to 18% more revenue than non-members, and 1.4 to 1.6 times the lifetime value, so anything below that is underperforming.
- Tier migration rate. The percentage of members who move up a tier each quarter. This is the number nobody tracks and the one that tells you whether the ladder is climbable.
Put all four on the same sheet you use for the rest of your weekly numbers. If you do not have that sheet yet, the weekly scorecard is the place to start, and loyalty slots straight into it.
One more thing worth watching: outstanding points are a real liability. Under the accounting treatment most Australian businesses use, you carry outstanding points at expected redemption value, calculated as outstanding points multiplied by one minus your breakage rate, multiplied by cost per point. On a store with four million outstanding points at half a cent each and 76% breakage, that is around 4,800 dollars of deferred obligation sitting on the books. Small enough to ignore at first. Not small enough to ignore at scale, and worth a conversation with your accountant before a raise or a sale.
Picking the App: What to Run at Your Order Volume
The app market has sorted itself out reasonably clearly. Match the tool to your volume rather than your ambition.
- Smile.io. Essential at 39 US dollars a month covers 500 orders, Growth at 159 covers 2,500, and the enterprise plans run into the high hundreds. Best starting point for most Aussie stores under a million a year.
- Rivo and BON Loyalty. Free plans available with paid tiers from around 199 US dollars a month. Clean, Shopify-first, strong on points, tiers and referrals.
- LoyaltyLion. Quote-based, generally 199 to 1,000 plus a month, and genuinely best fit above about 1.5 million a year. Deep segmentation, strong analytics, multi-store support if you run more than one Shopify storefront.
- Yotpo Loyalty. Free to install with Gold at 159 a month. Worth it mainly if you are already using Yotpo for reviews and SMS.
Watch the pricing model as closely as the feature list. Flat monthly fees stay predictable as you scale. Per-member and revenue-tiered pricing can compound to two or three times the cost of a flat-fee alternative by the time you are doing serious volume.
If you are starting with Smile.io, the setup order that works is this. Install and connect, then set your earn rate deliberately using the maths above rather than accepting the default. Turn on a points balance display in the cart and on the product page, because points nobody can see do not change behaviour. Build two tiers only for the first ninety days. Connect it to Klaviyo so points balance and tier status become segmentable fields. Then set a calendar reminder for day 90 to pull redemption rate and effective discount before you change anything.
The Loyalty Maths Worksheet
Copy these eight lines into a spreadsheet and fill them in before you launch, change an earn rate, or renew an app subscription. If you cannot fill in every line, you do not yet know what your program costs.
- Blended cost per point. Weighted across cash-off, product and shipping rewards.
- Points issued per average order. Include welcome, birthday and referral bonuses, not just the base earn rate.
- Redemption rate. Rolling twelve months, actual not assumed.
- Reward cost per order. Lines 1 by 2 by 3.
- Contribution per order. Revenue less cost of goods, less freight, less payment fees.
- Effective discount on contribution. Line 4 divided by line 5. Ceiling of 5%.
- Break-even extra orders per member per year. Annual reward cost per member divided by line 5.
- Actual member uplift. Member orders per year less non-member orders per year. This has to beat line 7.
Rerun it quarterly. Earn rates drift, bonus campaigns accumulate, and the program that was costing 3% of contribution in March has a way of costing 6% by November if nobody is checking.
Why This Compounds
Look at what happens when the six steps run together rather than separately.
You cost your points properly, so the earn rate is set at a level your margin can carry. You model redemption honestly, so you are chasing more redemption rather than hiding behind breakage. You price against contribution, so the program cannot quietly creep past 5% without someone noticing. You build tiers off your own percentile data, so there is a rung people can actually reach. You pay in access rather than cash wherever possible, so the cost per unit of perceived value drops. And you track four numbers that tell you the truth instead of four that make you feel good.
The compounding happens on the customer side. A member who redeems once buys again at close to a 50% rate against 10.7% for a member who never burns a point. Move even a slice of your base from inert to active and repeat purchase rate climbs. The average ecommerce store sits at a 28.2% repeat purchase rate and a 30% retention rate, while the top performers reach 62%. That gap is not built on a more generous points scheme. It is built on a program that people actually engage with, funded by margin the business can afford to give away.
Every extra repeat order also arrives with no acquisition cost attached. On a store spending 25 dollars to acquire a customer, shifting from 1.9 to 2.6 orders per member per year is the same as cutting your blended acquisition cost by a quarter, without touching a single ad account.
That is the version of loyalty worth building. Not a discount with extra steps. A system where the money you give away is priced, tracked and buying something specific.
The Liability Your Accountant Will Eventually Ask About
Here is the part almost no Aussie founder handles until an accountant raises it at year end. Unredeemed points are a liability. You have promised future value and not yet delivered it.
At a small scale nobody cares. Once outstanding points represent a meaningful number, it starts to matter for your balance sheet, for any due diligence if you ever sell, and for your own sanity when you want to change the earn rate.
The calculation is straightforward. Take total points outstanding, multiply by your cost per point from Step 1, then multiply by your expected redemption rate rather than 100%. A store with 4.2 million points outstanding at $0.008 a point and a 22% redemption rate is carrying roughly $7,400 of real exposure, not the $33,600 the raw number suggests.
Pull that number quarterly, drop it into a single line in Xero or your management accounts, and watch the trend. If outstanding points are growing faster than revenue, your earn rate is too generous or your redemption experience is too hard. Both are fixable, and both get more expensive the longer you leave them.
Set an expiry. Twelve to eighteen months of inactivity is the Australian norm, and it is the single most effective control on runaway liability. Be aware that under Australian Consumer Law your terms need to be clear and disclosed at sign-up, and points expiry is a term people will screenshot and complain about publicly if it arrives as a surprise. Email a warning at 60 days and again at 14 days before expiry. Those warning emails also happen to be some of the highest-converting messages in the whole program, often pulling 8 to 15% click rates against a 2 to 4% baseline.
How to Reprice or Retire a Program Without a Backlash
You run the maths, you find the program is costing 6% of revenue and buying nothing, and now you have to change it. This is the moment founders freeze, because the downside feels asymmetric. A quiet win versus a loud, public loss.
Run it in this order and the backlash largely does not arrive.
- Grandfather the balance, change the earn. Never devalue points people already hold. Honour every existing point at the old rate and change only what is earned from the change date. This removes about 90% of the anger.
- Give 30 days’ notice. One email at announcement, one reminder at seven days. Say plainly what is changing and when. Do not bury it in a terms update nobody reads.
- Give people a reason to spend, not a reason to complain. Run a redemption window before the change with a bonus, such as 20% extra value on any redemption in the next three weeks. You clear liability at a known cost and the change lands as an offer instead of a takeaway.
- Replace value, do not just remove it. If you cut the earn rate from 5% to 2%, add something that costs less and is worth more, such as early access to drops, free express shipping for tier two, or a birthday gift with a real product attached.
- Watch the three numbers for 60 days. Repeat purchase rate, average time between orders, and unsubscribe rate. If repeat rate holds and unsubscribes stay flat, the program was never driving the behaviour and you have just recovered several points of margin.
Most stores that do this properly find repeat purchase rate moves by less than one percentage point. That is the finding worth having, because it tells you the discount was buying orders that were coming anyway. The same test logic applies to any spend you suspect is not incremental.
If you would rather not touch it mid-year, do the repricing in your quietest trading month. For most Aussie DTC brands that is February or July, well clear of peak, when a small dip in repeat orders will not cost you a quarter.
Inside eCommerce Circle, retention economics is one of the core pillars we work on with every member, and the loyalty worksheet above is one of the first things we run on a new store. If you want a second opinion on what your program is really costing you, let’s talk.