Your Perth customers are quietly costing you money, and your analytics will never tell you why. They convert at a lower rate than your Sydney customers. They lodge more “where is my order” tickets. They come back to buy a second time less often. Nothing on your dashboard flags it, because the number that explains it is not in Shopify. It is on a map.
What’s in This Article
Most Aussie founders run a single warehouse until something breaks. Usually that something is a peak season, or a competitor who starts promising next day to the same postcodes you take six days to reach. Then the decision gets made in a panic, in October, with a 3PL sales rep doing the maths on your behalf.
That is backwards. Adding a second fulfilment node is a capital allocation decision, not a logistics one. It duplicates your safety stock, adds a second monthly minimum, and buys you roughly two to four days of transit time on somewhere between 10 and 25 per cent of your orders. Sometimes that trade is brilliant. Often it is not. Australians spent a record 82.6 billion dollars online in 2025, up 14 per cent year on year, and the brands winning the biggest share of that are the ones who worked out the answer with a spreadsheet before they signed a contract.
Here is the test I run with founders before anyone tours a warehouse.
Why One Warehouse Quietly Caps Your Growth
Australia is a distribution problem disguised as a country. Your addressable market sits in five cities separated by distances that would cross several European borders. A single east coast warehouse serves roughly two thirds of the population well and the rest badly.
Look at the actual network. Australia Post runs a next business day service between capital cities, but that network excludes Darwin and, for Perth, covers the CBD only. Parcel Post metro to metro is quoted at two to three business days and Express at one to two. Send to Western Australia outside that CBD footprint and the honest quote stretches out considerably. Your Perth customer is not comparing you to your Adelaide customer. They are comparing you to whoever ships to them from Welshpool.
The conversion cost is measurable. Around 43 per cent of consumers have abandoned a cart or walked away from a retailer because shipping was too slow, and 74 per cent now expect delivery inside two days. Cart abandonment across ecommerce sits near 70 per cent on average, and slow delivery is one of the few causes you can actually engineer away.
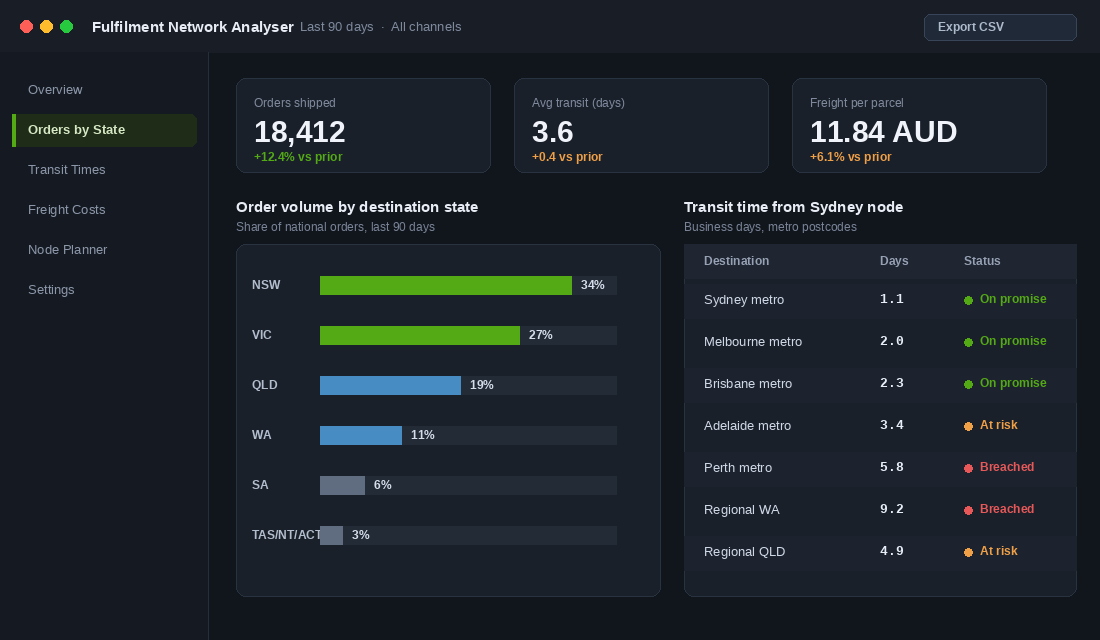
There is a cost side too. Last mile delivery now absorbs 53 per cent of total shipping spend, up from 41 per cent in 2018. Every parcel you send from Sydney to Perth pays a line haul premium before it ever reaches a delivery van. Multiply that premium by a few thousand parcels a year and the second node starts paying for part of itself in freight alone.
The brands that solved this did it deliberately. Koala runs fulfilment centres in Sydney, Melbourne, Brisbane, Adelaide and Perth, which is what lets them offer same day delivery in all five cities and a four hour window on metro orders placed before 3pm, on a 99.8 per cent on time dispatch rate. Showpo built its reputation on the same principle: speed is a product feature, not an operational afterthought. Neither of them got there by opening warehouses on instinct.
The Second Node Test: Five Gates Before You Sign Anything
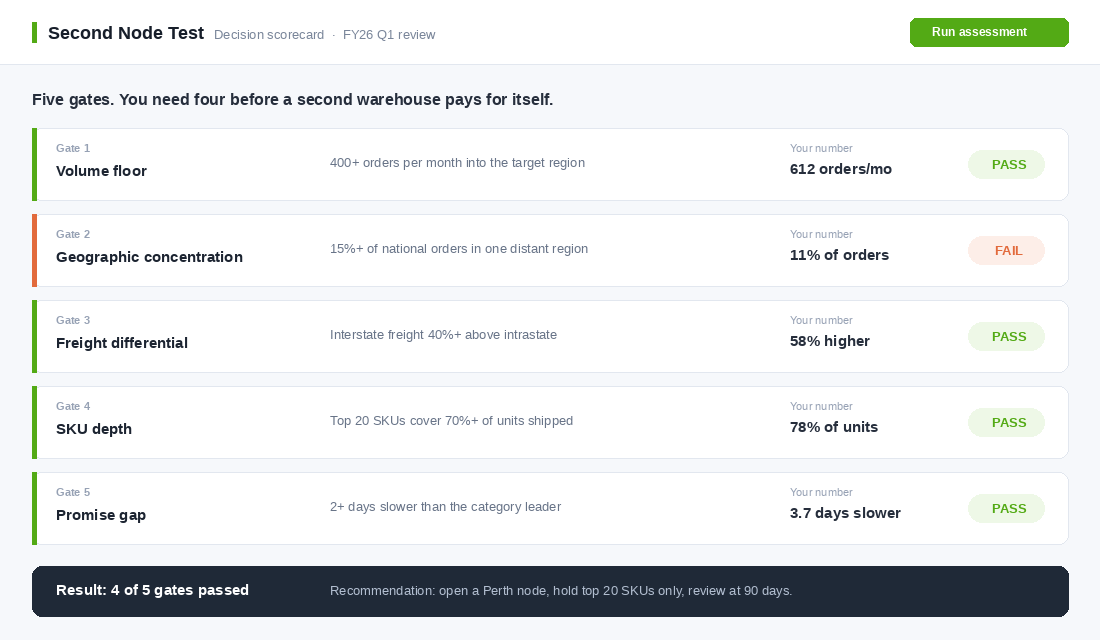
You need four of these five to clear before a second node is worth the complexity. Three or fewer and you are buying yourself an operational headache and a second stocktake for a marginal speed gain.
Gate 1: The Volume Floor
You want at least 400 orders a month flowing into the target region. Below that, your pick and pack rate at the second site will sit at the worst tier on the rate card, your monthly minimum will eat the freight saving, and you will spend more time reconciling two inventory counts than the speed gain is worth.
Pull this from Shopify Analytics. Filter orders by shipping province for the last 90 days, then annualise it. Do not use revenue. Use order count, because the second node charges you per order, not per dollar.
Gate 2: Geographic Concentration
At least 15 per cent of your national orders should be going to the region you are considering. If Western Australia is 6 per cent of your orders, a Perth node is a vanity project. If it is 18 per cent and growing, it is a genuine constraint on your growth.
Context matters here. New South Wales alone accounted for 28.5 billion dollars of online spend, roughly one in every three dollars spent online in Australia. If your state mix is wildly different from the national mix, that is information. It usually means either your product skews to a particular market, or your delivery promise has already trained a region not to buy from you.
Gate 3: The Freight Differential
Compare your average cost to ship a parcel from your current node into the target region against the cost to ship it locally within that region. You want the interstate number to be at least 40 per cent higher. If it is only 15 per cent higher, the freight saving will never fund the duplicated inventory.
Run this on your actual parcel profile, not the rate card. Take your last 500 orders to the target region, get the real billed weights and cubic dimensions, and price them both ways. Heavy or bulky products almost always clear this gate. Small, light, high value items often do not.
Gate 4: SKU Depth
Your top 20 SKUs should cover at least 70 per cent of units shipped. This is the gate most founders fail and the one that quietly kills the economics.
A second node only works if you can stock a narrow slice of your catalogue there. If your demand is spread evenly across 300 SKUs, you either duplicate the entire catalogue (which doubles your working capital) or you split half your orders across two sites and pay two lots of freight on the same order. A long tail catalogue is an argument for one warehouse, not two.
Gate 5: The Promise Gap
Buy from your three closest competitors, shipping to the target region. Record the delivery promise shown at checkout and the actual days to doorstep. If you are more than two days slower than the fastest of them, you have a commercial problem, not just a logistics one.
This gate matters more than founders expect because the promise itself converts. Showing a specific delivery date at checkout, rather than a vague range, has been shown to lift checkout conversion by 13 to 25 per cent. You cannot show a confident date you cannot hit.
The Cost Stack Nobody Models Before They Commit
When founders build the business case, they model two things: freight saved and orders gained. Then the first quarterly P and L lands and the number is nothing like the model. Here is what gets left out.
- Duplicated safety stock. Two nodes each need buffer cover. Splitting 1,000 units across two sites does not give you the same service level as 1,000 units in one site. You typically need 15 to 30 per cent more total inventory to hold the same stockout risk, and that cash comes straight off your working capital.
- A second monthly minimum. Most Australian 3PLs charge a storage minimum plus an account minimum. Two accounts means two floors, and the smaller node will sit below its floor for the first two quarters.
- Inter-node transfer freight. Demand never lands exactly where you forecast. You will move stock between sites, and every transfer is freight you paid twice on the same unit.
- Split order freight. Any order containing one SKU from each node ships as two parcels. Model this at 8 to 15 per cent of orders unless your catalogue is unusually concentrated.
- Systems and people time. Two stocktakes, two sets of receiving paperwork, two carrier accounts to reconcile, and a returns flow that now has to decide which site the item goes back to.
Model those five line items honestly and a lot of second node business cases turn into “renegotiate your carrier mix instead”. That is a legitimate outcome of running the test. It is also a far cheaper one. If you have not yet built a clean view of what each order actually costs you to serve, start with the contribution margin work before you add a second site on top of numbers you do not trust.
The other number to run first is the cash impact. A second node front loads inventory spend by a quarter or more, which lengthens the gap between paying your supplier and collecting from your customer. Run it through your cash conversion cycle before you commit, because the brands that get hurt by this decision are almost never hurt by the freight. They are hurt by the cash locked up in the second pile of stock.
Where the Second Node Actually Goes
Assume your first node is in Sydney or Melbourne, because most Aussie brands start on the east coast. The second site is then one of three choices, and the right answer is driven by your order mix rather than by which city you happen to live in.
- Perth, if Western Australia is 12 per cent or more of orders. This is the highest impact move available, because it is the route where a single node performs worst. You are converting a five to nine day promise into a one to two day promise. Nothing else in your fulfilment network produces that size of swing.
- The opposite east coast city, if Sydney and Melbourne are both above 25 per cent. A Sydney plus Melbourne pair covers the majority of national demand at intrastate rates and gives you redundancy if one site goes down during peak. The speed gain per order is smaller, but it applies to far more orders.
- Brisbane, if Queensland plus northern New South Wales is climbing past 20 per cent. This is the sleeper option. Queensland has strong regional delivery volume, and a Brisbane node pulls a lot of long tail regional postcodes into a shorter transit band.
Adelaide is almost never the right second node. It is well served from Melbourne on a short line haul, and the incremental volume rarely clears Gate 1. Treat it as a third or fourth node question, not a second one.
One practical note on partners. Several Australian 3PLs now run multi site networks specifically so you can add a node without opening a second commercial relationship. That matters more than the rate card, because a single provider across two sites gives you one integration, one invoice, and one team to hold accountable when something goes wrong. If you are still choosing a partner, work through the 3PL selection process first and make multi site capability a scoring criterion, even if you only need one site today.
How to Split the Stock: The 80/20 Allocation Rule
The mistake is mirroring your catalogue. Do not do it. The second node carries a deliberately narrow range, and everything else keeps shipping from the primary site.
Here is the allocation method that works:
- Rank SKUs by units shipped into the target region over the last 12 months, not by revenue. Units drive pick volume and stockout risk.
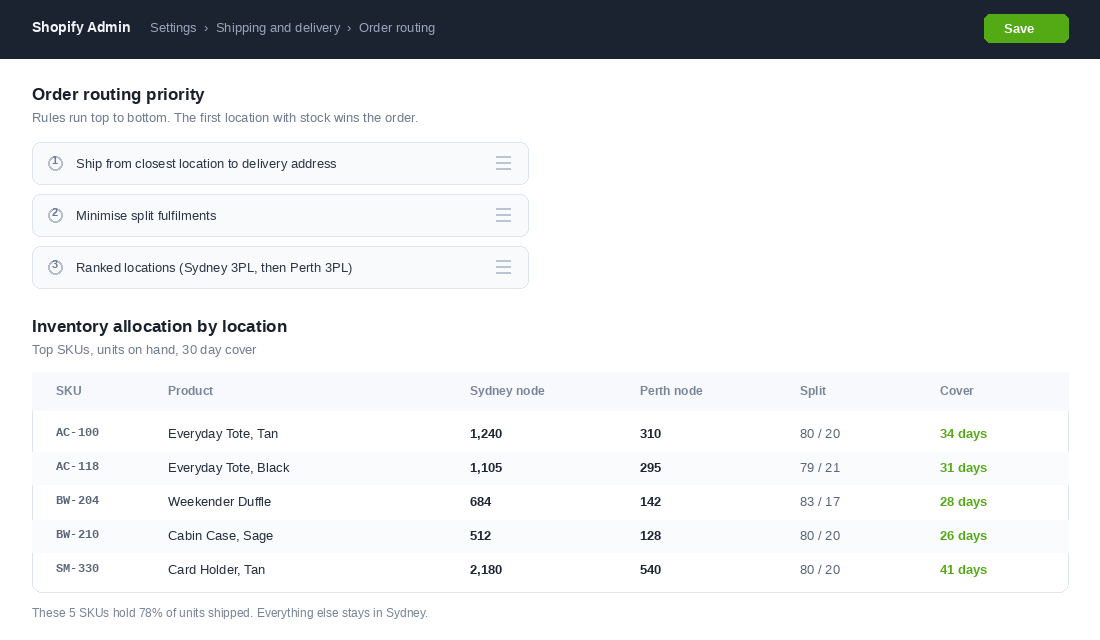
- Cut the list at 70 per cent of regional units. For most brands that lands between 15 and 30 SKUs. Those are your second node SKUs. Nothing else goes.
- Allocate stock in proportion to regional demand, plus a buffer. If Western Australia is 20 per cent of units for that SKU, send 20 per cent of stock plus roughly a quarter again as buffer, because the smaller node has less pooling to absorb a spike.
- Set a minimum cover of 28 days at the second node. Below that you will be running emergency transfers, which cost more than the freight you set out to save.
- Review the SKU list quarterly. Demand moves. A SKU that earned its place in February may not earn it in August, and dead stock at the second node is dead stock you now have to pay to bring home.
The discipline here is refusing to expand the list. Every extra SKU at the second node adds carrying cost and adds split order risk. If a customer in Perth orders one fast moving item and one long tail item, that order ships as two parcels from two states, and you have just paid more than if you had shipped the whole thing from Sydney.
Setting Up Order Routing in Shopify, Step by Step
Shopify handles this natively, and a surprising number of brands add a second node and then never configure the routing, which means orders get assigned on default priority and the whole exercise achieves nothing. Get this right on day one.
- Create the location. Settings, then Locations, then Add location. Use the physical address of the 3PL site, not your office, because Shopify uses it to calculate proximity and rates.
- Confirm it is set to fulfil online orders. A new location will not receive orders until this is ticked.
- Open Settings, then Shipping and delivery, then Order routing. This is where the priority rules live.
- Order the rules deliberately. Put Ship from closest location to delivery address at the top so proximity wins. Add Minimise split fulfilments second so a single site fulfils whole orders where it can. Use Ranked locations as the tiebreaker, with your primary node ranked first so it absorbs anything ambiguous.
- Set stock levels before you go live. Transfer inventory to the new location in Shopify so the routing engine has something to route to. A location with zero stock is invisible to the rules.
- Test with real postcodes. Place test orders to a Perth 6000 address, a regional WA address, and a Sydney address. Confirm each lands at the location you expect before you switch on live traffic.
On top of the native routing, add a shipping platform that rate shops at dispatch. Starshipit and Shippit are both built for the Australian and New Zealand carrier mix and will pick the cheapest compliant service per parcel across Australia Post, Aramex, Team Global Express and the rest. Setup is straightforward: connect your Shopify store, load your carrier accounts, build rules by weight band and destination zone, then map each Shopify location to the carrier accounts available at that site. Give it a fortnight of live orders before you judge the savings, because the first week will be full of edge cases you need to write rules for.
Once the routing is live, update your delivery promise on the product page and at checkout. This is the step that converts the operational win into a commercial one. There is no point cutting Perth transit from six days to two if your site still says “5 to 9 business days”. If you want the full treatment on this, the delivery promise playbook covers how to display dates you can actually hit.
The 90-Day Scorecard That Tells You If It Worked
Set these six numbers before you open the second node, take a baseline, then review at 30, 60 and 90 days. If you do not baseline first, you will spend the next year arguing about whether it worked.
- Average transit days to the target region. The headline number. You should see it fall by at least two days inside 30 days or something is wrong with your routing.
- Freight cost per parcel to the target region. Blended across both nodes. Watch for split orders quietly dragging this back up.
- Conversion rate by state. Segment your Shopify analytics by shipping province. A faster promise should show up here within 60 days.
- Split fulfilment rate. The percentage of orders shipping from more than one location. If it climbs above 15 per cent, your second node SKU list is too broad.
- Total units on hand across both nodes. This is your inventory tax. Track it against the same service level you had before.
- Repeat purchase rate for the target region. The slowest number to move and the one that pays for everything. Delivery experience drives repeat behaviour more reliably than most brand spend does.
Review the SKU allocation at the 90 day mark, not before. Demand data from a node that has been live for four weeks is noise. Give it a full quarter, then cut the SKUs that did not earn their storage and add the ones that have started to.
How the Pieces Compound
Taken individually, each part of this looks like an operations chore. Together they form a loop that keeps paying.
A faster promise lifts checkout conversion on the orders you already had. Those extra orders raise volume at the second node, which pushes you into a better tier on the rate card, which lowers cost per parcel. A better delivery experience raises the repeat purchase rate in that region, which lifts lifetime value, which raises what you can afford to pay to acquire a customer there. That in turn lets you bid harder on paid channels in a market where your competitors are still quoting a week.
The loop runs backwards just as well. A slow promise suppresses conversion, which keeps volume low, which keeps you on a bad rate card, which makes the second node look uneconomic, which locks in the slow promise. Plenty of Aussie brands have been sitting in that loop for years and have concluded that Western Australia simply is not a strong market for them. It usually is. They have just never given it a reason to be.
The decision itself is not the hard part. The hard part is being honest about the four gates you pass and the one you do not, and being willing to hear that the answer this year is a better carrier mix rather than a second warehouse. Run the test properly and you will know which one you are looking at inside a fortnight.
Your Second Node Checklist
- Pull 90 days of orders by shipping province and 12 months of units by SKU by region
- Score all five gates. Four passes minimum before you proceed
- Model the full cost stack, including duplicated safety stock and split order freight
- Choose the node by order mix, not by convenience
- Cut the SKU list at 70 per cent of regional units and refuse to expand it
- Configure Shopify order routing before go live, then test with real postcodes
- Update the delivery promise on the product page and at checkout
- Baseline the six scorecard numbers, review at 30, 60 and 90 days
- Re-cut the SKU allocation at 90 days, not sooner
A second node is a bigger commitment than most brands expect. Before you sign anything, work through how to decide when to outsource fulfilment and how to choose an Australian 3PL so you are choosing a partner against your real order profile rather than a sales deck.
Inside eCommerce Circle, fulfilment economics is one of the core pillars we work on with every member, because it sits right where operations and profit meet. If you want a second opinion on whether your numbers justify a second node, let’s talk.