Open your Shopify dashboard. Then open Meta Ads Manager. Then open Google Ads. Add up what the platforms claim they generated for you last month, and compare it to what actually landed in your bank account. The platform total will be bigger, and usually by a wide margin.
What’s in This Article
That gap is not a tracking bug you can fix with one more pixel. It is the predictable result of letting every platform mark its own homework.
Australians spent a record 82.6 billion dollars online in 2025, up 14 percent year on year, and online now accounts for roughly 24 percent of total retail spend. There is more money moving than ever. There is also more competition for it, and the average online transaction has slipped to about 96 dollars, around 10 dollars below where it sat in 2020. Thinner baskets mean the true cost of buying an order matters more than it did five years ago.
Here is the number that should bother you. Across 225 geo-based incrementality tests run on direct-to-consumer brands between August 2024 and December 2025, the median incremental return on ad spend came in around 2.31x. Branded search, the channel almost every operator treats as untouchable, returned a median of 0.70x. That sits below the 1.00x breakeven line. Half the brands tested were paying for orders they would have received anyway.
Most operators respond to attribution chaos by buying another attribution tool. That is the wrong move. A better model of a guess is still a guess. What you need is an experiment: turn something off, watch what happens to real revenue, and let the market answer the question.
That is incrementality testing. Here are the five tests, ordered from the one you can run this week to the one that will genuinely change how you set a budget.
Why Every Platform Reports More Revenue Than Your Bank Account Received
Three things stack on top of each other to inflate the numbers in your dashboards.
- Overlapping credit. Meta, Google and your email platform can all claim the same order. Nobody deducts what the others claimed. Add up the platform revenue for a busy month and you will often find 130 to 160 percent of your actual sales accounted for.
- View-through and long windows. A 7-day click plus 1-day view window means an impression somebody scrolled past on Tuesday gets credit for a Sunday purchase they were always going to make.
- Modelled conversions. Since the iOS privacy changes, a meaningful share of reported conversions are statistical estimates, not observed events. Estimates drift optimistic.
The practical result is well documented. Platform-reported return typically overstates true contribution by 15 to 40 percent, and measured incremental return commonly lands 30 to 60 percent below the number in the dashboard. Published case studies from brands including Bombas, True Classic and Liquid Death show overstatement in the 1.5x to 3x range, with the widest gaps on brand search and retargeting.
Attribution asks the wrong question. It asks which touchpoint deserves the credit. Incrementality asks the only question that affects your P and L: would this order have happened if I had not spent the money?
Once you frame it that way, three types of wasted spend become visible.
- Demand you already own. Brand search, and retargeting people who had already added to cart and were coming back regardless.
- Demand you cannibalised. The order was coming through organic, email or direct, and the paid click simply got there first and took the credit.
- Demand that does not exist. Audiences that were never going to buy at any frequency, which is where prospecting budget quietly dies.
Test 1: The Spend Pulse, The Cheapest Test You Can Run This Week
You do not need a data team or a new subscription to start. You need the nerve to switch something off.
A spend pulse is simple. Turn one channel or campaign completely off, nationally, for a defined window. Then watch total store revenue and total store orders. Not the channel’s own reported number. Total.
The rules matter more than the mechanics.
- Pick a channel worth 5 to 15 percent of total spend. Small enough that a bad result will not sink the month. Big enough that the effect is visible above the noise.
- Run it for at least 14 days, ideally 21. Anything shorter and you are measuring a weekday pattern.
- Change nothing else. No new creative, no price moves, no extra email sends, no influencer drops.
- Pick a clean window. No public holiday, no EOFY hangover, no Afterpay Day, no product launch.
- Write down your prediction before you start. If you cannot say what you expect to happen, you are not running a test, you are just turning things off.
The read is blunt. If you cut 12 percent of spend and total orders fall 2 percent, you found money. If orders fall 11 percent, that channel is doing real work and you should leave it alone.
The honest limitation: a before-and-after comparison is contaminated by seasonality and trend. Treat a spend pulse as a signal strong enough to justify a proper test, not as proof. It costs nothing, and it will usually tell you which channel deserves the rigorous treatment next.
Test 2: The Brand Search Holdout, The Test That Pays For The Programme
This is where most Australian brands find the biggest cheque, and it is the test operators resist hardest.
When somebody types your brand name into Google, the decision is already made. The only question is whether the paid ad captured an order that your free organic result would have captured anyway. In most accounts, the answer is that it captured a large share of them.
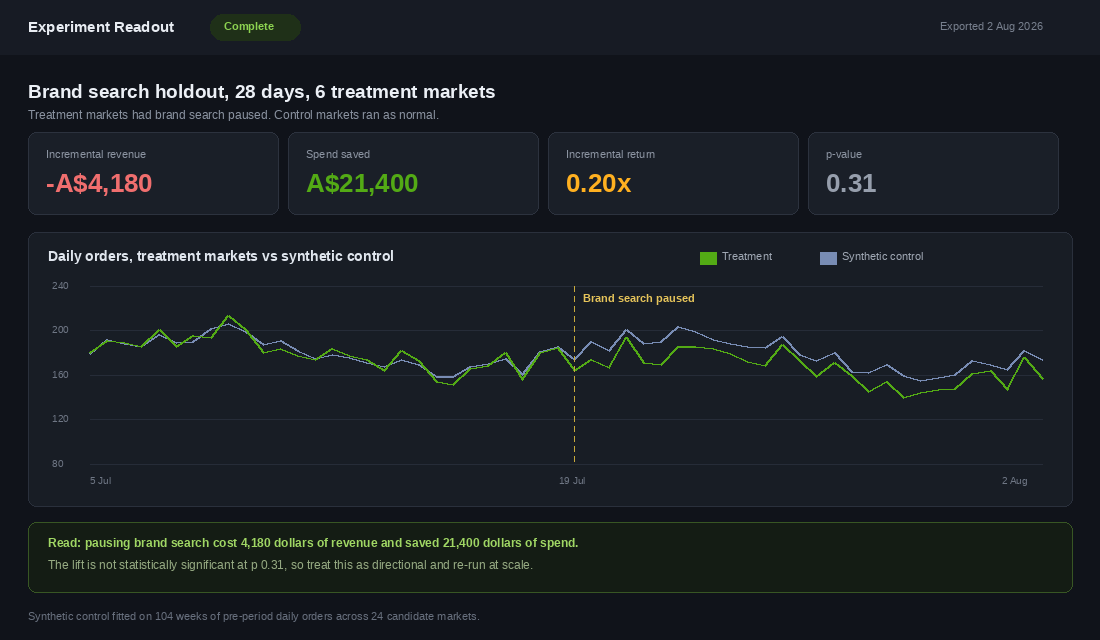
The evidence is consistent. Branded search returned a median incremental return of 0.70x across that 225-test dataset, the lowest of any channel measured. A published series of three separate incrementality tests reached the same conclusion: brand search was not producing incremental orders.
How to run it
- Pause your branded campaigns in selected states or metro areas for 21 to 28 days. If your Google account cannot split geographically at that granularity, pause nationally and accept a weaker design.
- Track combined branded revenue, paid plus organic, not paid alone. The whole point is to see whether organic absorbs the traffic.
- Watch your organic click share on branded terms in Search Console. A sharp rise there while total branded revenue holds steady is your answer.
- Calculate the saving. Spend that no longer buys orders is the same as revenue at 100 percent margin.
There are real cases where brand search earns its place. When a competitor is bidding on your name. When a marketplace listing on Amazon Australia or eBay is outranking your own store. When the mobile results page pushes your organic listing below the fold. Our brand search defence playbook walks through when to hold the line and when to let it go.
Run the test before you decide, not after.
Test 3: The Geo Holdout, The Gold Standard Without A Data Team
A geo holdout is the strongest test most Shopify brands can actually run. You split the country into markets, change spend in some of them, hold the rest steady, and compare.
Australia suits this well. Distinct metro and regional markets, clean postcode and state data in every Shopify order, one currency, one language, and no state borders that change buying behaviour the way a national border would.
The six steps
- Export the history. Pull 18 to 24 months of daily orders by city or state from Shopify. Analytics, then Reports, then Sales by location, exported to CSV.
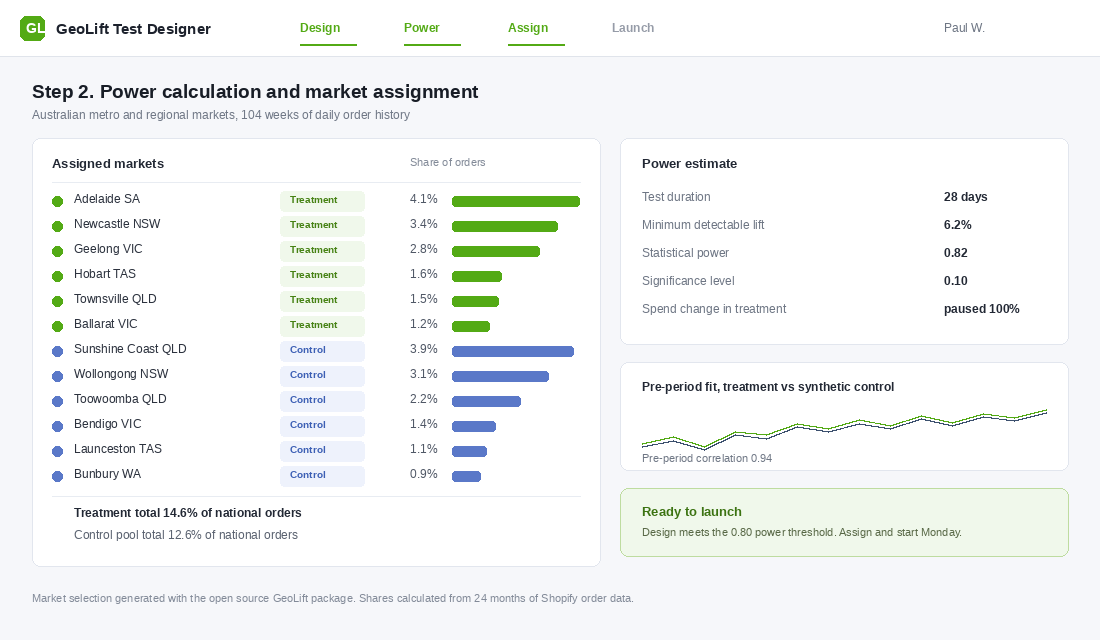
- Choose treatment markets. Aim for 10 to 20 percent of national orders in total. Mercado Libre, which has now run 20 of these experiments in house, used a treatment group representing about 15 percent of national conversions in one published test.
- Choose control markets. You want markets whose pre-period order pattern tracks your treatment group closely. A pre-period correlation above 0.90 is a good sign.
- Change spend in treatment only. Either pause the channel completely or cut it by 50 percent. The Mercado Libre test used a 50 percent reduction, which is gentler on revenue and still detectable.
- Run for 28 days minimum. Shorter windows rarely reach the statistical power to detect a realistic effect.
- Compare against a synthetic control. Rather than one matched market, you build a weighted blend of control markets that best reproduces your treatment group’s pre-period behaviour, then measure the gap after launch.
The tool: Meta GeoLift
GeoLift is Meta’s open source geo-experiment package. It is free, it runs in R, and it handles both the design and the analysis. Setting it up takes about an hour.
- Install R version 4.0.0 or newer.
- In the R console, run
install.packages("remotes"). - Install the synthetic control dependency, then run
remotes::install_github("facebookincubator/GeoLift"). - Shape your Shopify export into three columns: location, date, and Y, where Y is daily orders or daily revenue for that market.
- Run
GeoLiftMarketSelection()to have the package choose your treatment markets and recommend a test duration. - Run
GeoLiftPower()to check the minimum lift your design can actually detect. If the minimum detectable lift is larger than the effect you expect, the test will not answer your question and you need a longer window or a bigger treatment group. - After the test, run
GeoLift()to get lift, a confidence interval and a p-value.
Two practical notes for Australian stores. Exclude any market where you run retail, wholesale or pop-up activity, because offline demand will pollute the signal. And do not put both Sydney and Melbourne in the treatment group. Keep at least one large market in control so your synthetic control has something to work with.
If you sell across more than one channel, the geo design has an advantage nothing else offers. HexClad used geo holdouts specifically because they could measure the causal impact across both Shopify and Amazon at once, over the full length of the customer’s purchase journey. In-platform tools cannot see beyond their own walls.
Test 4: In-Platform Conversion Lift, When Meta Will Run It For You
Meta Conversion Lift is a randomised holdout run inside the platform. Meta withholds a slice of your target audience, shows them nothing from you, and compares their conversion rate to the group that saw your ads.
The design is genuinely good. Randomisation happens at the user level, which is cleaner than splitting by geography, and there is no data engineering on your side.
The constraints are real too.
- Scale. Meta typically wants a minimum audience of around 200,000 and holds back roughly 10 percent as the control group. Small audiences will never reach significance.
- Scope. It measures Meta only. It cannot tell you whether the demand simply moved to Google or to email.
- Who grades it. Meta is measuring Meta. It is still the only test where the platform shows its working, so it is worth running, but treat it as one input rather than the verdict.
With Meta ecommerce campaigns delivering a median reported return around 2.79x in 2026, and the median across all ecommerce sitting closer to 2.04x, the brands that can power a Conversion Lift test are generally spending well into five figures a month on the channel. Google offers a comparable ghost-bid lift study through account reps for larger advertisers.
The practical test of eligibility: ask your Meta rep. If you do not have one, you are almost certainly below the threshold, and the geo design in Test 3 is your path.
Test 5: The Scale Test, Turning One Result Into A Budget Rule
Here is the mistake that follows a successful first test. You learn that Meta prospecting returned 2.10x incrementally at your current spend, so you decide to double the budget.
That does not follow. Incremental return at 30,000 dollars a month tells you nothing about incremental return on the 30,001st dollar. Every channel has diminishing returns, and the only question that matters when you are setting a peak budget is what the next dollar does.
A scale test uses the same geo design, but instead of pausing the channel in treatment markets, you increase spend by 50 to 100 percent. Then you measure the return on the extra money only.
- Incremental revenue equals treatment revenue minus synthetic control revenue.
- Incremental spend equals treatment spend minus the control-equivalent spend for those markets.
- Marginal incremental return equals incremental revenue divided by incremental spend.
Now set the rule. Keep scaling while marginal incremental return stays above your breakeven, and your breakeven comes from contribution margin, not from a number your agency likes. If your contribution margin after cost of goods, shipping and payment fees is 45 percent, breakeven is 1 divided by 0.45, which is about 2.22x. Above that you are buying profitable growth. Below it you are buying revenue with your own cash.
That single threshold ends most budget arguments, because it replaces opinion with a decision rule. Pair it with a blended view of the whole business using our marketing efficiency ratio guide, so you are checking the top-down number and the bottom-up number against each other.
How To Read A Result Without Fooling Yourself
The tests are the easy part. Reading them honestly is where operators come unstuck, usually because the result threatens a channel somebody has defended for two years.
- Decide the decision first. Before launch, write down what you will do at each outcome. If no result would change your behaviour, do not run the test.
- Use a significance threshold of 0.10, not 0.05. You are making a budget call, not publishing a paper. Demanding academic certainty means you will never act.
- Report the interval, not just the estimate. An incremental return of 1.8x with a range of 0.9x to 2.7x is an honest answer. Quoting only the 1.8x is not.
- A null result is still information. It means the effect is smaller than your test could detect. That is often exactly what you needed to know.
- Never re-run until you like the answer. Testing until you get the result you wanted is how brands justify keeping spend that does nothing.
- Hold your tracking constant. If your UTM conventions shift mid-test, the data is noise. Lock them first with our UTM tracking playbook.
- One variable at a time. A test with two changes produces a result you cannot act on.
The single most common way a test gets ruined is running it across a promotion. A flash sale, a launch, a public holiday weekend, or a competitor’s big campaign will all swamp the effect you are trying to measure. Guard the window.
The Data Hygiene That Makes Any Test Readable
An incrementality test is only as trustworthy as the order data underneath it. Before you switch anything off, spend a day on four checks. Skip them and you will run a clean 28-day holdout and then argue about whether the result is real, which is the worst possible outcome because it costs you the spend and gives you nothing.
One source of truth for orders. Use Shopify order data, not platform-reported conversions, as the outcome variable. Every test in this playbook measures orders and revenue in your own admin. If your Shopify and GA4 revenue numbers sit more than 5% apart, fix that first, because you will spend the whole test arguing about which number to read.
Clean the noise out of the baseline. Exclude wholesale, B2B, staff and test orders, and flag any order that came through a discount code tied to a one-off promotion. A single influencer drop or a $40k wholesale order landing inside a holdout window can swing a geo test result by more than the effect you are trying to measure.
Know your natural weekly variance. Pull 24 months of weekly revenue and calculate the standard deviation. Most Australian DTC brands sit somewhere between 12 and 22% week to week. If your natural variance is 18%, a test that produces a 9% difference has told you nothing, and you need either a longer window or a bigger holdout. This single number is what separates founders who read results correctly from founders who read noise.
Stabilise tracking before you start, then leave it alone. Server-side tracking, consent mode and the conversions API all change reported numbers when you touch them. Get your conversion tracking and server-side setup settled, then freeze all measurement changes for the duration of the test. Any change mid-flight and you have two variables, which means you have no test.
How To Present A Result To An Agency That Disagrees With It
Sooner or later a test will show that a channel your agency has been reporting as a 4.2x ROAS hero is delivering closer to 1.6x incremental. That conversation goes badly if you lead with the conclusion. It goes fine if you lead with the method.
Share the design before the result, ideally before the test runs. Agree the outcome metric, the window, the holdout markets and what would count as a meaningful difference, and get all four in writing. An agency that has signed off on the design cannot dismiss the outcome as a methodology problem, and most good agencies will improve your design when asked.
When you present, put four things on one page: the design, the raw numbers, your natural weekly variance for context, and the budget decision you are proposing. Frame the decision as a reallocation rather than a cut. “We are moving $18k a month from this channel into the two that tested incremental, and we will retest this one in 90 days” is a partnership conversation. “This channel does not work” is a fight.
Then hold the retest promise. Incrementality is not a verdict, it is a reading at a point in time. Creative changes, competitors pull back, seasonality shifts, and a channel that tested flat in March can test genuinely incremental in October. Founders who retest quarterly end up with a budget that moves with reality. Founders who test once end up with a new set of assumptions that are just as stale as the old ones, only more expensive to hold.
The Compound Effect: What Changes When You Budget On Incremental Return
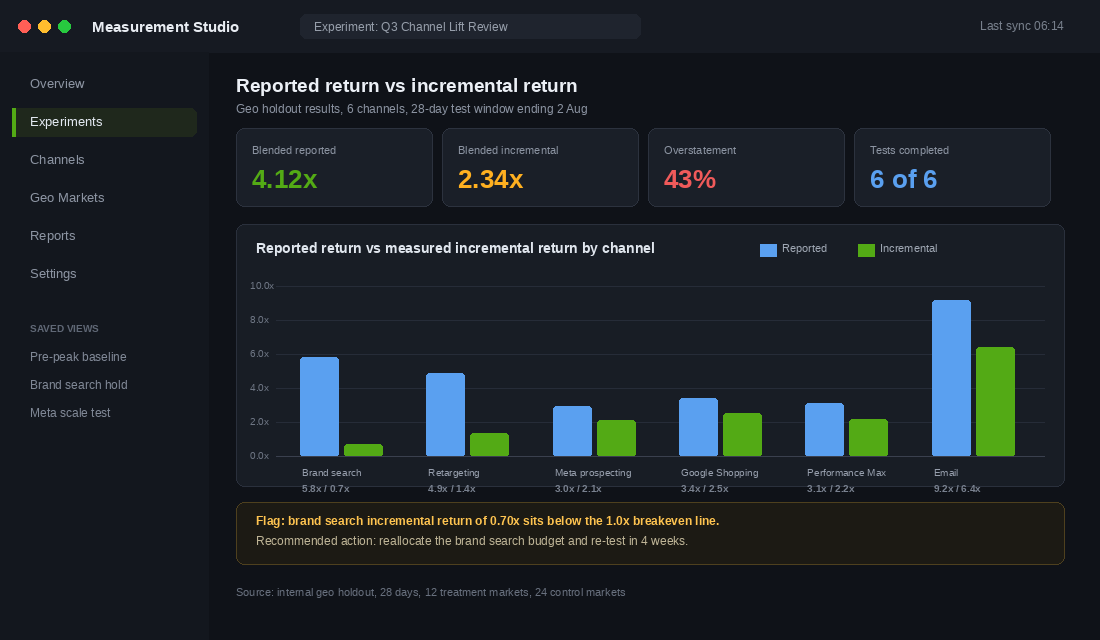
Take a store spending 100,000 dollars a month across channels, showing a blended reported return of 4.12x. Testing reveals the true blended figure is 2.34x, a 43 percent overstatement, which is squarely in the range the published benchmarks predict.
The tests also show where the gap lives. Brand search at 0.70x, consuming 12,000 dollars a month. Retargeting at 1.35x, consuming 14,000. Prospecting at 2.10x and Google Shopping at 2.55x, both above the 2.22x breakeven.
Move 18,000 dollars of that 26,000 into the two channels above breakeven and leave the rest as saved spend. Same total budget, roughly 24,000 dollars more incremental revenue a month, and not one new creative was produced.
The second-order effect is bigger and slower. Your reporting stops lying, so your revenue forecast stops lying, so your stock buy stops being wrong. That matters right now. If you are placing peak orders in August for delivery in November, every dollar of phantom revenue in the forecast becomes real dollars of dead stock in January.
The third effect is cultural. Your media buyer, your agency and your finance person stop arguing about which dashboard is correct, because there is now one number that everybody agreed on before the test started. Meetings get shorter. Decisions get faster.
Your 12-Week Pre-Peak Testing Calendar
BFCM is roughly 16 weeks out. That is enough time to run three tests properly and set your peak budget on evidence instead of on last year’s dashboard. Here is the sequence.
- Weeks 1 to 2, baseline. Export 24 months of orders by location. Lock your UTM conventions. Calculate your true contribution margin and convert it into a breakeven marginal incremental return.
- Weeks 3 to 4, spend pulse. Switch off your smallest paid channel for 21 days. Measure total store revenue only. Write your prediction down first.
- Weeks 5 to 8, brand search geo holdout. Pause branded campaigns in markets totalling 12 to 15 percent of national orders for 28 days. Track paid plus organic branded revenue combined.
- Weeks 9 to 12, scale test. Increase spend 75 percent in treatment markets on your largest prospecting channel. Calculate marginal incremental return on the extra dollars.
- Week 12, set the budget. Allocate peak spend by marginal incremental return, channel by channel, against your breakeven.
- From 1 November, freeze all testing. Peak is not a laboratory. Run what the evidence told you to run.
What a valid test needs, every time
- A written prediction and a written decision rule, both dated before launch.
- A treatment group between 10 and 20 percent of national orders.
- A pre-period correlation above 0.90 between treatment and control.
- A minimum window of 28 days, with no promotion, holiday or launch inside it.
- One variable changed, and nothing else touched.
- A result reported as a range with a p-value, not as a single confident number.
Print that list. Tape it above the desk of whoever runs your paid media. Six lines is the difference between an experiment and an expensive guess.
Start With The Channel You Would Defend Hardest
Whichever channel you just thought of and immediately decided was too important to test is the one to test first. That instinct is not analysis. It is the sunk cost of two years of dashboards telling you what you hoped to hear.
You do not need a measurement platform to begin. You need 24 months of Shopify order data, one channel switched off in a few markets, 28 days of patience, and the willingness to act on what comes back.
Inside eCommerce Circle, measurement discipline is one of the core pillars we work on with every member, because it sits underneath every other decision a founder makes about spend, stock and staffing. If you want a second opinion on yours before you commit your peak budget, let’s talk.