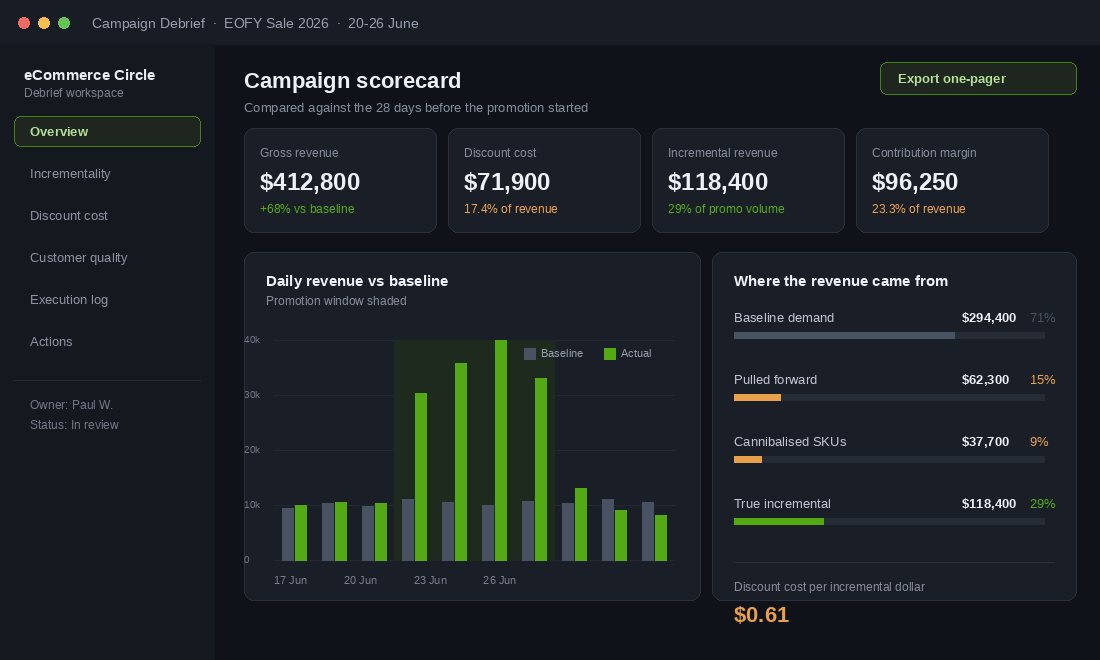
Your EOFY sale did 412k in a week. The team screenshots the Shopify dashboard, drops it in Slack with a rocket emoji, and everyone moves on to planning the next one. Nobody asks the only question that matters: how much of that money would have arrived anyway?
What’s in This Article
This is the most expensive habit in Australian ecommerce. We run promotion after promotion, judge each one on top-line revenue, and never find out which ones actually made us richer. A landmark study of six FMCG categories by Ailawadi, Lehmann and Neslin found that 53% of analysed promotions generated negative economic profit once pull-forward and cannibalisation were properly accounted for. More than half of them lost money, and the brands running them had no idea, because the revenue number looked great.
The fix is not a smarter promotion. It is a debrief. Sixty minutes, a fixed agenda, and a data pack you build before anyone walks in the room. Do it after every campaign and within four promotions you will be running a materially more profitable calendar. Here is the exact process we use with members.
Why most campaign reviews are just a revenue victory lap
Watch what happens in a typical post-sale meeting. Someone reads out revenue, orders and sessions. Someone else says the creative felt strong. A third person mentions the warehouse was slammed on day two. Then the calendar comes out and the group starts arguing about whether the next sale should be 25% or 30% off.
Nothing in that conversation tells you whether the promotion was worth running. Revenue during a sale is guaranteed to go up. That is what a discount does. The question is whether the extra volume paid for the margin you gave away, the customers you trained to wait, and the orders you stole from next month.
The maths is unforgiving because discounts come off the top line while your costs stay put. Take a 20% discount on a product with a 50% gross margin. Your margin falls to 37.5%, which is a 25% reduction in profitability on every unit sold. You need a very large volume lift just to stand still, and most operators never calculate what that break-even lift actually is.
Step 1: Build the data pack before anyone opens their mouth
A debrief run on opinions becomes a debate about creative. A debrief run on a data pack becomes a decision. Build the pack yourself, or hand it to one person with a deadline, and circulate it 24 hours before the meeting.
Pull these eleven fields for the promotion window, and the same fields for the 28 days immediately before it:
- Gross revenue and order count. Split by day, not just the total.
- Total discount value. Shopify reports this natively, and it is almost always higher than people guess.
- Average order value. Compare to the pre-promotion baseline, not to last year’s sale.
- Units per order. A sale that lifts revenue but drops units per order is buying volume, not basket size.
- Gross margin dollars. After COGS and after the discount, not the list-price margin.
- Ad spend across every channel for the campaign window plus the seven days of run-up.
- New versus returning customer split.
- Return rate at 30 days, which you will backfill later.
- Shipping and fulfilment cost per order during the peak, including any overtime or freight upgrades.
- Support ticket volume and first response time.
- Stock position going in and coming out, by SKU.
The tool for most of this is already in your admin and most founders have never opened it. In Shopify, go to Analytics, then Reports, and search “discount”. Open Sales by discount. Set the date range to your promotion window, then add the columns for orders, gross sales, discounts and net sales. Group by discount code so each offer appears on its own line. Export to CSV.
Then run the same report for the 28 days before the sale and paste both into one sheet. That single comparison, built in about ten minutes, is the spine of the entire debrief. If you want automation, Lifetimely and Triple Whale will both blend COGS and ad spend into a contribution view, but the free report gets you 80% of the way.
Step 2: Separate the sale you made from the sale you would have made anyway
This is the step that changes how you plan your calendar, and it is the one almost nobody does. Your promotion revenue is made up of four different things, and only one of them is worth paying for.
- Baseline demand. Customers who were going to buy at full price and happily took the discount instead. You paid them to do what they were already doing.
- Pull-forward. Customers who would have bought in three weeks and bought now. You did not gain a sale, you moved one and paid for the privilege.
- Cannibalisation. Orders that shifted from a full-margin SKU to the discounted one.
- True incremental demand. Sales that only happened because of the offer. This is the only bucket that justifies the discount.
Industry decomposition work puts the typical split at roughly 20% of promo volume lost to cannibalisation and 15% to stockpiling, leaving an effective incremental lift of about 30% of the volume you moved. Put plainly: on a normal sale, seven out of every ten dollars were coming anyway.
Here is the version you can actually run without a data team. Take the 28 days before the promotion, strip out any day with unusual spend or a stockout, and calculate your median daily revenue. That is your baseline. Multiply it by the number of promotion days. Subtract that figure from actual promotion revenue and you have your apparent lift.
Now find the trough. Track the 14 days after the sale ends and measure how far daily revenue sits below baseline. That shortfall is your pull-forward, and it comes straight off the apparent lift. What is left is your working estimate of true incremental revenue.
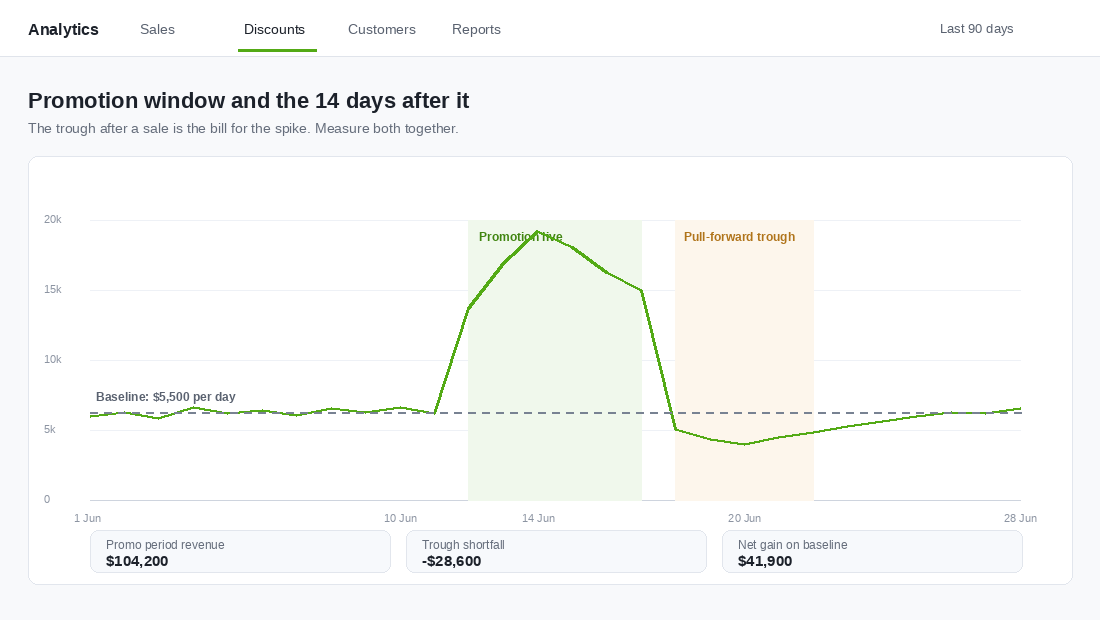
Use this rule of thumb when you read the result. If cannibalisation and pull-forward account for more than 70% of the volume, the event was not a promotion, it was a price cut on demand you already had. Between 40% and 70% there is real incrementality, but the event needs to earn its keep on customer quality rather than margin. Below 40% you found something worth repeating.
Step 3: Cost the promotion properly, not just the discount
Most operators count the discount and stop. The real cost of a campaign has at least six lines, and the ones people forget are usually the ones that turn a modest win into a loss.
- Discount value. Straight from the Sales by discount report.
- Incremental ad spend. Not total spend, the amount above your normal weekly run rate. Include the pre-sale teaser period.
- Free shipping cost. If you dropped your threshold, price the delta on every order that would have paid freight.
- Fulfilment surge cost. Casual hours, overtime, express upgrades to clear a backlog, extra packaging.
- Support cost. Ticket volume times your cost per ticket, plus any refunds issued to fix delivery blowouts.
- Returns. Deep-discount cohorts return at higher rates, so hold a provision and true it up at 30 days.
Add those together and divide by your true incremental revenue. That gives you cost per incremental dollar, which is the single cleanest measure of whether a promotion was worth running. Under 40 cents is strong. Between 40 and 70 cents you are buying growth and need a customer-quality reason to keep going. Above a dollar you paid for the privilege of being busy.
If contribution maths is not yet part of your weekly rhythm, start with our contribution margin playbook before you run your first debrief. The debrief only works if the underlying cost data is honest.
Step 4: Grade the customers the campaign bought you
A promotion is an acquisition channel, so judge it like one. Two campaigns can produce identical revenue and leave you with completely different businesses depending on who walked through the door.
Tag every order from the campaign, then come back at 90 days and pull four numbers for each discount tier: repeat purchase rate, second-order AOV, second-order gross margin, and contribution per customer. Compare all of it to your full-price cohort from the same period.
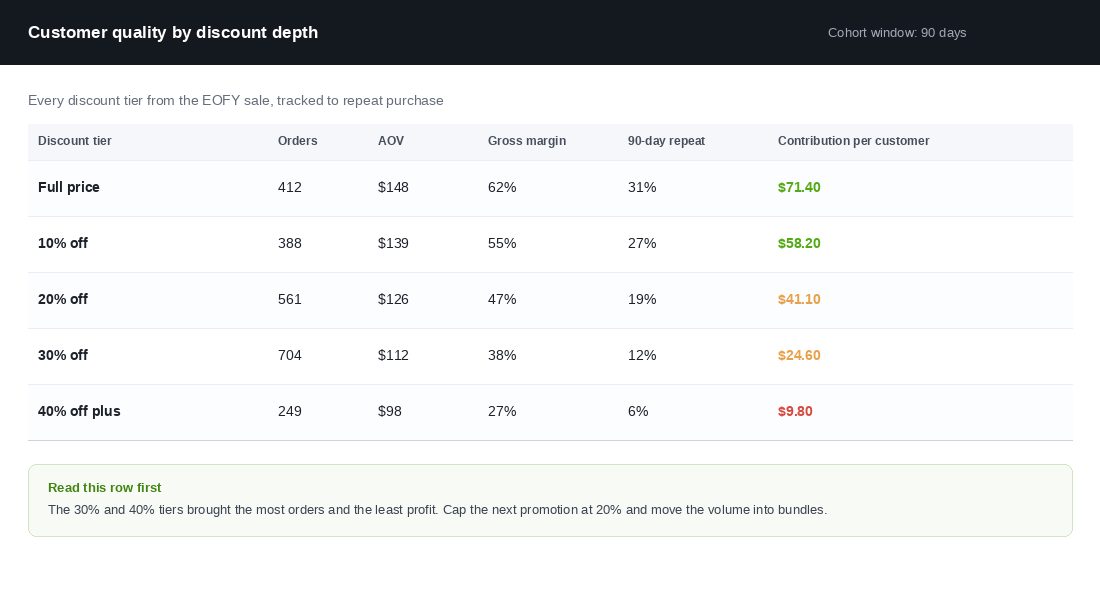
Once you can see repeat rates fall away as discount depth increases, the argument about whether to run 30% or 40% off next time gets settled with evidence instead of nerves. In most Australian stores we work with, the drop-off gets steep somewhere between 20% and 30% off, which is exactly where the tiering in our discount discipline framework is designed to hold the line.
One more cut worth doing. Split the campaign cohort by acquisition source. A customer who came from your email list at 20% off behaves nothing like a customer who came from a cold Meta ad at the same discount. Frequently the email cohort is the one you were paying to discount unnecessarily.
Step 5: Audit the execution, not just the outcome
Numbers tell you whether to run the campaign again. The execution audit tells you how to run it better, and it is the part your team will actually enjoy. Keep it factual and keep it to a timeline.
Walk the campaign in chronological order and log what happened at each point:
- Planning. Was the offer locked at least two weeks out, or was it still being argued about on launch morning?
- Assets. Which creative was ready on time and which was made at midnight? Note the version that carried the best click-through.
- Site. Did anything break? Log page load times during the peak hour, cart errors, and any app that fell over under load.
- Stock. Which SKUs sold out early and which never moved? An early sellout on a hero SKU is lost margin, not a win.
- Fulfilment. Dispatch time on the busiest day versus your normal service level.
- Support. The top three ticket reasons during the campaign. These are usually free CRO instructions.
- Comms. Email and SMS send times, open rates, unsubscribe rate. A spike in unsubscribes is a cost you paid without recording it.
Give each line a simple rating: keep, fix, or drop. Anything marked fix becomes an owned action with a date. Anything marked drop goes on a written stop-doing list that gets read out at the start of the next campaign brief.
Step 6: Run the sixty minute meeting
Book it for the Tuesday after the campaign ends, while memories are sharp and before the next brief starts. Sixty minutes, no more. Everyone who touched the campaign attends, including the person who packs the boxes.
The agenda that keeps it on the rails:
- 0 to 10 minutes: the numbers, read out, no discussion. One person reads the scorecard. Nobody explains or defends anything yet.
- 10 to 25 minutes: incrementality and cost. What was truly incremental, and what did each incremental dollar cost.
- 25 to 35 minutes: customer quality. Who did we buy, and at what depth.
- 35 to 50 minutes: execution timeline. Keep, fix, drop on every line.
- 50 to 60 minutes: three decisions. Run it again yes or no, the maximum discount depth next time, and the one change with the biggest expected impact.
Two rules make or break the meeting. First, no blame: you are auditing a system, and the moment it becomes personal people stop telling the truth. Second, every decision gets an owner and a date before anyone leaves, otherwise you have run a very expensive book club.
What two Australian retailers proved about promotional discipline
If you think this is theory, look at what the listed Aussie retailers have been doing, because they publish their homework.
Adore Beauty lifted gross margin to a record 35.3% in FY25, up roughly 190 basis points year on year. Management put it down to owned brands, retail media and a deliberately reduced promotional cadence. They ran fewer, tighter promotions and kept more of every dollar.
Baby Bunting went further. By pulling back heavy promotional activity, simplifying price architecture and growing exclusive and private label to 47.1% of sales, they rebuilt gross margin to 40.2%, an improvement of about 340 basis points, and pro forma net profit after tax jumped to 12.1 million dollars from 3.7 million.
Neither business found a magic channel. Both simply stopped running promotions that were not earning their keep, and the only way to know which ones those are is to review them one at a time. Meanwhile the sector average keeps drifting the other way: effective discount rates across ecommerce typically sit at 12% to 18% of revenue, and fashion routinely runs 20% to 30%.
Worth remembering the pond we are all fishing in too. Online sat at 12.7% of total Australian retail sales in the ABS June 2025 read, with online non-food at 19.0%. Growth is there, but it is not so abundant that you can afford to give away a quarter of your product margin without checking the receipt.
The compound effect of four debriefs a year
One debrief feels like admin. Four in a row changes the business, because each one hands the next campaign a shorter list of mistakes to make.
After the first debrief you usually discover your discount cost was higher than you thought and your incremental lift was smaller. After the second you start capping depth, because the cohort data has made the case for you. After the third the execution list is short enough that the campaign runs itself and the team stops working weekends. By the fourth you are choosing which promotions to not run, which is where the margin actually comes from.
Look at the numbers that move. Cutting your average discount depth from 30% to 20% on a product carrying 50% list margin takes your realised margin from 28.6% to 37.5% of the discounted price. Trim just three unprofitable promotions from a twelve-campaign calendar and you have removed three trough weeks as well. That is the mechanism behind those basis-point improvements the listed retailers keep reporting.
The debrief also feeds your wider reporting rhythm. Every action it produces should land in the same place you track everything else, which for most of our members is the one-page dashboard in the monthly business review playbook.
The one page campaign debrief template
Copy this into a doc, duplicate it for every campaign, and never run a promotion without one again.
- Campaign: name, dates, offer, channels used.
- Baseline: median daily revenue for the 28 days prior.
- Promotion revenue: total, and apparent lift over baseline.
- Trough: revenue shortfall in the 14 days after.
- True incremental revenue: apparent lift less the trough.
- Total campaign cost: discount, incremental ad spend, freight, fulfilment surge, support, returns provision.
- Cost per incremental dollar: total cost divided by true incremental revenue.
- Contribution margin dollars for the campaign window.
- New customers acquired and cost per new customer.
- Cohort quality at 90 days: repeat rate by discount tier.
- Execution log: keep, fix, drop against planning, assets, site, stock, fulfilment, support, comms.
- Three decisions: run again yes or no, maximum depth next time, single biggest change.
- Owners and dates for every action.
Fill in the first seven lines before the meeting. Fill in the cohort row 90 days later, and give the person who owns it a calendar reminder, because that is the line everybody skips and it is the one that permanently changes how you price.
Start with your most recent campaign, even if it finished months ago. The data is still sitting in your admin, and the first debrief is always the one that finds the most money.
Inside eCommerce Circle, promotional discipline is one of the core pillars we work on with every member, and the campaign debrief is how we make it stick. If you want a second opinion on your last sale, let’s talk.