Your blended ROAS this month is 3.4. Last month it was 3.3. The dashboard is green, the revenue line is up, and you just approved another budget increase because the numbers say the ads are working.
What’s in This Article
Then your accountant sends through the management report and profit is down on a bigger revenue number. Nothing broke. No campaign blew up. You simply kept buying at a price that stopped being worth paying, and the average return hid it from you for eleven weeks.
This is the most expensive blind spot in Australian ecommerce right now, and it is getting worse. Median Meta CPMs sit around $15.06 and have climbed roughly 8% year on year as more advertisers fight over the same inventory. Average ecommerce ROAS has slipped to 2.87:1, and the median is only 2.04:1, which means half of all stores are running at barely two dollars back for every dollar in. When the auction gets that tight, the difference between your average return and your next dollar return is where the profit lives or dies.
The Number Your Ads Dashboard Will Never Show You
Every reporting tool you own reports averages. Meta shows you account ROAS. Shopify shows you total sales attributed to a channel. Even the good third-party tools mostly roll everything into one blended figure and call it a day.
None of that answers the only question that matters when you are deciding a budget: what did the last increment of spend actually return?
Marginal ROAS is the return on the extra money, not the total money. You calculate it by taking the extra revenue you earned and dividing it by the extra spend that earned it. That is the whole formula. Two numbers, one division, and it will change how you run your account.
Here is why it matters so much. Advertising does not scale in a straight line. The first thousand dollars a day buys your warmest, highest-intent, cheapest-to-reach audience. The tenth thousand buys people who barely know you exist and were never going to buy this month. As you push budget up, the platform reaches further out, cost per acquisition rises, and the return on each new slice falls. Your average keeps getting propped up by that early cheap volume long after the newest volume has gone underwater.
Averages lag. Margins lead. If you only watch the average, you find out you overspent when the bank balance tells you, which is usually a quarter too late.
Average Return Is a Story. Marginal Return Is the Truth.
Let me put real numbers on it, because this is the exercise that usually makes founders go quiet on a call.
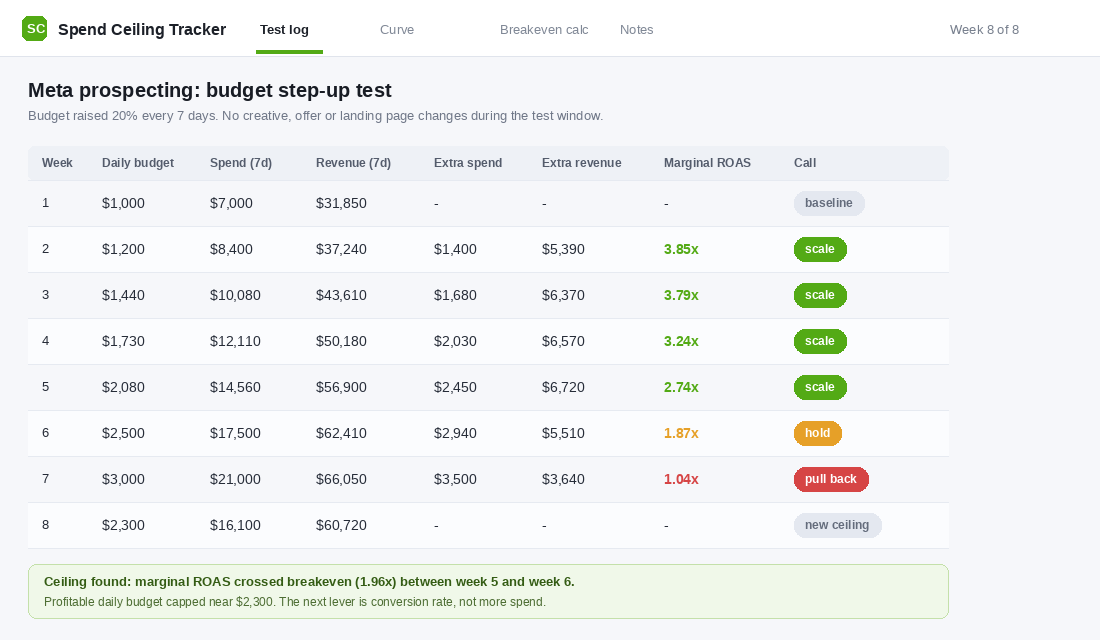
Say you are spending $1,000 a day on Meta prospecting and pulling $31,850 in weekly revenue from it. Blended ROAS on that channel is 4.55. Excellent. So you lift the budget to $1,730 a day. Four weeks later weekly revenue from the channel is $50,180 and your blended ROAS reads 4.14. Still strong. Still green. You feel good about the decision.
Now run the marginal maths on that same period. You added $5,110 in weekly spend and you gained $18,330 in weekly revenue. Marginal ROAS across that jump is 3.59. Also fine, and it correctly tells you the increase was worth making.
Keep going. You push to $3,000 a day. Weekly revenue climbs to $66,050 and blended ROAS reads 3.15, which still looks like a business you would be happy to own. But the step from $2,500 to $3,000 added $3,500 in spend and only $3,640 in revenue. Marginal ROAS on that final step is 1.04. You just bought a dollar of revenue for a dollar. On a 51% contribution margin, that step burned about $1,700 in real money every single week while the dashboard congratulated you.
That gap between 3.15 and 1.04 is the entire point. The average never went red. The margin did, three weeks earlier.
If you have not built the underlying blended picture yet, start with our Marketing Efficiency Ratio framework. Marginal ROAS is the layer that sits on top of MER, not a replacement for it. You need the blended view to know if the whole engine is healthy, and the marginal view to know where to stop feeding it.
Work Out Your Breakeven Before You Touch a Budget
Marginal ROAS on its own is just a number. It only becomes a decision when you compare it to your breakeven ROAS, and most operators have never actually calculated theirs properly.
Breakeven ROAS is one divided by your contribution margin percentage. Not gross margin. Contribution margin, which is what is left after every variable cost that scales with an order.
- Start with net revenue per order. Take your average order value and strip out GST and any discount actually redeemed. A $120 AOV with 10% average discount and GST removed is closer to $98.
- Subtract landed cost of goods. Product cost, inbound freight, duty, and any per-unit packaging. Landed, not ex-factory.
- Subtract fulfilment. Pick and pack, outbound shipping, and the shipping subsidy you eat on free delivery thresholds.
- Subtract payment and platform fees. Card processing, Afterpay or Zip commission where it applies, Shopify transaction fees. Buy now pay later can run 4% to 6% and quietly moves your breakeven.
- Subtract returns and refunds. Take your actual return rate and apply the full cost, including the return freight and any product you cannot resell.
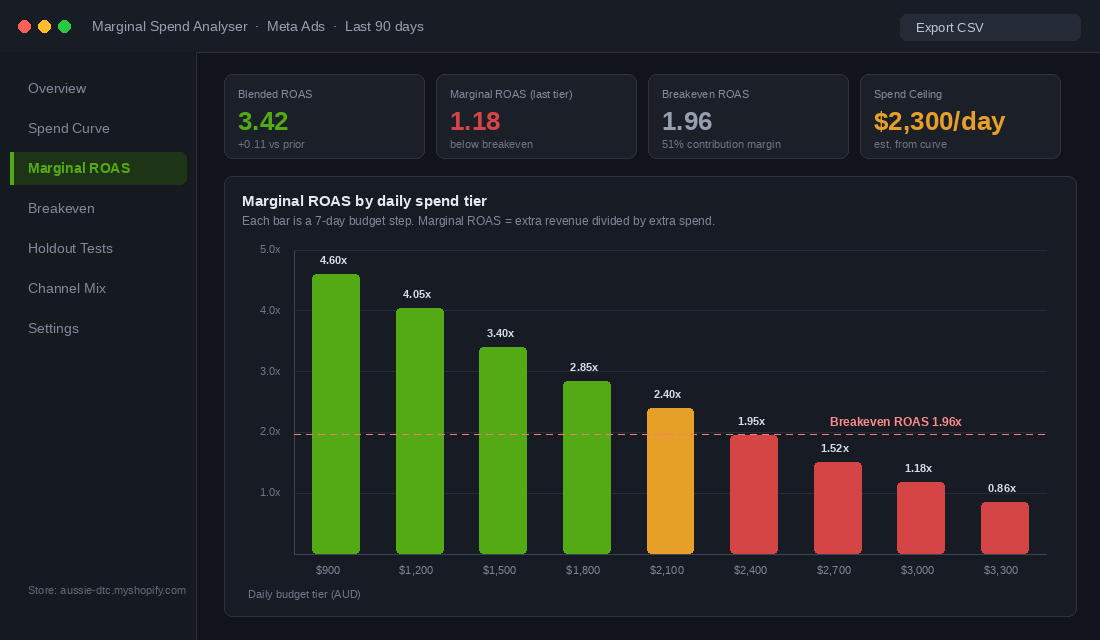
What is left is contribution margin. If that lands at 51%, your breakeven ROAS is 1 divided by 0.51, which is 1.96. Anything above 1.96 makes you money on that increment. Anything below it does not, no matter how good the account average looks.
Do this properly once and write the number on a sticky note above your desk. Most founders I run this exercise with are 8 to 15 points off where they thought they were, almost always because shipping subsidy and returns were never counted. Our contribution margin audit walks the full calculation line by line if you want to pressure-test yours before you build a test around it.
One warning. If your business relies on repeat purchase, a strict first-order breakeven will make you too conservative. Set a second threshold based on 90-day contribution rather than first-order contribution, and be honest about your repeat rate. If 28% of first-time buyers come back within 90 days at a similar margin, you can justify running marginal ROAS below first-order breakeven, but only down to the point where the 90-day number still clears. Do not use “LTV” as a word you say to justify losing money indefinitely.
The Step-Up Test: Eight Weeks to Find Your Ceiling
You cannot find a spend ceiling by looking backwards at messy historical data where creative, offers, promotions and seasonality all moved at once. You find it by running a deliberate, boring, controlled test.
Here is the version I give members. Eight weeks, one channel, one variable.
- Pick one channel and one campaign type. Meta prospecting is the usual starting point because it is where most Aussie brands over-invest. Do not test retargeting and prospecting together. They have completely different curves.
- Set a clean baseline week. Run week one at your current budget and change nothing. Record daily spend, weekly spend, and weekly revenue attributed on a consistent basis. Use the same attribution setting for all eight weeks even if you think it is wrong. Consistency beats accuracy here.
- Raise the budget 20% every seven days. Twenty percent is the sweet spot. Small enough that you do not reset the learning phase and blow up delivery, large enough to produce a readable signal. Change the budget on the same day and time each week.
- Freeze everything else. No new creative, no offer changes, no landing page tests, no sale periods, no new audiences. If you launch a promotion mid-test, the test is dead and you start again.
- Calculate marginal ROAS each week. Extra revenue divided by extra spend versus the previous week. Write it in the log even when it looks bad, especially when it looks bad.
- Stop when marginal ROAS crosses breakeven. Two consecutive weeks below your breakeven number is your ceiling. Not one week, because one week can be noise.
- Step back to the last profitable tier and hold. That budget is your working ceiling until something structural changes.
A few practical notes from running this with a lot of stores.
Run it outside peak. Testing your spend ceiling in November is pointless because BFCM demand distorts every number and gives you a ceiling you cannot hold in February. Late winter and early spring are ideal for Australian brands, which makes right now a good window before the Q4 build.
Watch for delayed conversions. If your considered purchase takes ten days, a seven-day step will understate the return on the newest spend. Either extend each step to fourteen days or apply a consistent lag adjustment across all weeks. Do not adjust only the weeks with bad results.
Keep a written log of anything unusual. A supplier delay, a stockout on a hero product, a competitor going on sale, an Australia Post disruption. Any of these can drag a week down and make you call a ceiling that is not really there.
Four Curve Shapes and What Each One Is Telling You
When you plot the results, the shape tells you what to do next. There are four patterns worth knowing.
- The gentle slope. Marginal ROAS drifts down slowly and stays well above breakeven across every tier. You have headroom and you are underspending. Keep stepping until you find the wall. This is the best problem in ecommerce and it is rarer than founders think.
- The cliff. Return holds steady for three or four tiers and then falls off hard in one week. Usually means you exhausted a specific audience or the algorithm shifted delivery to a much weaker placement mix. Step back one tier and investigate what changed in the placement and audience breakdown before you accept it as a true ceiling.
- The flat line. Marginal ROAS barely moves as spend rises. That is often a sign your attribution is over-crediting, not that you have infinite headroom. Real curves bend. A flat curve is your cue to go and run a holdout before you keep raising budgets on a number you cannot trust.
- The immediate drop. Marginal ROAS falls below breakeven on the very first step-up. You were already at or past your ceiling before the test began. The answer is not a different budget, it is a different conversion rate, a different offer, or a different product mix.
That last one is the most common result for stores in the $40k to $150k a month range, and it is the most useful. It tells you spend is not the constraint. If your ceiling is uncomfortably low, the fix sits upstream in the funnel, not in the budget field.
Prove It With a Geo Holdout Before You Bet the Quarter
The step-up test uses platform-attributed revenue, which means it inherits every flaw in platform attribution. If Meta is claiming sales that would have happened anyway, your marginal ROAS is inflated and your ceiling is higher than reality. The fix is a holdout test, and Australia is unusually well suited to running one because our population splits cleanly into matched state groups.
Here is how to set one up in Meta Ads Manager without any extra tooling.
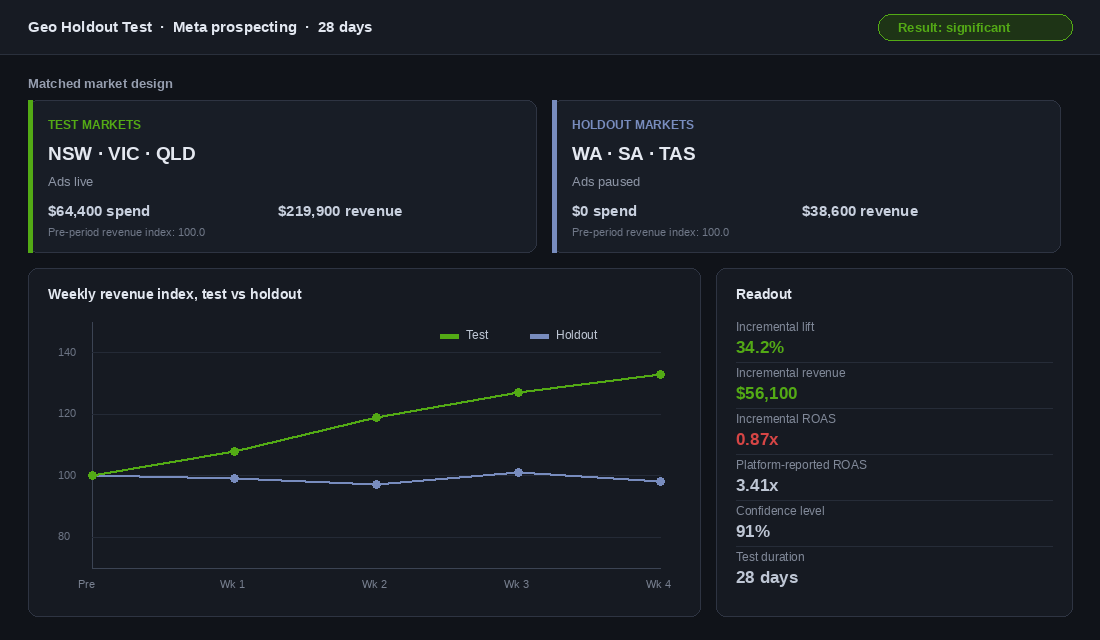
- Pick matched markets. Group your states into a test set and a holdout set with similar revenue profiles. A common Australian split is NSW, VIC and QLD as test against WA, SA and TAS as holdout. Pull the last 12 weeks of revenue by state from Shopify Analytics and confirm the two groups track each other closely.
- Record a pre-period. Take four weeks of revenue for both groups before you touch anything and index both to 100. If they already diverge in the pre-period, your markets are not matched and the test will not read cleanly.
- Set location targeting. In your campaign, exclude the holdout states from location targeting so ads only deliver to the test group. In Ads Manager this is under the ad set audience controls, where you can include and exclude by country, state and region.
- Hold for 28 days. Two weeks is the absolute minimum, four weeks is safer, and longer again if you sell something with a long consideration window. Change nothing else during the window.
- Compare index movement, not raw dollars. Your test states are bigger, so raw revenue comparison is meaningless. Compare how much each group’s index moved from the pre-period. If test moved to 133 and holdout sat at 98, your lift is roughly 34%.
- Calculate incremental ROAS. Take the lift in revenue that the test group produced above the holdout trend and divide it by the spend that produced it. That is your real number.
Meta also has a built-in Conversion Lift study that handles the randomisation and the lift calculation for you, though it usually requires a minimum spend commitment and an account rep to switch on. For most Australian brands under a few hundred thousand a month, the manual geo split above gets you 90% of the answer at zero cost. Our full geo-holdout method covers the statistical side, including how to check whether your result is real or just noise.
The uncomfortable truth most founders discover here: platform-reported return is commonly two to four times the incremental return on retargeting and branded search, and closer to accurate on cold prospecting. Which is the opposite of what most people assume.
The Spend Ceiling Scorecard
Copy this into a spreadsheet or a note and run it once a quarter. Seven lines, ten minutes.
- Contribution margin percentage. Calculated after COGS, freight, fulfilment, payment fees and returns. Updated this quarter, not last year.
- First-order breakeven ROAS. One divided by line one. This is your hard floor.
- Ninety-day breakeven ROAS. Adjusted for your actual repeat rate and repeat margin. This is your stretch floor.
- Current daily budget by channel. Prospecting and retargeting listed separately, always.
- Marginal ROAS at the current tier. From your most recent step-up test, not from an average.
- Incrementality factor. Incremental ROAS divided by platform-reported ROAS from your last holdout. If you have never run one, write “unknown” and treat every platform number with suspicion.
- The call. Scale, hold, or pull back. One word, written down, with the date. So next quarter you can see whether you actually did it.
The discipline is in line seven. Plenty of founders run the analysis and then keep spending anyway because pulling back feels like going backwards. It is not. Holding at a profitable ceiling while you fix conversion rate is how you get a higher ceiling next quarter.
What Changes When You Run to Marginal Instead of Average
Here is what actually happens when a brand switches from managing the average to managing the margin.
First, spend usually comes down before it goes up. One D2C supplements brand running around $220,000 a month cut total spend by 38% over twelve months while topline still grew 17%. Cost per acquisition dropped 32% and contribution margin after marketing climbed seven percentage points. The growth came from real new customers rather than from over-attributed retargeting that was being counted twice.
Second, your attention moves upstream. When you know your ceiling is $2,300 a day, “spend more” stops being an available answer and you are forced back onto the levers that actually raise the ceiling: conversion rate, average order value, contribution margin, and repeat purchase. Every point you add to contribution margin lowers your breakeven ROAS, which mathematically buys you more headroom to spend. A move from 51% to 56% contribution margin drops breakeven from 1.96 to 1.79, and suddenly two of those red tiers turn green without you touching a single ad.
Third, you stop having the same argument with your agency. “ROAS is down” becomes a useless sentence once everyone in the conversation knows the difference between the average falling because you scaled deliberately and the margin falling because something broke. It turns a vague performance conversation into a specific one.
Fourth, budgeting gets easier. Once you know your profitable ceiling per channel, your annual plan writes itself. You are not guessing at a spend percentage. For context, DTC brands between $1m and $5m in revenue typically run 20% to 30% of revenue into paid, dropping to 15% to 25% between $5m and $10m. If your tested ceiling puts you well above those bands, you do not have a budget problem, you have a margin or a conversion problem.
The market backdrop makes all of this more urgent, not less. Australians spent a record $82.6 billion online in 2025, up 14% year on year, with online now accounting for 24% of total retail spending and 9.8 million households shopping online. There is plenty of demand. What there is not is cheap demand. In a market where the median store returns barely 2:1 on its ads, the brands that win are not the ones spending the most. They are the ones who know exactly where their next dollar stops working, and who have the discipline to stop there.
Run the step-up test once. Eight weeks, one channel, one variable. Whatever it tells you will be more useful than another quarter of watching an average.
Inside eCommerce Circle, knowing your real spend ceiling is one of the core pillars we work on with every member, because it sits underneath almost every other growth decision you make. If you want a second opinion on yours, let’s talk.