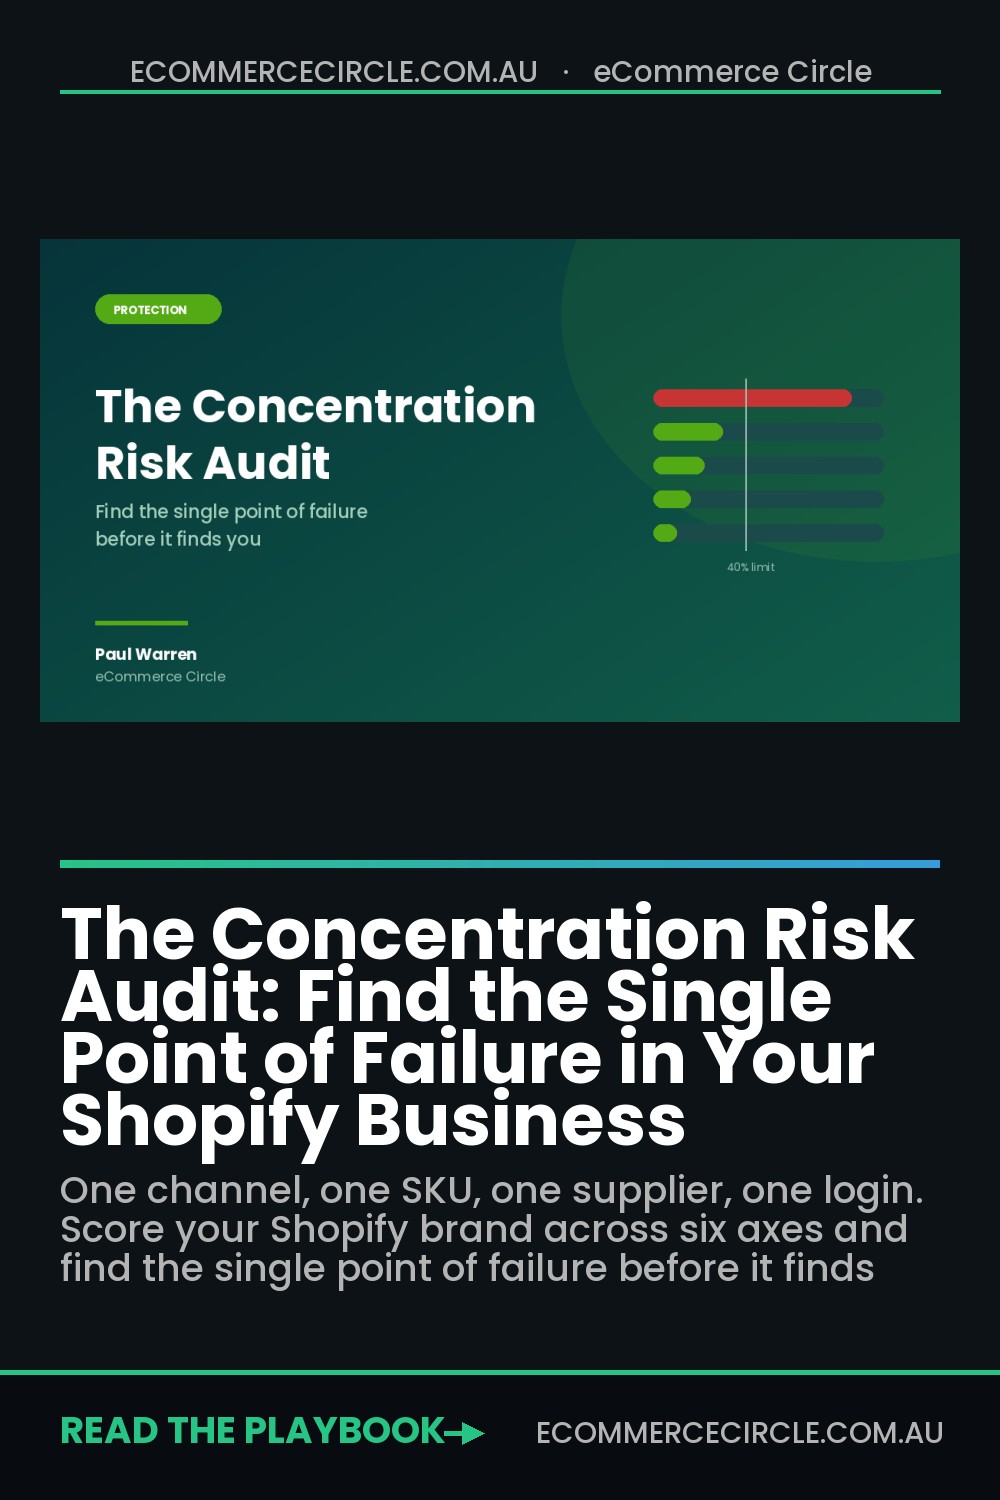
You can tell me your revenue, your blended ROAS, your repeat rate and your gross margin. Most operators running a decent Shopify store can. What almost nobody can tell me in a coaching call is the number that actually predicts whether the business survives a bad quarter.
What’s in This Article
That number is concentration. It is the share of your revenue, your supply, your traffic or your access that sits behind one single node. One channel. One SKU. One factory. One carrier. One login. One person.
Here is why it matters more than almost anything else on your dashboard. When private equity and acquisition buyers run due diligence on an ecommerce business, anything under 10% of revenue from a single customer is treated as healthy, and most funds draw a hard internal line at 15%. Once a single node carries more than 30% of revenue, valuations get cut by 20 to 35% against a diversified peer, and a large slice of the institutional buyer pool simply walks away. Buyers price concentration risk because they have watched it kill otherwise good businesses.
You should price it too, well before anyone is looking at your books.
Your dashboard is not showing you the risk that ends businesses
Australians spent $82.6 billion online in 2025, up 14% year on year, with 24% of all retail spend now happening digitally and 9.8 million households shopping online. The market is not the problem. The market is bigger than it has ever been.
The problem is that the way most Aussie Shopify brands are built, all of that growth flows through a handful of very narrow pipes. And the standard analytics view is designed to celebrate the pipe that is working, not to warn you about how much weight it is carrying.
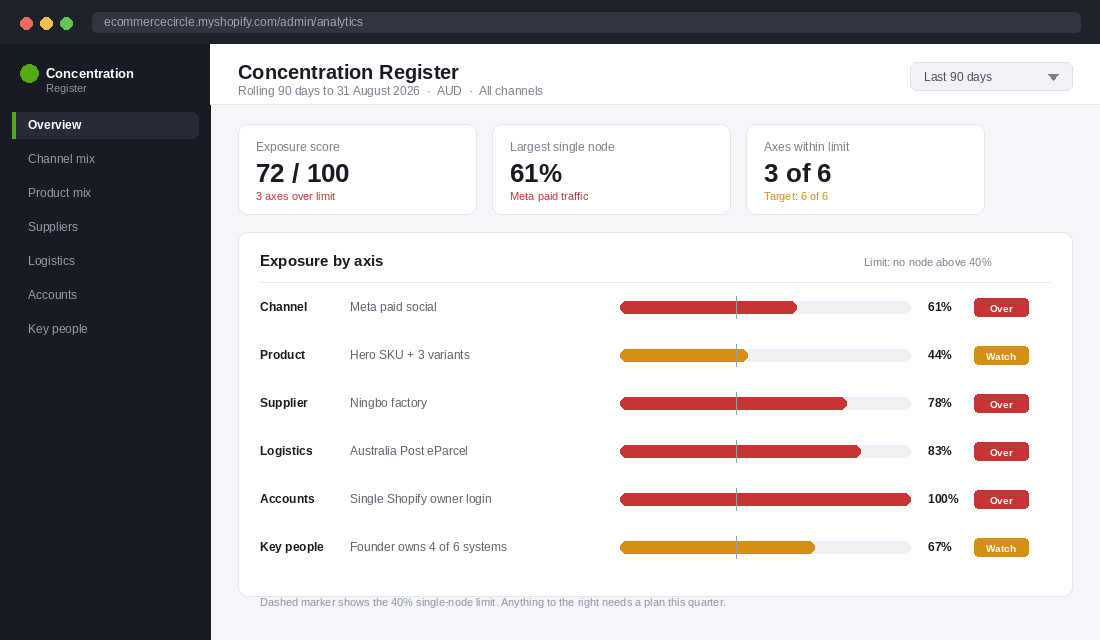
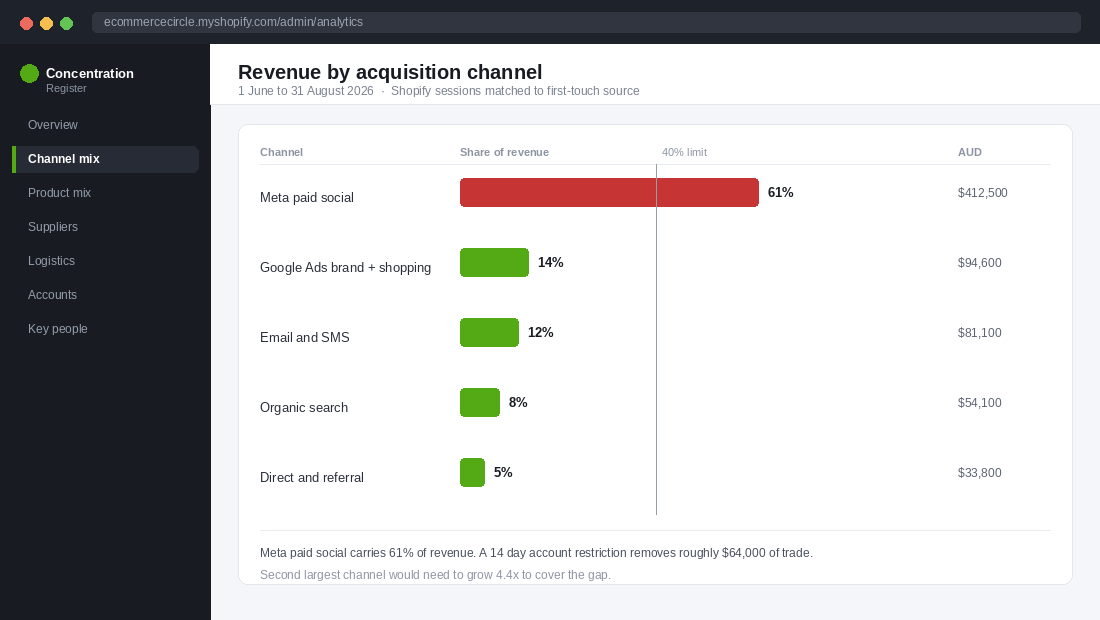
Your Shopify reports tell you Meta is your best channel. They do not tell you that Meta is 61% of revenue and a two week account restriction would remove the bulk of a trading month. Your inventory report tells you TAN-01 is your hero product. It does not tell you that one factory in Ningbo makes 78% of everything you sell.
This is not a hypothetical exercise. The 2025 Vero SME Insurance Index surveyed 1,750 Australian businesses and found 90% have no formal risk management plan and 81% rarely or never run a structured risk assessment. Most operators are not ignoring concentration risk on purpose. They have just never had a format for looking at it.
So here is the format. Six axes, one score, one page. Run it once a quarter.
Axis 1: Channel. Where the orders actually come from
Start here because it is the axis that moves fastest and hurts soonest.
Pull your last 90 days of revenue and split it by first touch source. Not sessions. Revenue. Then calculate what percentage of total revenue the largest single channel carries.
Most Aussie DTC brands doing between $40k and $500k a month land somewhere between 55% and 75% on paid social. That is the norm, and the norm is dangerous. Meta ad accounts get restricted for reasons that often have nothing to do with anything you did wrong, and verification requirements tightened sharply through 2025. When a Business Manager is disabled, every connected ad account, Page, pixel and catalogue freezes at the same moment.
Run the arithmetic on your own numbers before that happens:
- Fourteen day outage cost. Take your largest channel’s share of revenue, multiply by monthly revenue, divide by two. That is what a fortnight offline costs you in trade.
- Replacement multiple. Divide the largest channel’s revenue by the second largest. If the answer is above 3, your backup channel is not a backup. It is a rounding error.
- Cash runway at zero paid. How many weeks can you cover fixed costs on organic, email and repeat orders alone? If the answer is under six, concentration is a cash problem, not just a marketing one.
The fix is not “spend less on Meta”. The fix is deliberately building a second channel to 20% of revenue before you need it, and treating that as a growth project with its own budget, owner and deadline. Email, SMS, organic search and Google brand are the usual candidates because you own or influence the demand rather than renting it. If you have already had an account taken down, our Shopify ad account ban playbook covers the recovery sequence in detail.
Axis 2: Product. The SKU that carries the year
Every good brand has a hero product. That is how it should be. The question is whether the hero is carrying the business or whether the business is hiding behind the hero.
Pull twelve months of revenue by SKU, sort descending, and build a cumulative column. Two numbers matter. What share does your single biggest SKU carry, and how many SKUs does it take to reach 80% of revenue?
If your top SKU is above 30%, or if four or fewer SKUs get you to 80%, you are running a single product business with a catalogue attached. That is survivable. It is not resilient. One failed production run, one ingredient reformulation, one compliance issue, one competitor undercutting you on your one product, and the trading year is gone.
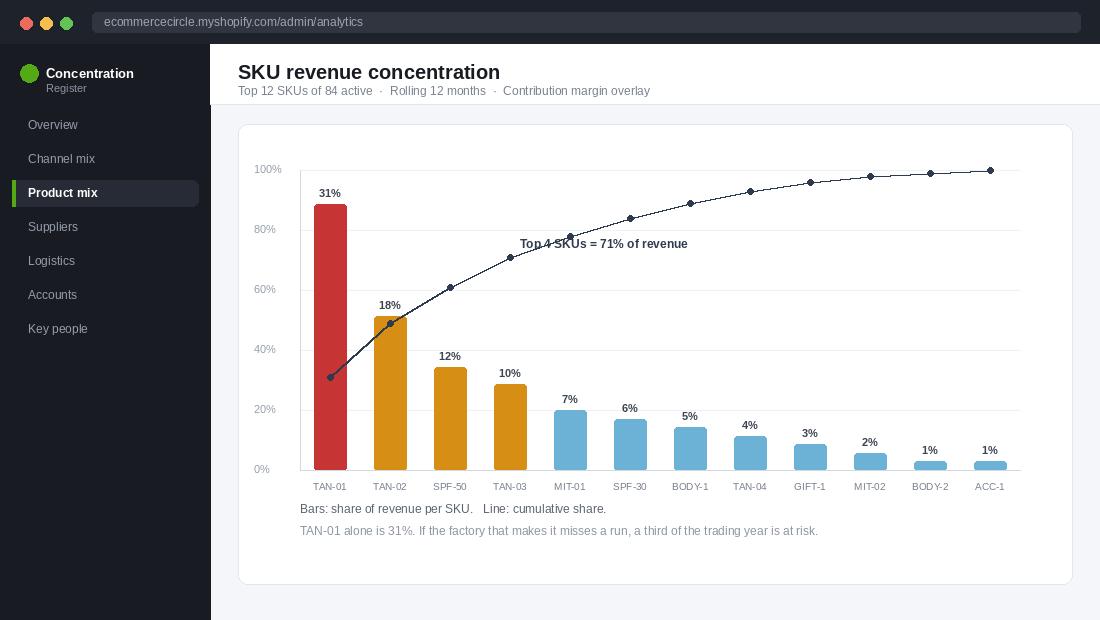
The de-concentration play is not “launch more products”. Most brands already have too many SKUs doing too little. The play is to take the second and third best performers and give them a real run: their own creative, their own landing page, their own email flow, their own place in the bundle architecture. You are trying to move a 12% SKU to 20%, not invent a new one from scratch.
Bondi Sands is the Australian case study worth studying here. Founded in Melbourne in 2012 on self tan, the brand deliberately widened into sun care from 2017 and pushed distribution to more than 40,000 stores across 95 countries. In August 2023 it sold to Japan’s Kao Corporation in a deal reported at around $450 million AUD. A single category, single channel version of that business does not attract that number.
Axis 3: Supplier. One factory, one lane, one currency
Supply concentration is the axis Aussie founders underestimate the most, because it feels solved once the product is landing on time.
Australia imported $120.1 billion of goods from China in 2024-25, and China now supplies roughly 70 to 80% of Australian imports across a long list of consumer categories including furniture, lighting, toys and homewares. If you are sourcing from China, you are not unusual. You are the market. That also means a disruption in one lane hits you and every competitor at once, which is exactly when replacement capacity is hardest to buy.
Score three sub-nodes here, not one:
- Manufacturer share. What percentage of your cost of goods sits with one factory? Anything above 60% needs a named second source, even if you only run 10% of volume through them to keep the relationship warm.
- Freight lane share. One forwarder, one port, one shipping schedule is a single node. A second forwarder costs you a slightly worse rate and buys you optionality.
- Currency share. If your landed cost is priced in USD and your revenue is AUD, every cent of exchange rate movement is a margin event you did not choose.
The cheapest de-concentration move in supply is not a second factory. It is a qualified second factory with a completed sample run sitting in a drawer. Tooling, samples and a signed spec sheet with a backup supplier might cost you a few thousand dollars. Finding one from scratch in a crisis costs you a season. Our supplier risk playbook walks through how to qualify and stage a second source without blowing up your unit economics.
Axis 4: Logistics. The carrier that owns your delivery promise
Australia Post moved more than 110.7 million parcels through the 2025 peak season alone, with parcel volumes up 5.1% in the half to December 2025. For most Aussie Shopify brands it is the default, the fallback and the entire logistics strategy in one.
That is fine right up until it is not. Industrial action, a natural disaster in your fulfilment state, a peak season backlog or a 3PL that loses a client and reshuffles its labour all land the same way: your delivery promise breaks and your support inbox fills with orders you have already spent the acquisition cost on.
Score two nodes. Carrier share of shipments, and warehouse share of stock. Then ask the uncomfortable question: if your single fulfilment site went offline on the first Monday of November, what actually happens?
- Add a second carrier before peak, not during it. Even 10 to 15% of volume through an alternative keeps the account live, the integration tested and the rate card negotiated.
- Hold a buffer of your top four SKUs off site. A small forward stock position with a second 3PL or even a self managed pick location covers the bestsellers that carry most of your revenue.
- Write the switch procedure down. Which app setting changes, who calls whom, what the customer email says. A one page runbook turns a crisis into an inconvenience.
Axis 5: Accounts. The login nobody else has
This is the axis that scores worst in almost every audit we run, and the one that takes the least effort to fix.
List every system the business cannot trade without. Shopify owner account. Domain registrar. DNS. Meta Business Manager. Google Ads and Analytics. Klaviyo. The payment gateway. The 3PL portal. The business bank. Then write down who can access each one without asking anyone else.
If the answer for most rows is one person and one personal email address, your concentration score on this axis is 100%. That is not a security problem in the abstract. It is a trading problem. The OAIC recorded 1,205 data breach notifications in the 2025 calendar year, an 8% increase on 2024 and an all time high, and account takeover is a routine route in.
Three fixes, all doable in an afternoon:
- Move ownership to a business domain email that the company controls, not a founder’s personal Gmail. Personal accounts leave with the person.
- Put every credential in a shared password manager with a documented break glass process, so a second trusted person can get in if you cannot.
- Turn on app based two factor everywhere and record the recovery codes somewhere that is not the same device. SMS codes are the weakest option available to you.
Axis 6: People. The founder is a single point of failure too
The last axis is the one nobody wants to score honestly.
Take your six most important recurring processes: buying, forecasting, creative approval, ads management, customer service escalation and month end numbers. For each one, write the name of the person who could run it next Monday without you. If your name appears four or more times, the business does not have a team. It has an assistant and a bottleneck.
The measurement that cuts through is a two week test. Not a holiday where you check Slack from the beach. A genuine two weeks where somebody else holds the decisions. Whatever breaks is your people concentration score, written in plain English.
Fixing this axis is slower than the others because it needs documentation and a second person who is actually capable. Start with the two processes that cost the most money when they go wrong, usually buying and paid media. Write the standard operating procedure, hand it over, then review the output rather than doing the work.
How to score it: the Concentration Register
Here is the framework. One row per axis, one largest node, one percentage, one owner, one action. Nothing clever. The value is that it exists and gets reviewed.
| Axis | What you measure | Green | Watch | Over |
|---|---|---|---|---|
| Channel | Largest channel share of 90 day revenue | Under 40% | 40 to 60% | Above 60% |
| Product | Largest SKU share of 12 month revenue | Under 25% | 25 to 35% | Above 35% |
| Supplier | Largest manufacturer share of cost of goods | Under 50% | 50 to 70% | Above 70% |
| Logistics | Largest carrier share of shipments | Under 60% | 60 to 80% | Above 80% |
| Accounts | Critical systems with only one human who can access them | Zero | 1 to 2 | 3 or more |
| People | Core processes only the founder can run | Under 2 | 2 to 3 | 4 or more |
Score each axis, then count how many sit in Green. Six of six means you have a business. Three of six means you have a business that is currently getting away with it. One or two means the next bad month is not a dip, it is an event.
One rule keeps this from becoming a spreadsheet nobody opens: you are only allowed to work on one Over axis per quarter. Pick the one with the highest cost if it fails, assign it an owner and a date, and leave the rest until next quarter. Trying to de-risk six axes at once is how this exercise gets abandoned in week three.
Build it in Shopify in about forty minutes
You do not need a new app. Shopify Analytics and a single Google Sheet will get you a working register today.
- Channel numbers. In Shopify admin go to Analytics, then Reports, then Sessions attributed to marketing. Switch the metric to Total sales, set the date range to the last 90 days, and group by Marketing channel. Export to CSV.
- Product numbers. Analytics, then Reports, then Sales by product. Set the range to the last 12 months, sort descending by net sales, export. Add a cumulative percentage column in the sheet.
- Supplier and logistics numbers. These do not live in Shopify. Pull manufacturer split from your last four purchase orders, and carrier split from your 3PL or shipping app export for the last 90 days.
- Accounts and people. Two manual lists. System name, owner email, second person with access. Process name, primary owner, backup owner. Twenty minutes with a coffee.
- Assemble the register. One tab, six rows, the thresholds from the table above, conditional formatting on the percentage column. Add a Last reviewed date cell at the top.
- Put it in the calendar. A recurring 45 minute block on the first Monday of each quarter. Same sheet, updated numbers, one action chosen.
If you already run custom reporting, ShopifyQL will get you the channel and SKU splits faster than the standard report builder. Either way, the format matters more than the tooling. A rough register that gets reviewed beats a beautiful dashboard that does not.
What changes when no single node carries more than forty per cent
Here is where the six axes stop being six separate chores and start behaving like one system.
A second channel at 20% of revenue does not just protect you from an ad account restriction. It gives you a place to sell the second and third SKU that were never going to work in a paid social feed, which lowers product concentration. Lower product concentration means your supplier exposure spreads across more than one factory, which lowers supply concentration. More than one supplier means more than one freight lane, which lowers logistics concentration.
It runs the other way too. Median direct to consumer acquisition costs now sit somewhere around $130 to $156 per customer and have climbed roughly 60% in five years. A brand that has only one way to acquire has no choice but to pay whatever that channel charges. A brand with three working channels has bargaining power, because it can move budget when the price gets stupid.
Mosaic Brands, the group behind Noni B, Rivers and Katies, entered voluntary administration in October 2024 and was delisted from the ASX in August 2025. Businesses at that scale do not fail from one cause. They fail because several exposures that had been survivable in isolation arrived in the same quarter. That is what concentration risk actually looks like from the inside. Not one dramatic event, but several nodes failing at once with no slack anywhere in the system.
The founders who come through hard quarters are rarely the ones with the best ads. They are the ones who built a second channel, qualified a second factory and wrote down the passwords back when everything was fine and there was no urgency to do any of it.
Score your six axes this week. If more than two land in Over, that is your quarter decided for you. And if you are thinking further ahead than this year, concentration is one of the first things a buyer will price, so it is worth reading alongside our Shopify exit readiness playbook.
Inside eCommerce Circle, concentration risk is one of the core things we work through with every member, because it is the difference between a business that grows and a business that just has a good year. If you want a second opinion on where your single points of failure actually sit, let’s talk.
Related reading: ecommerce insurance for Australian online stores.