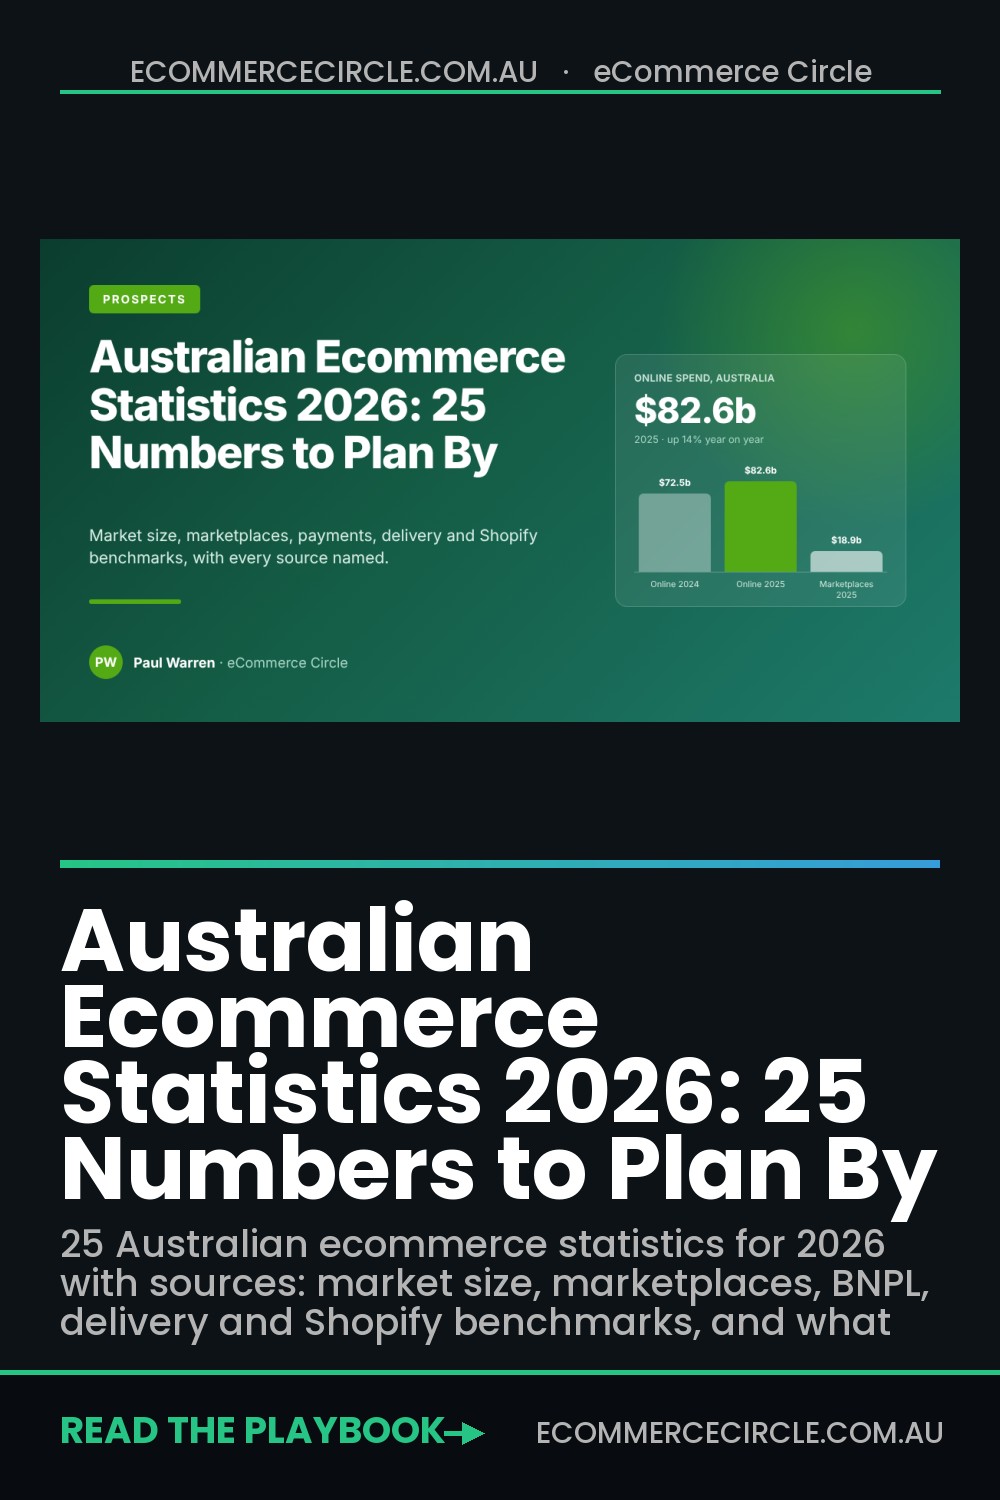
Australians spent a record $82.6 billion online in 2025, up 14% on the year before, and 82% of households bought something online. Online now takes 12.7% of all retail turnover on the ABS measure, or 24% of retail spend on Australia Post’s broader measure.
That is the headline. The problem is what most store owners do with it. They read “14% growth” and assume their store should be growing 14% too. Then they panic when it isn’t, or relax when it is, without ever asking where that growth went or who captured it.
The owners who plan well do something different. They pull the 20 or so numbers that actually describe how Australians shop, compare their own store against each one, and build next year’s plan around the gaps. That is what this article gives you: 25 Australian ecommerce statistics for 2026, each with its source, and a plain read on what it means for a Shopify store doing between $300k and $5 million a year.
The Market Size Numbers (How Big Is Australian Ecommerce in 2026?)
Three organisations measure Australian online spend and they all land on different figures, because they count different things. Know which one you are quoting before you put it in a board deck.
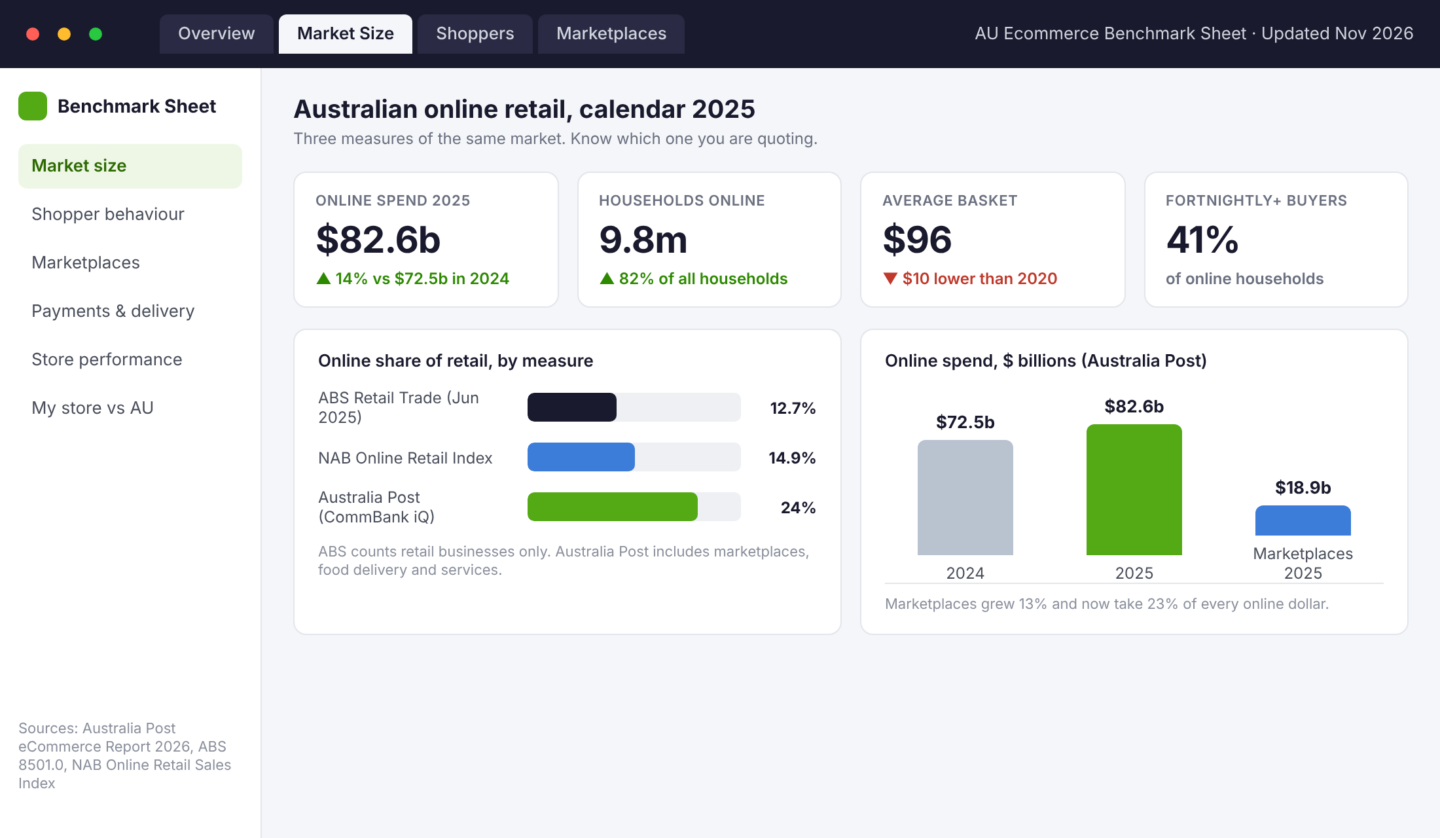
- $82.6 billion spent online in 2025, up 14% from $72.5 billion in 2024. This is Australia Post’s figure, built on CommBank iQ transaction data and published in the Australia Post eCommerce Report 2026. It includes marketplaces, food delivery and services, so it is the widest measure.
- Online is 24% of all retail spend on Australia Post’s measure. The same report puts the online share of Australian retail at roughly one dollar in four.
- Online is 12.7% of retail turnover on the ABS Retail Trade series (June 2025, original terms), up from 11.6% a year earlier. The ABS only counts retail businesses, which is why its share is half of Australia Post’s. It is the most conservative number and the one economists quote.
- $66.2 billion in the 12 months to September 2025, growing 12.5% year on year according to the NAB Online Retail Sales Index. NAB puts online at 14.9% of retail trade. Department stores (up 20.8%), games and toys (up 17.2%) and takeaway food (up 17.1%) were the fastest-growing categories.
- 9.8 million Australian households shopped online in 2025, a record 82%. Of those, 41% bought at least fortnightly. The pool of new online shoppers is close to tapped out, so growth from here comes from frequency and share of wallet, not new households.
What it means for you: If your store grew less than 12% last year, you lost share in a market that was expanding. That is worth saying out loud. The growth was there; it went to someone else. The sections below show you who got it.
How Australians Shop Online (Frequency, Basket Size and Generations)
The most important shift in the 2026 data is not the total. It is that Australians are buying more often and spending less each time. That changes how you should think about acquisition, free shipping thresholds and retention.
- The average online basket is $96, which is $10 lower than in 2020. Every generation except Builders shrank their basket last year. Shoppers are splitting purchases into smaller, more frequent orders, which pushes your fulfilment cost per order up while revenue per order falls. If your contribution margin per order has been sliding, this is a big part of why. Compare your own number against the average order value benchmarks for Australian stores before you set next year’s free shipping threshold.
- Shoppers made four more online purchases each in 2025 than in 2024. Frequency is the growth engine now. A customer who buys from you twice a year instead of once is worth more than a 20% lift in traffic.
- Households buy from an average of 16 brands a year. You are one of 16. Loyalty is not assumed; it is earned on every order, which is why the post-purchase experience matters as much as the ad that won the first sale.
- Millennials spent $29.7 billion online, up 13.1%, and 28% of their total spending is online. That is the highest online share of any generation. 47% of Millennials shop online weekly or more, against 35% of all shoppers. If your average customer is 30 to 44, weekly email and SMS cadence is not too much.
- Builders (born before 1946) grew their online spend 16.9% to $3.4 billion, the fastest growth of any generation. Older Australians were the last to move online and they are still moving. Larger fonts, simpler checkouts and a phone number on the site are not nice-to-haves for this group.
- 81% of shoppers actively look for deals online. That does not mean you must discount. It means your value has to be visible: bundles, free shipping thresholds, loyalty points and “why this costs more” copy all count as a deal in the shopper’s head.
What it means for you: Smaller baskets plus higher frequency means your repeat customer rate is now the single most sensitive number in your P&L. Measure it monthly, and if it is below 25% in a replenishable category, fix retention before you spend another dollar on cold traffic.
Where the Money Goes (Marketplaces, Amazon, Temu and Shein)
Nearly a quarter of every online dollar in Australia now goes to a pure marketplace, and the shopper numbers show exactly which ones are winning. This is the section most Aussie store owners would rather skip. Don’t.
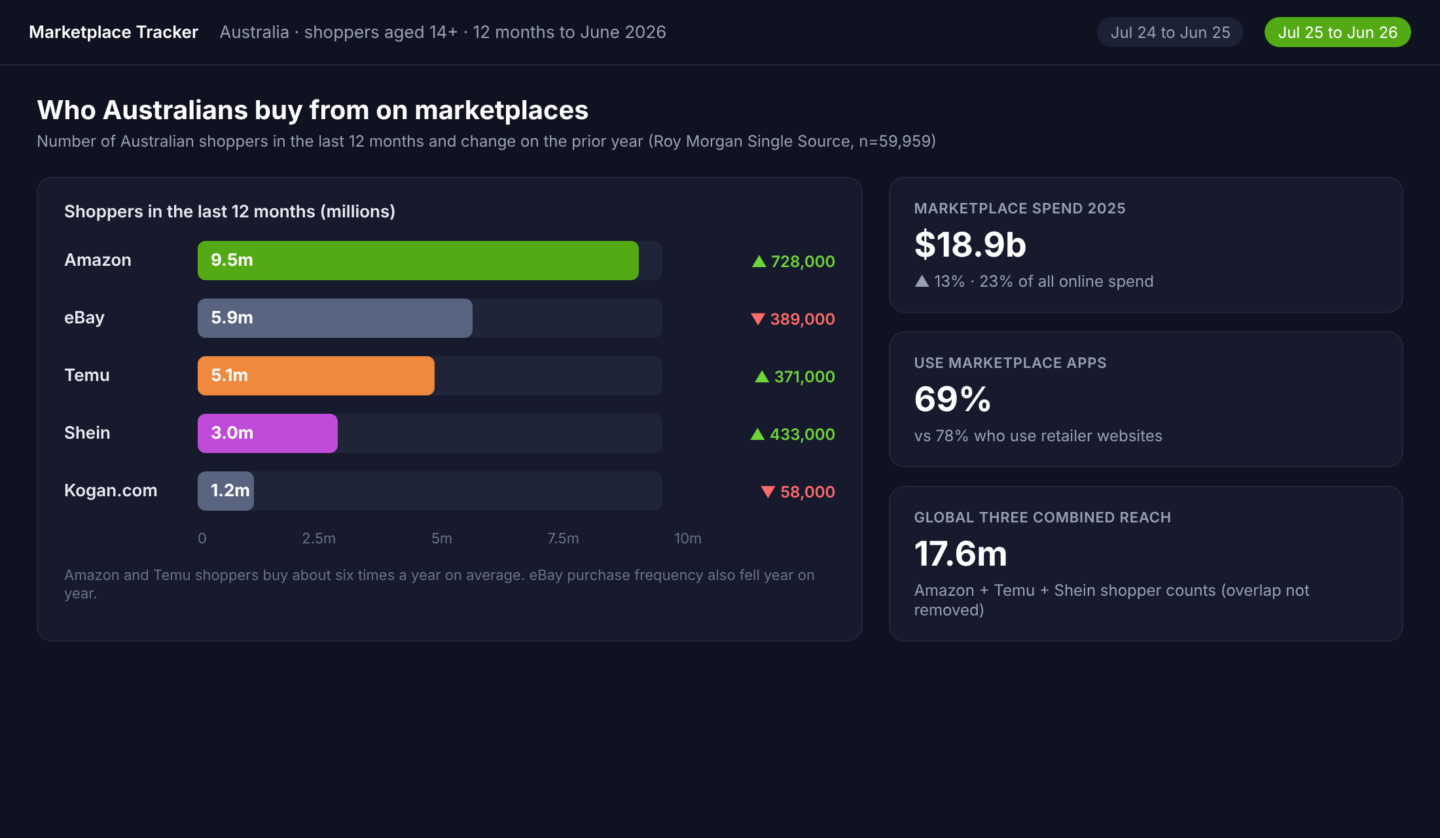
- Australians spent $18.9 billion on pure online marketplaces in 2025, up 13%, which is 23% of all online spend. Marketplaces were the strongest-performing category in the Australia Post report.
- Amazon had 9.5 million Australian shoppers in the 12 months to June 2026, up 728,000 year on year (Roy Morgan Single Source, n=59,959). Amazon shoppers buy about six times a year on average. Roughly one in three Australians aged 14 and over now buys from Amazon.
- Temu had 5.1 million Australian shoppers (up 371,000) and Shein had 3 million (up 433,000). Shein’s base grew about 17% in a year. Temu shoppers also average about six purchases a year. These are not fringe players anymore; combined they reach more Australians than eBay.
- eBay fell to 5.9 million shoppers (down 389,000) and Kogan.com to 1.2 million (down 58,000). The local and legacy marketplaces are losing shoppers to the global three. If your wholesale or marketplace strategy still leans on eBay, the trend is against you.
- 69% of shoppers use marketplace apps, while 78% use retailer websites. Your own site is still the most-used channel in the country. The gap is just narrower than it was, and the app habit is sticky.
What it means for you: You will not out-price Temu and you should not try. The brands holding full price are the ones with a reason to exist beyond the product: a story, a community, a service layer or a delivery promise Temu cannot match. We mapped the five defensible moats in the Temu-proof playbook; the marketplace numbers above are why that work is urgent.
Payments, Delivery and Discovery (What Shoppers Expect at Checkout)
The next group of numbers describes the checkout and delivery experience Australians now treat as normal. Fall short on any of them and your conversion rate pays for it.
- 41% of Australians used a buy now pay later service in the six months to March 2026 (Finder Consumer Sentiment Tracker). Afterpay is the most used provider, and BNPL users carry an average balance of $1,110. If you sell anything over $80 to under-40s, not offering at least one BNPL option costs you orders, though the merchant fee is a real margin decision.
- Online payments were about 20% of all consumer payments in 2025, up from 18% in 2022, and 43% of consumers tapped a phone to pay during the RBA’s survey week, up from 35% in 2022 (RBA Consumer Payments Survey, fieldwork October to December 2025). Apple Pay, Google Pay and Shop Pay are now expected, not novel.
- 73% of shoppers say a good delivery experience makes them more likely to shop online, and 69% want a wide range of delivery options at checkout. 32% would switch retailers for an out-of-home collection option such as a Parcel Locker. Offering one carrier at one speed is leaving conversion on the table.
- 26% expect same-day or next-day delivery when a purchase is urgent. You do not have to be Amazon. You do have to tell shoppers clearly when their order will arrive, before they pay. Stores that show a dated delivery promise on the product page convert measurably better than stores that bury shipping in a policy link.
- 60% of Australian shoppers use social media to discover products, and one in two has bought something after seeing it on social. Social is now a discovery channel for the majority of your market, whether or not you run paid ads there.
- 62% of shoppers use AI in some form and 32% use it for shopping advice. Only 16% of shoppers say they want AI agents buying on their behalf, against 44% of businesses that say they support it. Shoppers are using AI to research, not yet to purchase.
What it means for you: Add the three things the data says shoppers now expect: a BNPL option, an express wallet (Shop Pay or Apple Pay) and at least two delivery speeds with a dated promise on the product page. None of them needs a developer.
Store Performance Benchmarks (How Does Your Shopify Store Compare?)
The market numbers tell you where demand is. These numbers tell you whether your store is converting its fair share of it.
- The average Shopify store converts 1.4% of sessions; the top 20% convert above 3.2% and the top 10% above 4.7% (Littledata, 2,800 Shopify stores). On mobile the average is 1.2% against 1.9% on desktop, and mobile is roughly three quarters of ecommerce traffic. If your mobile conversion rate is under 1%, that is your biggest single lever. Our Shopify conversion rate benchmarks by niche break this down by category.
- Around 70% of online carts are abandoned (Baymard Institute’s long-running average sits at 70.19%). For a store with $1 million in annual revenue, that means roughly $2.3 million worth of carts were started and not completed. Recovering even 5% of them is a six-figure outcome.
- AI-referred sessions converted 80% better than organic search sessions and carried a 14% higher average order value (Shopify, April to June 2026). AI channels drove nearly twice as many new-buyer orders as other channels, and 75% of those sales came from merchants outside Shopify’s 100 most common product categories. The niche, specific brands are winning the AI referral.
What it means for you: Benchmark yourself against the top 20%, not the average. The average Shopify store is not profitable enough to be your goal. A 1.4% to 3.2% conversion lift more than doubles revenue from the same traffic, and that is the difference between a store that funds its ads and one that is funded by its owner.
Two Australian Brands That Read the Numbers Early
Statistics only matter if someone acts on them. Two Australian brands show what that looks like.
LSKD, the Queensland activewear brand, saw that its home market was maturing and that international demand was real. Rather than bolting international shipping onto its Australian store, it built a dedicated US store on Shopify Plus in 2020 and opened a San Diego retail space. Shopify’s case study reports a 216% year-on-year lift in US store revenue, a 37% rise in overall online sales and a 400% increase in POS revenue. The lesson is not “go to America”. It is that LSKD treated the Australian ceiling as a planning input, not a surprise.
Lovisa, the Melbourne-born jewellery retailer, is the clearest example of growing at home while the world gets bigger. Its Australia and New Zealand revenue grew 65% between FY20 and FY25, from $124.1 million to $205 million, yet ANZ fell from 51% to 26% of group revenue because international grew faster still. By FY25, 74% of Lovisa’s revenue came from outside ANZ. Shopify’s own data shows Australian merchants have lifted cross-border sales 119% since 2022, so this is not a listed-company-only move. If you are considering it, start with the five-step New Zealand expansion plan; it is the lowest-friction second market for an Australian store.
Neither brand got there by watching total market growth. They tracked the specific numbers that applied to them and moved before the rest of the market did.
How to Build Your Own Benchmark Sheet (Tool Setup)
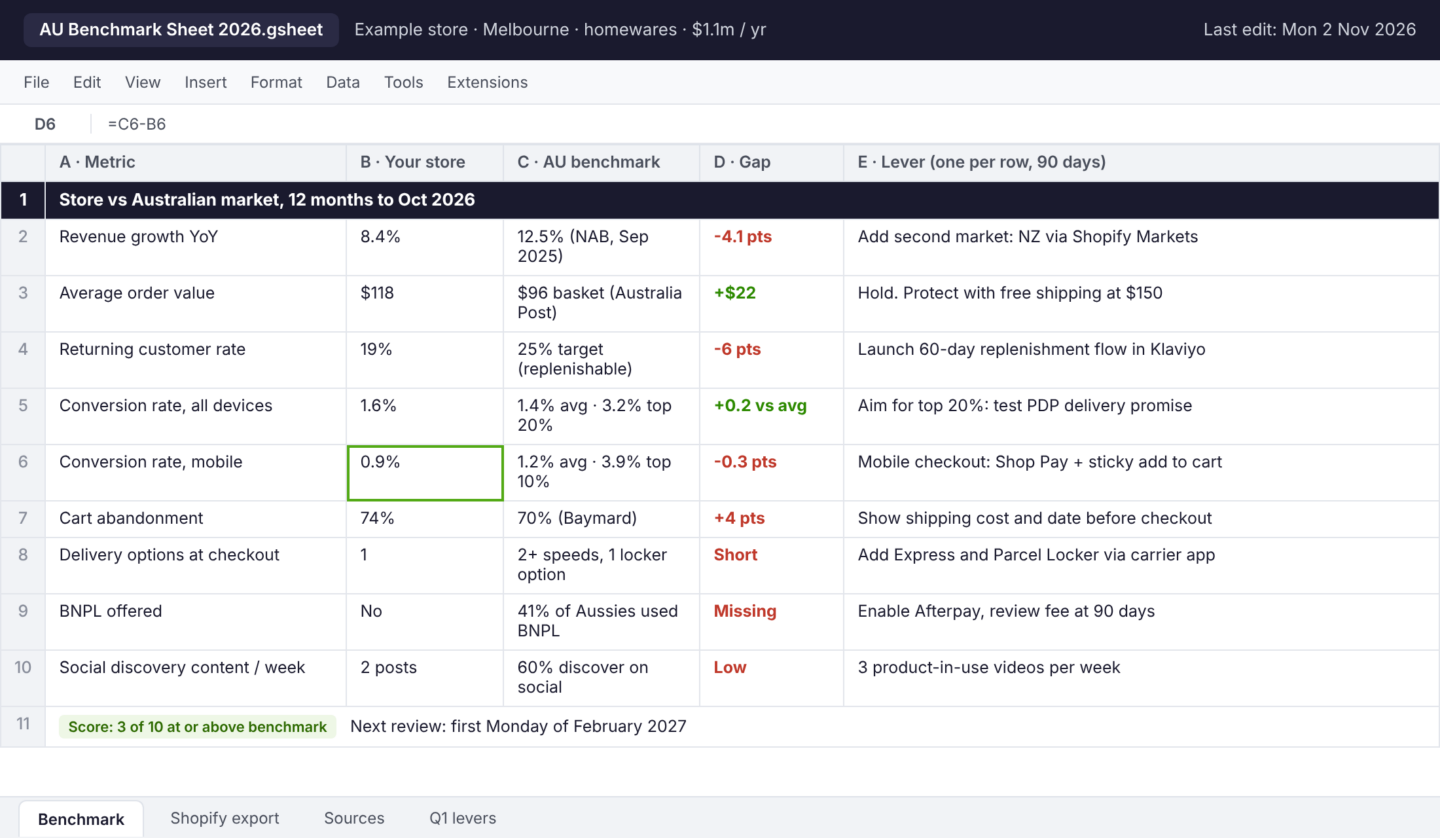
Shopify used to show a Benchmarks comparison inside Analytics that put your store against similar stores. Shopify removed that feature on 19 May 2026, so you now need to build the comparison yourself. Here is the 30-minute setup we use with members, using only Shopify Analytics and Google Sheets.
- Open Shopify Admin, then Analytics, then Reports. Create a custom report using the Sessions and Sales datasets with Date set to “Last 12 months” and Compare set to “Previous year”. Add Online store conversion rate, Average order value, Returning customer rate and Sessions by device type as columns.
- Export it to CSV and paste it into a Google Sheet with four columns: Metric, Your store, Australian benchmark, Gap. Use the figures from this article for the benchmark column: 12.5% market growth, $96 basket, 1.4% average conversion (3.2% top 20%), 1.2% mobile conversion, 70% cart abandonment.
- Add a fifth column called “Lever”. For every metric where your gap is negative, write the single change you will test in the next 90 days. One lever per metric. If you write three, you will do none.
- Set Metric Targets in Shopify. In Analytics, open any report, choose the metric and set a target for the quarter. Shopify will show progress on your dashboard, which keeps the sheet honest.
- Refresh it on the first Monday of each quarter. The Australia Post report lands mid-year, the ABS Retail Trade release comes monthly, and Roy Morgan publishes marketplace data each October. Update the benchmark column three or four times a year, not weekly.
If you want a paid tool to do the comparison for you, Triple Whale and Daasity both offer peer benchmarking, but a $1 million store does not need either yet. The sheet above does the job.
The 2027 Planning Checklist: Turn the Statistics Into Decisions
Here is the takeaway. Run through these ten checks before you lock your 2027 budget. Each one maps to a statistic above, and each one is a yes or no.
- Did we grow faster than 12.5% last year? If no, we lost share. Name the channel where it happened.
- Is our repeat customer rate above 25%? Frequency is the growth engine in a $96-basket market.
- Is our mobile conversion rate above 1.2%? If no, mobile checkout is the first CRO project of the year.
- Do we show a dated delivery promise on every product page? 73% of shoppers say delivery drives their decision to buy online.
- Do we offer at least two delivery speeds and one out-of-home collection option? 69% want choice; 32% will switch for a locker.
- Do we offer BNPL and an express wallet? 41% of Australians used BNPL in the last six months.
- Can we name the three reasons a shopper buys from us instead of Amazon or Temu? If the answer is “price”, we have a problem.
- Is our social content set up for discovery, not just announcements? 60% of shoppers find products on social.
- Are our product pages specific enough to be cited by AI shopping tools? Niche beats generic for AI referrals.
- Have we tested at least one new market or channel? New Zealand, a marketplace listing, wholesale or retail. The 16-brands-per-household number says shoppers are not waiting for you.
Score yourself out of ten. Members who come in at four or five usually find two or three fixes that pay for themselves within a quarter.
Why These Numbers Work Together
Read in isolation, 25 statistics are trivia. Read together, they describe one market with one story. Australians are already online, so the easy growth is gone. They buy more often, from more brands, in smaller baskets, which rewards retention over acquisition. A quarter of their spend goes to marketplaces that compete on price and speed, which means the independent brand has to compete on everything else. And they decide at checkout based on delivery choice, payment choice and a clear promise.
Every lever in the checklist pulls on that story. Lift repeat rate and your smaller baskets stop hurting. Fix mobile checkout and the 70% abandonment number starts working for you. Offer delivery choice and the 32% who would switch for a locker switch to you. The brands winning in 2026 are not doing anything exotic. They are simply the ones who looked at the numbers and acted on three of them.
Inside eCommerce Circle, reading the market this way is part of the Prospects pillar we work on with every member, because you cannot plan for customers you have not measured. If you want to see exactly where your store is being capped across all 10 P’s, take the free More Orders Scorecard. It takes two minutes and shows you which of the 10 P’s to fix first.
Sources
Australia Post eCommerce Report 2026 (covering calendar 2025); ABS Retail Trade, Australia, June 2025; NAB Online Retail Sales Index, September 2025; Roy Morgan Single Source, online marketplaces, 12 months to June 2026; RBA Bulletin, Consumer Payment Behaviour in Australia, May 2026; Finder Consumer Sentiment Tracker, March 2026; Littledata Shopify conversion benchmarks; Baymard Institute cart abandonment research; Shopify Entrepreneur Effect data, October 2026; Shopify LSKD case study; Lovisa FY20 and FY25 annual reports.