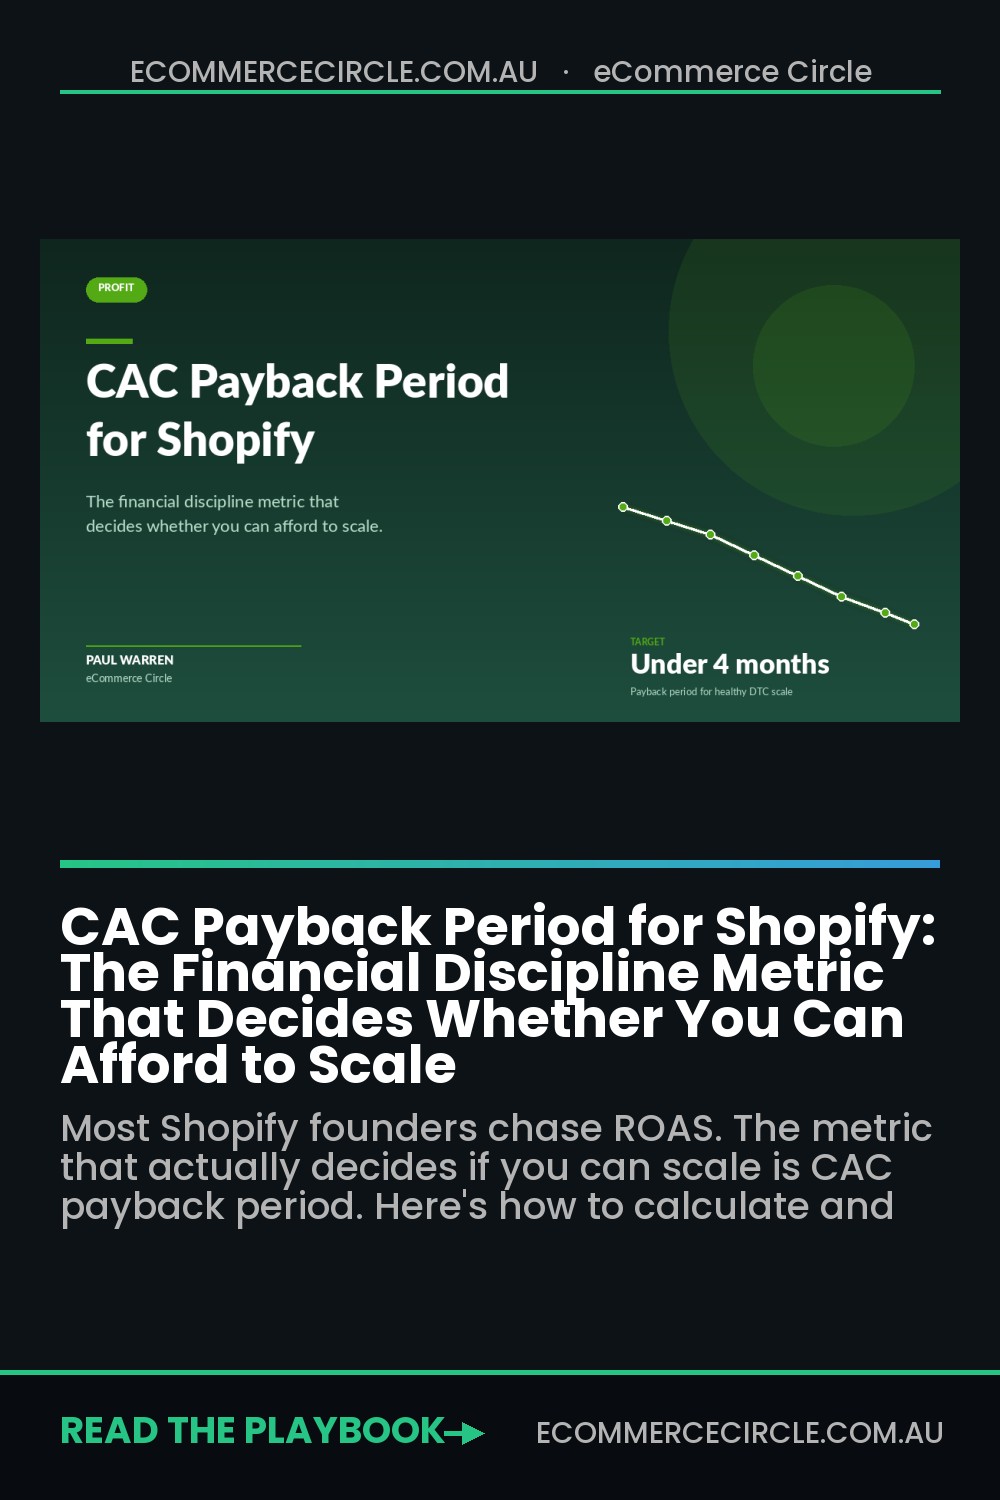
Most Shopify founders chase ROAS like it’s the only number that matters. They watch it tick up to 3x and decide it’s safe to spend more. Six months later they’re confused about why the bank balance is shrinking even though sales are climbing.
What’s in This Article
The number they should be watching is CAC payback period. It tells you exactly how long it takes for a customer to pay you back what you spent acquiring them. And in 2026, with Aussie ecommerce CAC up over 60% in the past five years, this is the metric that decides whether your growth makes you rich or breaks your business.
Here’s the brutal truth: a 3x ROAS with an 8-month payback period will bleed cash faster than you can replace it. Brands that scale profitably in 2026 are obsessing over payback periods of 90 to 120 days. Anything beyond that and you’re effectively borrowing from future you to fund today’s growth, which only works until your line of credit runs out or your suppliers stop giving you terms.
What CAC Payback Period Actually Measures
CAC payback period is the number of months it takes for the gross profit from a customer to equal the cost of acquiring them. It’s the cash-flow-aware version of ROAS, and it answers the only question that matters when you’re scaling: how long until this customer puts more money in my pocket than I spent to get them?
The formula is simple:
CAC Payback (months) = CAC ÷ (Contribution Margin per Order × Orders per Month per Customer)
For a first-purchase calculation:
CAC Payback = CAC ÷ Contribution Margin on First Order
The reason most Shopify owners ignore this metric is because they’ve never sat down and calculated their real contribution margin. They look at gross margin (revenue minus COGS) and call it a day. But contribution margin strips out everything variable: COGS, shipping, fulfilment, payment processing, returns, free product replacements, and the cost of goods given away as discounts. That’s the actual cash you have left to pay back your CAC.
Once you know your true contribution margin, the payback period becomes the most powerful financial discipline tool in your business. It forces you to answer two questions every Aussie founder needs to answer honestly: am I making money on the first order, and if not, how long until I do?
Why ROAS Lies and Payback Period Tells the Truth
ROAS is a marketing metric. Payback period is a finance metric. The difference matters when you’re spending real money.
A 3x ROAS sounds great. But it tells you nothing about whether you can actually afford to scale. Two brands can have identical 3x ROAS and completely different financial outcomes. Brand A has 65% gross margins, fast repeat purchase, and a 2-month payback. Brand B has 45% gross margins, no repeat purchase, and a 9-month payback. Same ROAS. Wildly different futures.
The reason most Australian Shopify brands hit a wall around the $2M-$5M mark is that they scaled on ROAS without ever understanding their cash conversion cycle. They borrowed against future revenue to feed Meta and Google, and when ad costs spiked or repeat purchase rates dipped, the whole thing fell over.
ROAS treats every revenue dollar as equal. Payback period asks the harder question: how much of that revenue is actually mine to keep, and when do I get it? In 2026, with the average ecommerce CAC sitting between $68 and $84 across categories and luxury brands paying upwards of $890 per customer, this distinction is the difference between a healthy scale and a slow death.
How to Calculate Your Real CAC Payback Period (Step-by-Step)
This is the calculation we walk every eCommerce Circle member through. Get this right and you’ll know within a week whether you’re actually profitable or just busy.
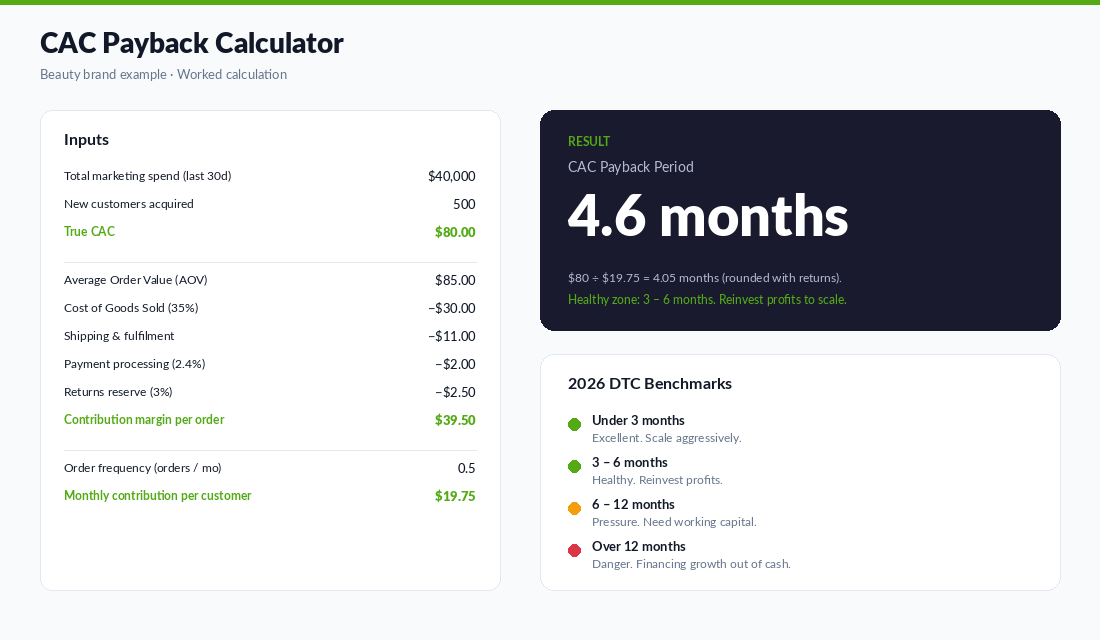
Step 1: Calculate your true CAC. Take all marketing spend (Meta, Google, TikTok, influencer, agency fees, creator fees, software, tracking tools) and divide by the number of NEW customers acquired in that period. Not total orders. New customers. If you spent $40,000 last month and acquired 500 new customers, your true CAC is $80.
Step 2: Calculate your contribution margin per order. Start with AOV. Subtract every variable cost: COGS, inbound freight allocation, fulfilment, outbound shipping, payment processing, packaging, returns reserve, and any platform-specific fees. The number left is your contribution margin.
Step 3: Find your order frequency. Pull the average number of orders per customer per month over their first 6 months. For most Shopify brands this falls between 0.3 and 0.8 — in other words, customers reorder somewhere between every 1.25 and 3.3 months.
Step 4: Plug it into the formula. Here’s a real example for a beauty brand we work with:
- CAC: $90
- AOV: $85
- COGS: $30 (35%)
- Shipping and fulfilment: $11
- Payment processing (2.4%): $2
- Returns reserve (3%): $2.50
- Contribution margin: $39.50 per order
- Order frequency: 0.5 orders per month per customer
- Monthly contribution per customer: $19.75
- CAC Payback Period: $90 ÷ $19.75 = 4.6 months
That’s a healthy payback. If their order frequency dropped to 0.3 (closer to one order every 3.3 months), the payback would extend to 7.6 months and the brand would need significantly more working capital to scale.
The 2026 Benchmarks You Should Be Hitting
After working with hundreds of Shopify brands and reviewing the latest DTC benchmark data, here’s where you should land:
- Under 3 months: Excellent. You can scale aggressively without external capital. This is what most subscription brands and high-frequency consumables hit.
- 3 to 6 months: Healthy. You can scale at a steady pace and reinvest profits. Most successful Aussie DTC brands sit here.
- 6 to 12 months: Pressure zone. You need strong working capital, supplier terms, or external funding to scale. Higher-ticket brands can survive here if their LTV is strong.
- 12+ months: Danger. You’re not actually scaling profitably. You’re financing growth with cash you don’t have. This is where most brands quietly go broke.
A separate benchmark worth knowing: the LTV:CAC ratio. Healthy brands hit 3:1 or better. If you can’t show a payback period under 120 days AND an LTV:CAC ratio above 3:1, you’re acquiring customers a competitor will eventually keep.
For context on where CAC sits across Aussie verticals in 2026: fashion runs $90-$120, beauty $90-$130, pet care $68-$90, food and beverage $53-$100, and electronics $100-$377+. Your benchmark depends entirely on your category and price point.
What Drives a Bad CAC Payback (And How to Fix It)
When we audit a brand with a payback period north of 6 months, the problem is almost always one of four things. Sometimes all four at once.
Problem 1: Your contribution margin is too thin. AOV is too low, COGS is too high, or shipping is killing you. The fastest fixes here are raising AOV through bundles and upsells, renegotiating with suppliers once you cross 5,000+ units, and tightening your free shipping threshold so it actually pulls weight. We’ve seen brands cut their payback from 8 months to 4 months just by lifting AOV from $65 to $95 through smart bundling.
Problem 2: Your CAC is rising faster than your margins. This is the most common 2026 problem. Meta CPMs are up, creative is fatiguing fast, and you’re paying more for the same customer. The fix is rarely a new ad strategy. It’s usually a creative refresh, retargeting infrastructure, and shifting some budget to higher-intent channels like Google Shopping or organic content.
Problem 3: You have no repeat purchase. A first-purchase-only business is brutal. You need a real post-purchase flow, a strong email and SMS program, and a reason for customers to come back. Brands that crack repeat purchase typically cut their payback period by 40-60% within a quarter.
Problem 4: You’re tracking the wrong CAC. A lot of brands are still calculating CAC using only Meta spend. You need to include every dollar of acquisition cost: ads, agency fees, creators, content, software, even the contractor running your TikTok account. If you don’t, your “real” payback is 2-3x worse than what your dashboard shows.
The Tools That Make This Trackable
You can do all of this in a spreadsheet, but at scale you need software. Here are the tools we recommend to Shopify brands:
TripleWhale or Polar Analytics for unified attribution and contribution margin tracking. Both pull data from Shopify, your ad platforms, your fulfilment provider, and Klaviyo to give you a real-time view of CAC, contribution margin, and payback period by channel. Setup takes about 2 hours and costs $129-$300 USD per month depending on revenue.
StoreHero specifically for DTC profitability and payback period dashboards. It was built by ex-DTC operators and makes payback period a first-class metric. You can see your payback by acquisition channel, which is often eye-opening.
Lifetimely for cohort analysis and LTV forecasting. Critical if you want to see how your payback period evolves across customer cohorts over time.
The setup is straightforward: connect Shopify, connect Meta and Google, connect Klaviyo, and tell the tool your COGS and shipping costs. Within a week you’ll have your true CAC payback period by channel, by month, by product. This is the visibility that turns founders into actual operators.
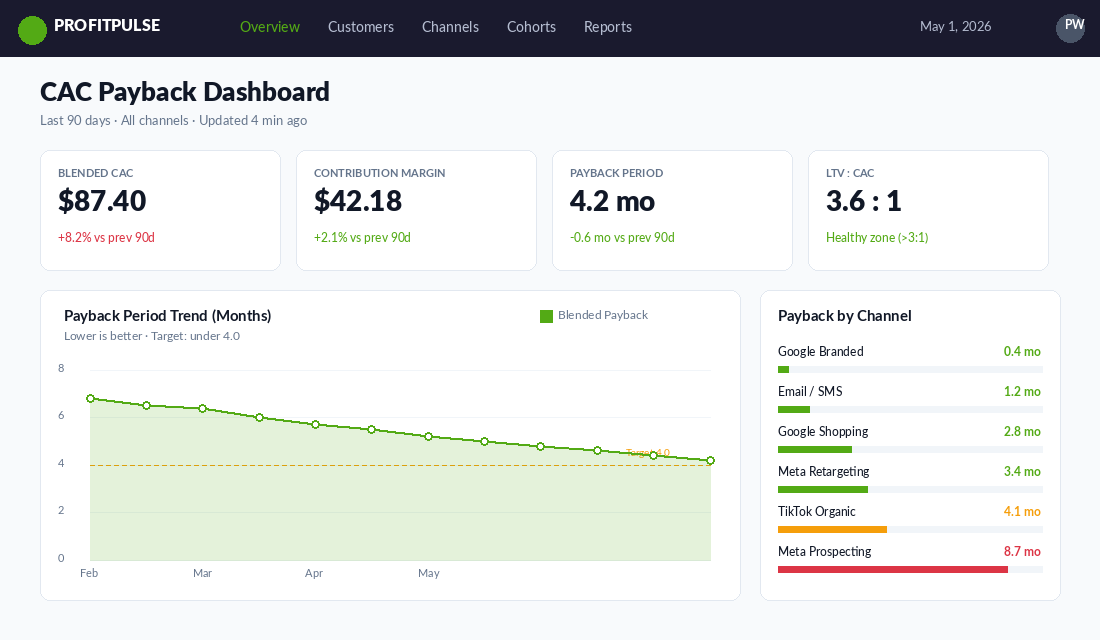
Why Blended Payback Hides the Real Story (Track by Channel Instead)
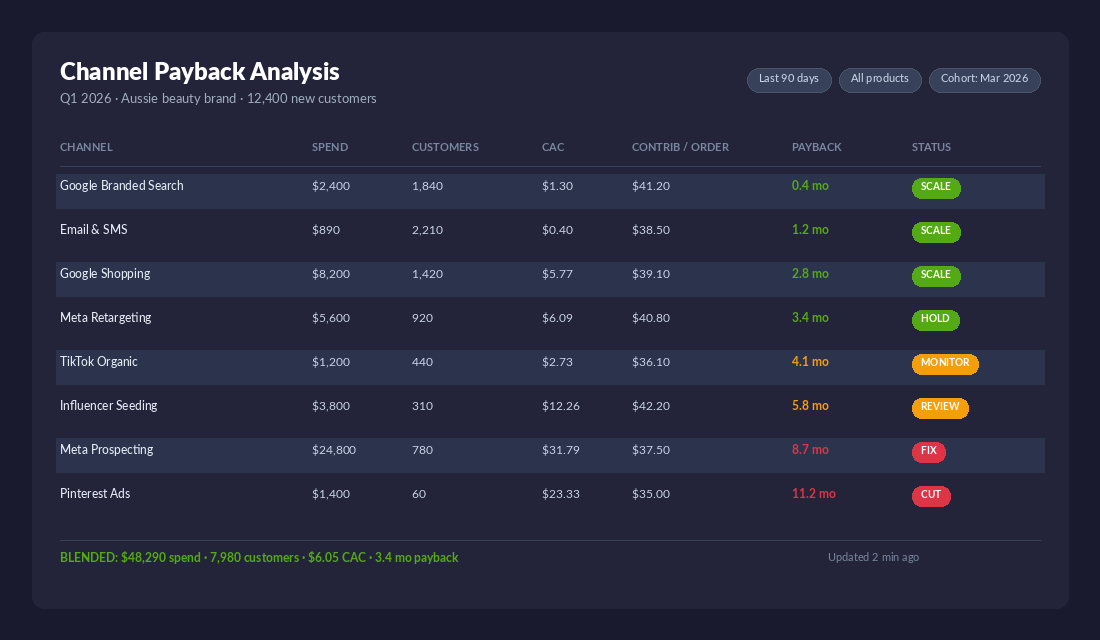
Looking at one blended CAC payback number for your whole business is like looking at average customer satisfaction across a brand with 14 product lines. The average tells you nothing useful. You need to break payback down by acquisition channel to see what’s actually happening.
We see this pattern constantly. A brand has a blended payback of 5 months and feels fine about it. Then we cut the data by channel and find that Meta prospecting is at 11 months, Google branded is at 0.4 months, and TikTok is at 7 months. The “healthy” blended number is being carried entirely by branded search and email, while the prospecting channels are bleeding cash.
This is the moment most founders realise they’ve been paying for the privilege of growing. Cutting Meta prospecting in half and reinvesting that budget in higher-intent channels often improves blended payback by 30-40% within a single month, with no loss in revenue. It’s one of the highest-leverage moves you can make once you have channel-level visibility.
The rule we use with members: any channel with a payback above 6 months gets a 30-day improvement plan or a budget cut. Any channel under 3 months gets more budget. You’d be amazed how many founders haven’t done this exercise once.
The Cash Conversion Cycle Problem No One Talks About
Here’s the part that catches founders off guard. Your CAC payback period needs to be shorter than your cash conversion cycle, otherwise you’re financing growth out of your own pocket whether you realise it or not.
Most Aussie Shopify brands operate on something like this: pay your supplier 30 days before stock arrives, hold stock for 60-90 days before it sells, collect from the customer immediately (Shopify Payments deposits in 1-2 business days), pay your ads in arrears (14-30 days). When you net it out, the cash you spent acquiring a customer might not return for 4-6 months even before you account for COGS replacement on the inventory you just sold to them.
This is why a brand with a 6-month CAC payback and a 90-day inventory cycle effectively needs working capital for nearly a full year of growth. Lift your sales 50% in a quarter and your cash position can collapse even though your P&L looks brilliant. We’ve watched brands triple revenue in 12 months and run out of money because nobody mapped the cash conversion cycle against the payback period.
The fix is partly financial discipline (shorten payback, negotiate supplier terms, monitor inventory days) and partly access to working capital (Wayflyer, Clearco, an overdraft, or a revolving facility). The mistake is assuming P&L profit means cash profit. They diverge fast when you scale.
How Aussie Brands Are Tightening Their Payback in 2026
Two examples from brands doing this well right now.
Who Gives A Crap built their entire model around a sub-3-month payback period through subscription. Their first-purchase economics aren’t extraordinary, but the moment a customer signs up for recurring delivery, the payback collapses. This is the classic subscription play, and it’s why DTC subscription brands often lead the category on payback period.
Frank Body has a different angle. Their AOV sits around $35-$45 (low for beauty), but their gross margins are 70%+ and their repeat purchase rate is exceptional. Their second and third orders typically come within 60-90 days, which means even on a “low AOV” model they hit payback inside 4 months. The lesson: payback period isn’t just about AOV. It’s the interplay between margin, frequency, and acquisition cost.
The brands winning in 2026 aren’t necessarily the ones with the lowest CAC. They’re the ones with the tightest gap between CAC and contribution margin, multiplied by frequency. That gap is the engine of profitable scale.
The Five Levers That Move Your Payback Period Fast
When we sit down with a brand that wants to compress their payback period from 7-8 months down to under 4, there are exactly five levers we look at. You only need to move two or three of them to transform the business.
Lever 1: Lift AOV with bundling, not discounts. A bundle that adds $25 to AOV at the same gross margin percentage is the fastest payback improvement available. A 15% off discount that drops AOV’s contribution margin by $12 has the opposite effect. Most brands have 4-6 obvious bundle opportunities they haven’t built yet.
Lever 2: Compress the second purchase. If your average second purchase happens at day 90, and you can move it to day 45 through a better post-purchase email flow, your payback period nearly halves on its own. The brands doing this well send a real welcome series, a 21-day check-in, and a 45-day reorder reminder with a real reason to come back.
Lever 3: Renegotiate COGS once you cross volume thresholds. Most Aussie brands buying from overseas suppliers are paying their initial unit price years after they should have renegotiated. Crossing 5,000 units, 10,000 units, and 25,000 units are all natural moments to ask for 5-10% off. We’ve seen brands free up 4-6 percentage points of margin in a single email.
Lever 4: Shift acquisition mix toward higher-intent channels. Pure top-of-funnel Meta prospecting is the most expensive way to acquire a customer in 2026. Brands that have shifted 20-30% of budget into Google Shopping, branded search, organic content, and creator partnerships often see blended CAC drop 15-25%.
Lever 5: Tighten your free shipping threshold. A free shipping threshold $5 above your AOV will lift AOV by 8-12% with no other changes. Sounds boring. It’s one of the fastest payback improvements available and most brands haven’t touched theirs in two years.
The combination matters more than any single lever. A brand we worked with last quarter ran four of these five at once: bundles lifted AOV by $18, post-purchase flow pulled second purchase forward by 30 days, supplier renegotiation freed 4 points of margin, and a free shipping threshold change added another $7 to AOV. Their payback period went from 6.8 months to 3.2 months in 90 days. Same revenue. Completely different business.
The CAC Payback Action Framework
Use this as your weekly check-in. Walk through the five questions every Monday and you’ll catch problems before they catch you.
- What was my true CAC last week? Total acquisition spend divided by new customers. Not orders. Customers.
- What was my contribution margin per order? AOV minus all variable costs. Update this monthly because suppliers and shipping costs shift.
- What was my order frequency? Average orders per customer per month for the last cohort.
- What’s my current payback period? CAC divided by (contribution margin × frequency). Track it weekly.
- What’s the trend? Is it getting longer or shorter? If it’s lengthening for two weeks in a row, find out which lever has slipped before it becomes a cash flow crisis.
If you want a deeper financial system to wrap around this, the contribution margin framework and unit economics calculation we use with members are the natural next step. The third pillar most brands miss is cash flow management — the connective tissue between healthy payback and a healthy bank balance.
Why This Metric Decides Your Next 12 Months
Mid-market Australian Shopify brands ($10M-$50M revenue) are facing what some operators are calling the “dead zone” in 2026 — fixed costs rising faster than revenue, EBITDA margins compressing to 7-8%, and capital becoming harder to access. The brands surviving this are the ones with disciplined CAC payback periods.
A 3-month payback means you can reinvest profits into more acquisition every quarter. A 9-month payback means you’re locked into needing external capital just to keep the wheel turning. One model compounds. The other consumes.
When you tighten your payback period from 8 months to 4 months, you don’t just improve a metric. You change the underlying physics of your business. You stop fighting cash flow battles, you stop being held hostage by ad platforms, and you finally have the freedom to make decisions based on what’s right for the brand instead of what your bank balance demands this week.
Inside the eCommerce Circle, CAC payback period is one of the first metrics we calculate with every new member. It’s the single most useful number in their business, and most have never measured it properly. Once they see it clearly, the path to profitable scale becomes obvious.
If you want a second set of eyes on your numbers and a clear plan to tighten your payback period, let’s talk. We’ll pull your real CAC, contribution margin, and payback period together in 30 minutes and tell you exactly which lever to pull first.