Most Shopify founders I coach can quote their revenue to the dollar. Last 30 days. Last 90. Trailing 12. Ask them what they actually kept after COGS, shipping, payment fees, pick and pack, returns, and ad spend, and the answer goes fuzzy fast.
What’s in This Article
That gap is the reason so many “profitable” stores stall at $200K, $500K, or a million AUD in revenue and then quietly go backwards. Revenue is a vanity number. Contribution margin is the one that actually tells you whether every extra order is making you richer or burying you deeper.
The Aussie brands that break through seven figures and keep compounding are obsessed with this number at the SKU level, the channel level, and the customer level. Most stores we audit can’t even produce it on demand.
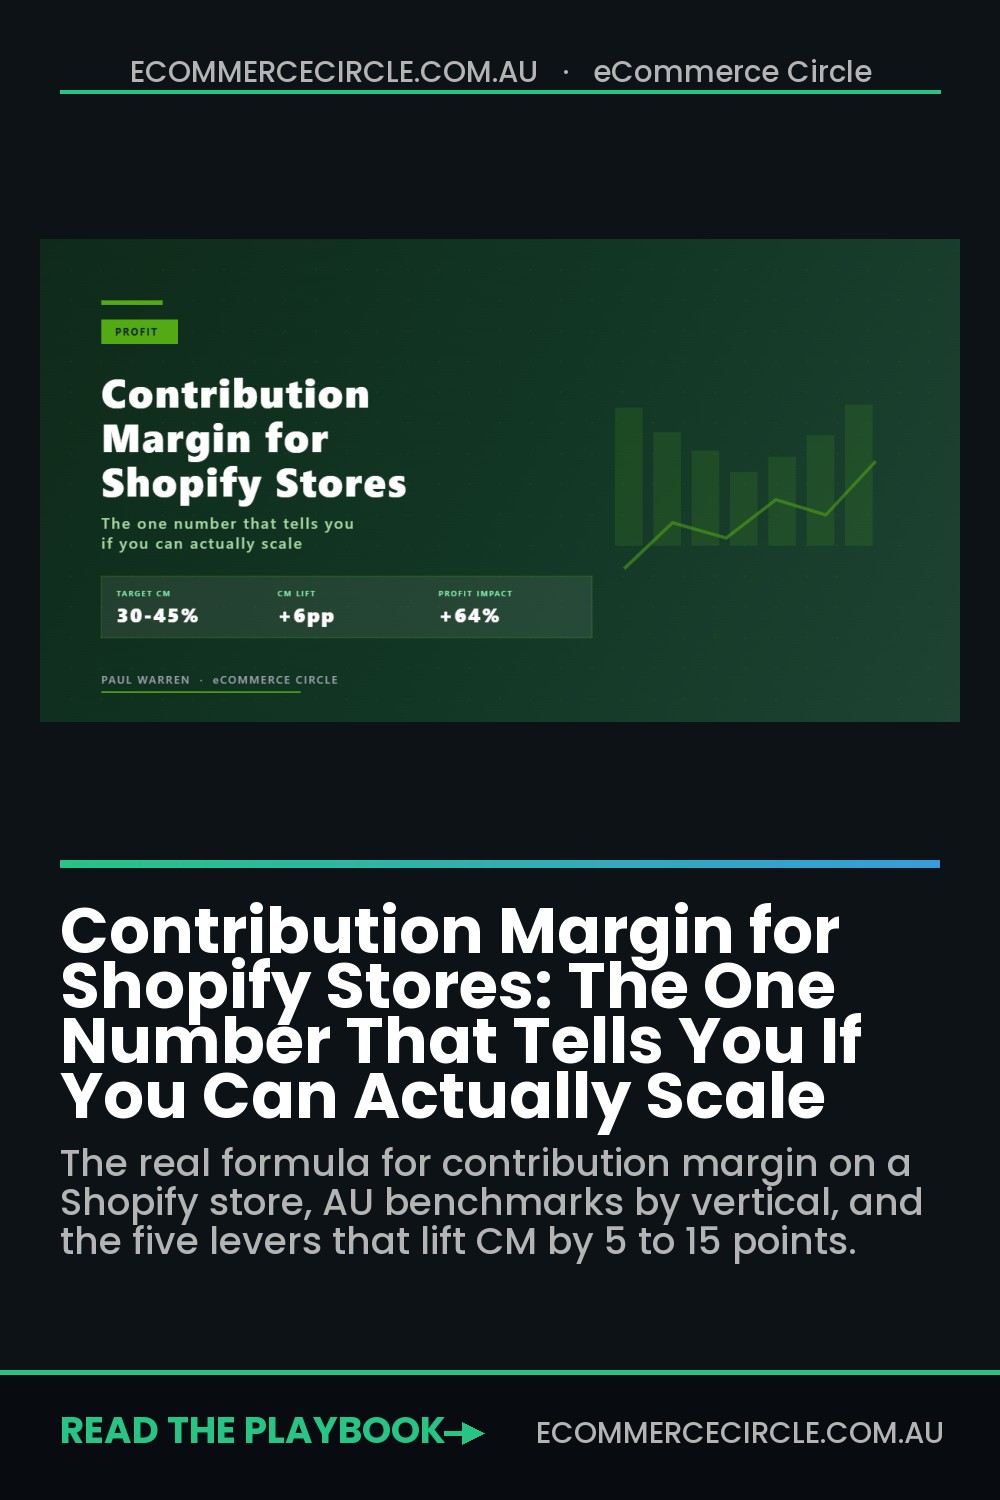
This article is the full playbook for fixing that. You’ll learn exactly how to calculate contribution margin on a Shopify store, what benchmark it should hit by vertical, and the five levers you can pull this quarter to lift it by 5 to 15 points. And you’ll finally have the number that tells you when you can spend more on ads, hire a VA, or cut a product line without flying blind.
What Contribution Margin Actually Is (And Why Revenue Keeps Lying to You)
Contribution margin is what’s left from a sale after every variable cost has been subtracted. Not gross margin. Not net profit. Variable costs only.
Variable costs move with every order you ship. If you sold one more unit tomorrow, these costs would go up. If you sold one less, they’d go down.
- COGS. What you paid your supplier for the product, fully landed.
- Inbound freight and import duties. Sea freight, air freight, customs clearance, GST on imports.
- Payment processing fees. Shopify Payments, PayPal, Afterpay, Zip, all averaging between 1.75% and 6% depending on the mix.
- Outbound shipping. Australia Post, Sendle, Shippit, StarTrack, your rate card.
- Pick and pack labour or 3PL fulfilment fees. Usually $2.50 to $5.00 per order in Australia.
- Packaging, inserts, and thank you cards. $0.80 to $3.50 per order depending on unboxing spend.
- Usage-based app fees. Klaviyo SMS, Recharge transactions, review app per-request plans.
- Ad spend attributed to that order. The one most founders leave out.
- Returns allowance. Not the optional ones. The actual return rate baked in as a reserve.
Fixed costs like your theme developer retainer, your office rent, your salaries, and your SaaS subscriptions don’t enter this calculation. They sit below the contribution line because they don’t move when you ship an extra box.
Here’s why this matters so much: your gross margin (revenue minus COGS only) can look healthy at 60% while your actual contribution margin is 18%. We see it constantly. The shipping, the fees, the returns, the ad cost chews the difference.
At 18% contribution margin, you literally cannot afford to grow through paid media. Every scaling attempt makes the hole deeper. You’ll cash flow it for a while, but the day a supplier raises prices or Australia Post lifts parcel rates, the whole thing collapses.
Contribution margin is the money left to cover your fixed costs, your tax, and what you take home. When your store scales, fixed costs stay relatively flat. So the percentage points you add to CM drop almost entirely to the bottom line. A two-point lift on a $2M AUD store is $40K a year in profit. No extra sales. No extra ad spend. Just cleaner unit economics.
The Full Formula: Every Cost Most Shopify Stores Forget to Subtract
Here’s the honest contribution margin formula for a Shopify brand selling in Australia:
AOV – Discounts – COGS – Inbound freight per unit – Payment fees – Outbound shipping – Fulfilment cost – Returns allowance – Ad cost per order = Contribution Margin $
Then divide that result by your AOV to get Contribution Margin %.
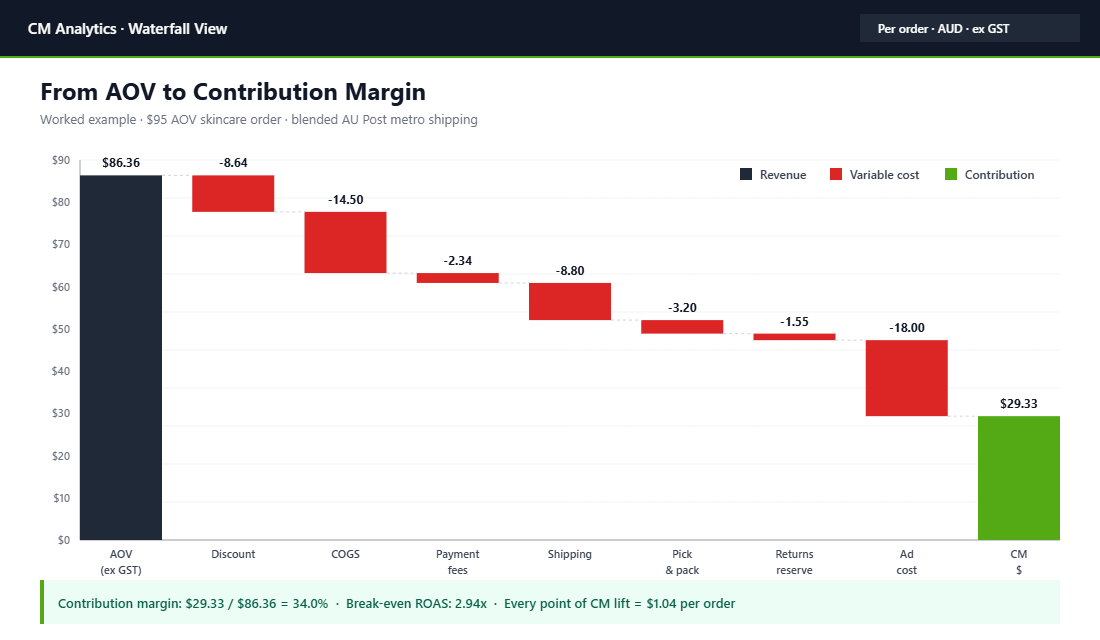
Let’s run a worked example on a $95 AUD skincare order, GST inclusive:
- AOV: $95.00 inc GST ($86.36 ex GST for margin calc, since you’ll remit the GST)
- Welcome discount applied: $8.64 (10% off on the ex-GST value)
- Landed COGS: $14.50 (product + inbound freight + duties + FX allowance)
- Payment processing: $2.34 (blended 2.7% with Afterpay mix)
- Outbound shipping: $8.80 (Australia Post parcel post, metro)
- Pick, pack, insert: $3.20 (3PL rate for mid-volume stores)
- Returns reserve: $1.55 (2% of net revenue, industry-typical for skincare)
- Ad cost per order: $18.00 (if your MER is running 4.8x)
Net contribution per order: $29.33. Contribution margin: 34%.
That’s the real number. Not the 70% gross margin your P&L probably shows in Shopify Analytics. 34% is the figure that actually tells you what this business is earning per order to cover the rest of your operation.
The line most stores underestimate is ad cost per order. Shopify doesn’t subtract it for you. You have to divide your monthly Meta plus Google plus TikTok spend by your total order count across all channels to get a realistic blended ad cost per order. If your MER (Marketing Efficiency Ratio, total revenue divided by total ad spend) is below 3.5, your ad cost per order is heavier than you think and your contribution margin is getting crushed quietly.
What Your Contribution Margin Should Actually Be (Benchmarks by Vertical)
Benchmarks shift by category because the cost stack behaves differently. Freight weight, return rates, and repeat purchase rates all move the floor. Here’s the rough range we see across Australian Shopify brands we coach inside the Circle:
- Fashion and apparel: 25% to 35% CM. Return rates of 20% to 30% drag the average down (Statista’s 2024 Global Consumer Returns report puts apparel returns at 24.4% industry-wide).
- Beauty and skincare: 30% to 45%. High COGS on active ingredients but very low return rates.
- Health, supplements, food: 35% to 50%. Repeat purchase carries the unit economics even when first-order CM is modest.
- Homewares and furniture: 20% to 35%. Freight on larger items destroys CM unless you’re selling flat-pack or accessories.
- Accessories, jewellery, pet products: 40% to 55%. Low freight, low returns, room to breathe.
- Subscription boxes: 25% to 40% on first order, often much higher by order three thanks to locked-in repeat revenue.
If you’re below 20% blended contribution margin across your store, you are in dangerous territory. You cannot absorb a bad month of returns, a shipping rate hike, or Meta CPMs spiking. The Australia Post parcel pricing review of January 2026 lifted small parcel rates by roughly 4.5%, which is enough on its own to move a thin-margin brand from “scaling but breakeven” to “underwater” overnight.
Stores above 40% CM have optionality. They can absorb a bad ad week, test a new creator campaign, or hire a VA without panicking about cash. That’s the zone you want to get to before you attempt aggressive scaling.
The Mistake Most Brands Make: Calculating CM at the Store Level Only
Your blended store-level contribution margin is useful. But it hides the truth.
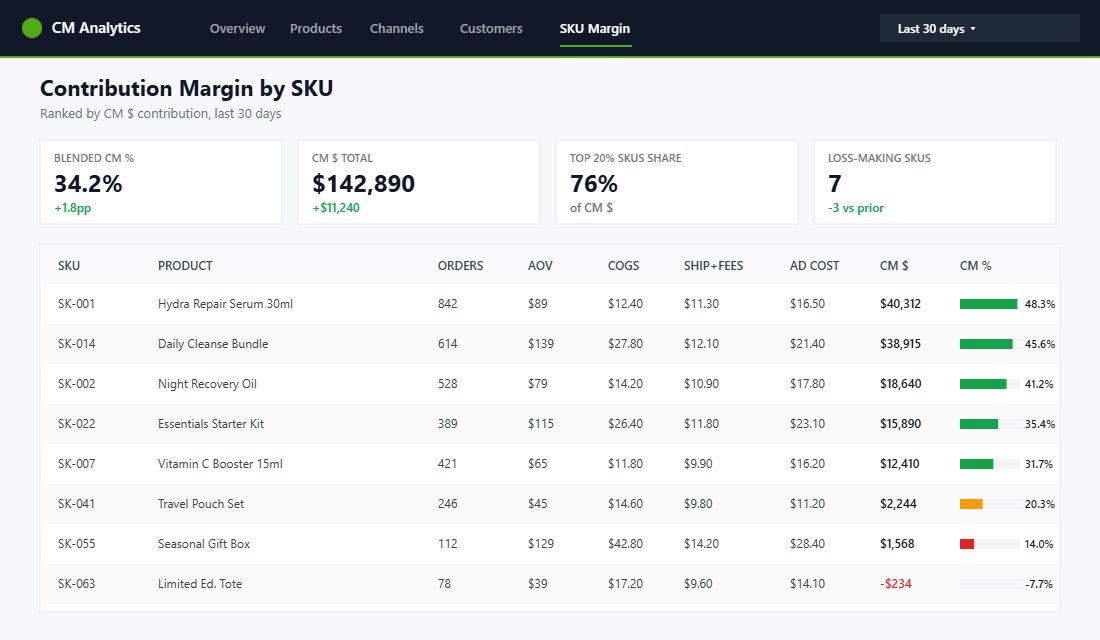
When you calculate CM at the SKU level, you almost always find something like this: 15% to 25% of your SKUs are generating 70% to 80% of your contribution dollars. Another 15% to 30% are either at zero contribution or actually negative once ad cost is attributed.
That’s the Pareto distribution showing up in your product catalogue. It means two things.
First, your bestsellers are subsidising your dead stock. You’re spending ad dollars, email real estate, and homepage attention on SKUs that make you no money. Sometimes that’s deliberate (a loss leader to acquire a customer into a higher-margin range). Usually it’s accidental.
Second, the SKUs at the top of the distribution deserve a completely different strategy. More ad budget, more on-site merchandising, more email features, more inventory depth, more bundle placements, more LP real estate. You’re underinvesting in the winners because you’re averaging across the whole catalogue.
To run this properly you need a SKU-level contribution margin spreadsheet. Not Shopify Analytics. A real one, with formulas, updated monthly.
Quick practical path to build it:
- Export your product catalogue from Shopify with variant-level pricing and COGS (Shopify Admin, Products, Export).
- Add columns for: average shipping cost per unit, packaging cost, payment fees percentage, expected return rate percentage, ad cost allocated per unit.
- Calculate CM$ and CM% per variant with a simple formula row.
- Sort from highest CM$ to lowest.
- Flag any SKU with CM% below 15%. These are the ones you need to fix, reprice, bundle, or retire.
If you’ve never done this, block out three hours this weekend. You’ll find money on the floor. I’ve run this exercise with brands doing $500K a year who found $45K in leaked margin sitting in five loss-making SKUs that had been on the site for two years.
The Five Levers You Can Pull to Lift CM by 5 to 15 Points
Lever 1: Renegotiate COGS (Biggest Lever, Most Avoided)
Every 12 to 24 months, revisit your supplier pricing. Most Aussie brands we work with haven’t renegotiated in three years because “the supplier relationship is good.” That’s exactly when you should be asking. A strong relationship with consistent volume is the negotiation.
Send your supplier a clean email stating your current annual volume, your 12-month forecasted volume, and ask for a tiered price list at three volume bands. A 6% to 10% drop in landed COGS on a bestseller can add 3 to 5 full points to contribution margin.
If you’re ordering on USD or EUR contracts, negotiate AUD-denominated terms or at least a quarterly FX adjustment clause. The Reserve Bank of Australia’s 2025 data showed the AUD/USD moved roughly 8% through the year. That volatility is a hidden margin tax if you wear all of it yourself.
Lever 2: Raise Prices Strategically (Not Across the Board)
Most Aussie brands are chronically scared of raising prices. It’s almost always a mistake. Your customers are less price-sensitive than you think, especially on products they already love.
McKinsey’s 2024 Global Pricing study showed a 1% price increase, held without volume loss, lifts operating profit by an average of 8% to 10% across retail businesses. That’s because price goes straight to the bottom line with zero extra cost attached.
Raise prices on the top 20% of SKUs where you have the strongest brand pull and the clearest competitive moat. Leave your entry-level SKUs alone so your acquisition funnel stays intact. Test a 5% to 8% lift and measure units sold over a 4 to 6 week window. If volume holds or drops less than 5%, you’ve made yourself significantly more profitable.
Lever 3: Push AOV Through Bundles and Subscriptions
Lifting AOV is the cleanest CM lever because it spreads your fixed-per-order costs across more units. Shipping $8.80 on a $95 order is 9.3% of revenue. Shipping $8.80 on a $165 bundle order is 5.3%. That 4 points difference lands straight on the contribution line.
If you haven’t set up product bundles yet, our product bundling guide for Shopify walks through the exact bundle structures that lift AOV 20% to 40% on Aussie skincare, fashion, and food brands.
Subscriptions do the same thing while locking in repeat revenue and smoothing your cash flow. Our subscription commerce playbook goes deep on the model, the app choice (Recharge, Loop, Appstle), and how to price subscriptions so you don’t accidentally give away too much margin on the discount offered.
Lever 4: Fix Your Shipping Economics
Free shipping thresholds are the single biggest CM killer for Shopify brands that offer them wrong. If your threshold is below your current AOV, you are essentially running a perpetual promo that destroys margin on every order.
Our free shipping threshold strategy article goes deeper, but the short version: set your threshold at 1.3x to 1.5x your current AOV. That nudges average order size up while protecting your CM on smaller orders where shipping was eating you alive.
Beyond threshold strategy, negotiate your Aussie freight rates. If you’re shipping more than 500 parcels a month, you should not be paying retail Australia Post. A direct StarTrack account, a Sendle volume tier, or a Shippit multi-carrier setup can cut your per-parcel cost by $1.50 to $3.00. On a $95 AOV, that’s 2 to 3 points of contribution added. Forever.
Lever 5: Cut Operational Bloat Hiding in Variable Costs
Your app stack is mostly a fixed cost, but any app on a per-order, per-SMS, or per-usage plan is eating your CM directly. Klaviyo SMS at $0.045 per send on a 10,000-subscriber list during a BFCM campaign can quietly cost you thousands in a single weekend.
Our Shopify app stack audit walks through the exact process for finding $500 or more a month in bloat. On high-volume Aussie stores we’ve audited, usage-based apps have been eating 2% to 3% of contribution margin without the founder noticing.
Returns are the other hidden cost. If you’re not charging a restocking or return shipping fee on fashion and homewares, your returns rate is fully absorbed on your CM line. Australian Consumer Law does not require you to offer free returns for change of mind. A $9.95 return shipping fee on change-of-mind returns recovers 70% to 100% of the outbound freight cost.
How Contribution Margin Changes Your Ad Buying Forever
This is where most founders have an aha moment.
Once you know your true CM per order, you know your break-even ROAS. It’s not what Meta tells you. It’s not 3x as a rule of thumb. It’s specific to your store.
Break-even ROAS = 1 / CM%
At 34% CM, your break-even ROAS is 2.94x. Anything above that is profitable on first order. Anything below is an investment in acquisition that has to be paid back via repeat purchase.
That single fact reframes how you run ads. If your CPA keeps climbing and your first-order ROAS drops to 2.5x, you’re not “scaling hard.” You’re bleeding. You need to either lift CM by 5 to 7 points to pull break-even down, or prove that LTV on orders two and three makes up the gap.
If you’ve built out customer lifetime value tracking on Shopify, you already know exactly how much loss on first order your repeat curve can absorb. Brands without CLV visibility scale into oblivion assuming “LTV will save us.” Usually it doesn’t, because the assumed repeat rate never shows up in the data.
This is also why MER (Marketing Efficiency Ratio) is the number more sophisticated Australian brands use to run Meta and Google together. MER looks at total revenue divided by total ad spend across all channels. It’s immune to attribution drift, which has been a real problem since iOS 14.5 and under Apple’s continued privacy updates. Platform-reported ROAS has become unreliable. MER against your CM benchmark is what actually tells you if the paid media is earning its keep.
If your Meta account structure is all over the place, work you do on CM will be masked by messy attribution. Our Meta ads account structure guide covers the campaign layout we use to keep creative, audience, and measurement clean so the CM signal is actionable.
The Weekly Rhythm That Stops CM Drift From Catching You Off Guard
Contribution margin decays. Suppliers raise prices. Return rates creep up. Shipping zones shift when you add an interstate warehouse. Ad CPMs spike in Q4. If you only check CM quarterly, you’ll notice a 5-point drop after you’ve already burned six months of profit covering it.
The Aussie brands that stay ahead run a weekly CM dashboard. Not monthly. Weekly. Twenty minutes every Monday morning.
Your minimum viable CM dashboard covers:
- Blended store-level CM% this week versus the trailing 8-week average.
- Top 10 SKUs by CM dollars and their week-on-week change.
- Returns rate (percentage of orders returned) and return reason code mix.
- MER and blended CPA across Meta, Google, and TikTok.
- Landed COGS on your top 10 SKUs, flagged red if changed from the previous week.
- Fulfilment cost per order from your 3PL invoice split by order count.
You can build this in Google Sheets with a weekly export, or connect a dashboarding tool like Triple Whale, Peel, or Polar Analytics. For Aussie Shopify brands under $3M AUD in revenue, a Sheets-based dashboard works fine and avoids adding another $500 to $700 a month to your tool stack. Above $3M, a proper dashboard tool starts paying for itself.
Investigate anything that moves more than 2 percentage points week-on-week. It’s almost always one of four things: supplier price drift, a shipping zone issue (dimensional weight change on a new product), a returns spike on a specific SKU, or a CPM spike on ads. All four are fixable the week you catch them. All four are catastrophic if you let them compound for a quarter.
The Compound Effect: Why Small CM Lifts Change Everything
Here’s the part most founders underestimate. Contribution margin is a compounding lever. A small lift today is a massively bigger business two years from now.
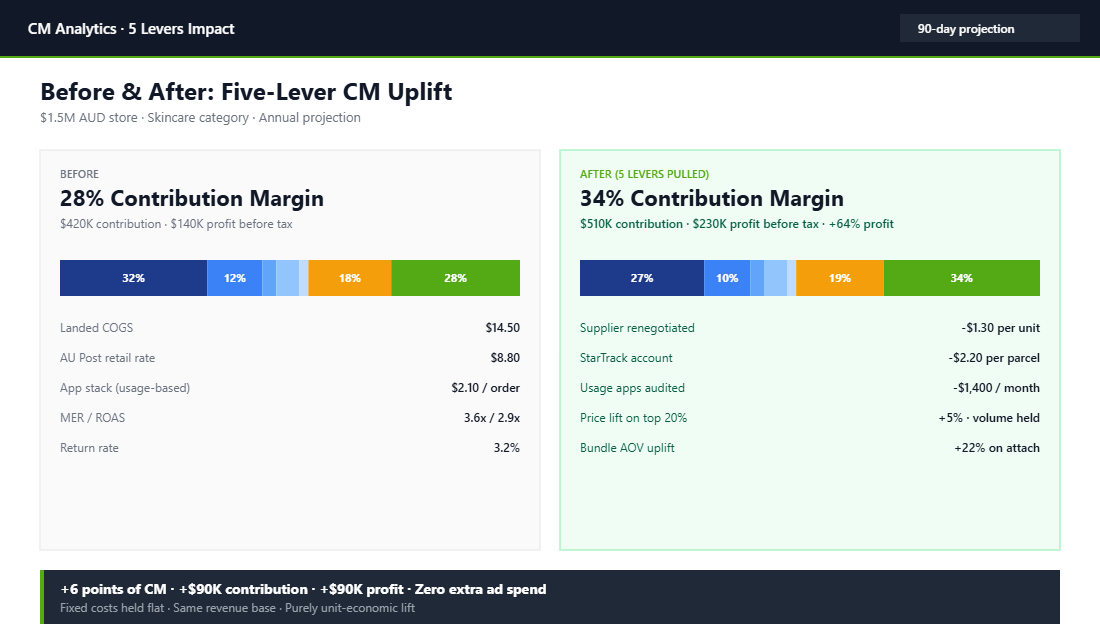
Take a store doing $1.5M AUD a year at 28% CM. That’s $420K in contribution, against (say) $280K in fixed costs, leaving $140K in profit before tax.
Now lift CM from 28% to 34%. A six-point improvement from pulling three of the five levers above. Same revenue. Contribution is now $510K. Fixed costs haven’t moved. Profit before tax is $230K.
That’s a 64% profit uplift without a single extra sale.
Now add any reasonable revenue growth on top. A 20% revenue lift to $1.8M with CM held at 34% pushes profit to $332K. That’s a 137% profit lift versus the baseline, on a 20% revenue lift. The magic isn’t the growth. It’s the fact that your unit economics are now carrying the growth instead of fighting it.
This is why CM is the number that actually controls whether you can scale, hire, take your founder salary up, or invest in a bigger marketing push. Revenue growth without CM discipline is a treadmill. Revenue growth with CM discipline is how stores get sold for 5x to 8x EBITDA at exit.
Common CM Mistakes We See in Aussie Shopify Brands
After running this exercise with hundreds of Australian Shopify stores, the same mistakes show up over and over.
- Not subtracting ad cost from the CM calculation. The most common and the most damaging. Stores think they’re at 45% CM when they’re really at 22% once ads are attributed.
- Using gross margin from Shopify Analytics as “margin.” Shopify’s profit reports don’t include shipping, returns, or marketing. They’re gross margin at best.
- Pricing off COGS plus a multiplier. The old 3x or 4x COGS rule collapses the moment your real variable stack is 55% of price instead of 30%.
- Ignoring the CM hit on discount-heavy campaigns. A 25% off promo on a store with 35% CM leaves 10 points of contribution. Then shipping, returns, and ads eat it. The promo is CM-negative and founders celebrate it as a “record day.”
- Treating AU Post rate hikes as inevitable. They are. But your pricing isn’t. If freight goes up 4.5%, your retail price needs to catch up within one quarter or your CM silently drops.
- Tracking CM only at store level. Already covered above, but worth repeating. The SKU-level view is where every meaningful decision comes from.
An Aussie Example of CM-Driven Scaling
Consider what Aussie brands that have made it to nine figures share in common. July Luggage, Who Gives A Crap, Frank Body, Go-To, Bellroy. None of them scaled by chasing revenue. They scaled by protecting unit economics brutally through every growth stage.
The pattern is always the same: strong founding margin, obsessive attention to supplier cost as volume grows, pricing discipline (none of them race to the bottom), a clear shipping strategy that doesn’t give AU Post most of the profit, and a retention machine that makes order two and three cheaper to acquire than order one.
That’s what good CM discipline looks like from the outside. It doesn’t show up as any one big decision. It shows up as a weekly rhythm of small decisions, made by a founder who knows their numbers, made against a benchmark they’ve defended for years.
Putting It All Together
If you do nothing else after reading this, do these three things this week:
- Calculate your real contribution margin on a typical order using the full formula. Not gross margin. The real one with ads, shipping, returns, and fulfilment all included.
- Build a SKU-level CM table for your top 30 SKUs. Identify the top 20% that carry the store and the bottom 20% that are draining it.
- Pick one of the five levers (supplier renegotiation, price lift, AOV bundle, shipping rate fix, or app audit) and execute on it in the next 30 days.
The brands that grow profitably through 2026 and 2027 will be the ones who know their CM to the decimal point, check it weekly, and defend it ruthlessly. The ones who fly blind on this number will keep mistaking revenue growth for progress, right up until cash flow finally catches them.
A Worked Example: How A 0K/Month Aussie Brand Found 11 Points Of CM In 60 Days
Numbers in isolation are abstract. Here is what a contribution margin audit actually looks like for a typical mid-stage Aussie Shopify brand. Imagine you run a homewares store doing $100K/month in revenue. AOV is $128 AUD. Headline gross margin (revenue minus COGS only) sits at a respectable 62%. You assume you are doing fine — until you map the full cost stack.
Here is what falls out when you actually pull the levers:
- Hidden cost 1 — Payment processing: 2.4% via Shopify Payments + 0.6% in BNPL fees. Moving 30% of volume to Shop Pay reduces blended rate by 0.3%. CM lift: 0.3 points.
- Hidden cost 2 — Shipping subsidy: “Free shipping over $80” is actually costing you $7.40 per order on average. Raise threshold to $99 and shipping cost-per-order drops to $5.10. CM lift: 1.8 points.
- Hidden cost 3 — Discount discipline: Average discount given is 14% (codes, abandoned-cart offers, sale events). Cap codes at 10% and remove auto-applied sitewide sales except for two anchor events a year. CM lift: 3.2 points.
- Hidden cost 4 — App bloat: $740/month across 18 apps. Half are duplicating functions. Cull six, save $310/month. CM lift: 0.3 points.
- Hidden cost 5 — Returns: 11% return rate. Adding sizing photos to your top 20 SKUs and a one-question post-return survey identifies sizing as 60% of returns. Adjusting size guide drops return rate to 7%. CM lift: 2.4 points.
- Hidden cost 6 — SKU-level CM pruning: 20% of SKUs have negative CM once you load them with allocated shipping and pick-pack. Pull them from paid-traffic landing pages and merch-stream them only. CM lift: 3 points.
Total CM lift: ~11 points. On $1.2M of annual revenue, that is roughly $132K in incremental annual profit — none of which required a single extra dollar of ad spend or a single new customer. This is what we mean when we say contribution margin is the most underused lever in the Aussie ecommerce playbook.
For the operational layer that supports this, see our deep dive on COGS optimisation and the 8-week rolling cash flow forecast we use with members.
The Tools That Actually Surface CM Leaks
You do not need a fractional CFO to do this work. The Aussie tool stack is more than enough for most stores under $5M/year:
- Lifetimely: Profit analytics native to Shopify. Best for surfacing SKU-level CM and channel-level CAC.
- TripleWhale: Stronger on ad attribution but the CM and unit economics dashboards are excellent. Pricier but worth it past $50K/month.
- Drapper: Aussie-built finance dashboard built specifically for Shopify brands. Good middle ground.
- Xero or QuickBooks: Non-negotiable. Pair with the A2X connector to keep COGS and refund accounting clean inside the GL.
- Shopify’s own Profit dashboard (beta): Now serviceable for headline numbers but still incomplete for true CM. Use it as a sanity check, not a source of truth.
Pick one. The mistake we see most often is brands using three tools and trusting none of them. Pick the platform that fits your stage, commit to it for 90 days, and build your monthly review around its numbers.
Next Step
Inside the eCommerce Circle, contribution margin is a core piece of the Profit pillar in the 10 P’s Operating System. Every brand we work with runs a CM audit as one of the first deliverables. Most discover 3 to 8 points of margin sitting in plain sight, usually across supplier pricing, shipping inefficiency, discount discipline, and app bloat.
Once that base is fixed, everything else in the business compounds on top of it. Your ads get more aggressive. Your retention investment pays back faster. Your cash position allows you to invest in the next growth phase instead of firefighting the current one.
If you want someone to look at your store’s unit economics with you and build a ruthless plan to lift your contribution margin, let’s talk. We’ll run a focused session on your numbers, your product mix, and your cost stack, and you’ll leave with the exact CM lift plan for the next 90 days.
Let’s Talk About Your Margins →