You’re doing $50K months. Revenue is climbing. Your Meta Ads are humming. But when you check your bank account at the end of the month, the number doesn’t match the story your revenue tells.
What’s in This Article
Sound familiar? Here’s the brutal truth most Shopify store owners don’t want to hear: your revenue doesn’t determine your profit — your Cost of Goods Sold does. COGS is the single biggest line item on your P&L, and for most ecommerce brands, it sits somewhere between 25% and 50% of total revenue. That means for every dollar you bring in, you’re handing back 25 to 50 cents before you’ve paid for ads, staff, software, or rent.
Yet most store owners spend 90% of their time obsessing over the top line — more traffic, more conversions, more revenue — and almost zero time optimising the costs that eat into every single sale. The brands that actually build wealth from ecommerce? They attack COGS with the same intensity they bring to their marketing. And the results compound fast.
What COGS Actually Includes (And What You’re Probably Missing)
Before you can optimise your COGS, you need to understand exactly what goes into it. Most store owners think COGS is just “what I paid my supplier for the product.” That’s only part of the picture.
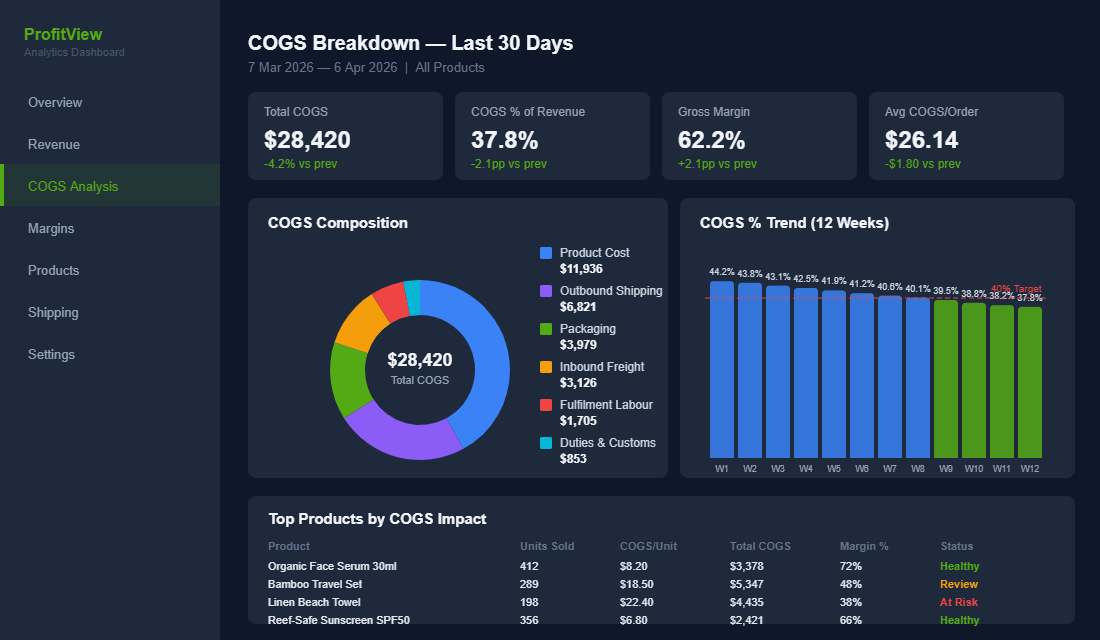
Your true COGS includes every cost directly tied to getting a product into your customer’s hands:
- Raw product cost. What you pay your manufacturer or supplier per unit — the obvious one.
- Inbound freight. Shipping from your supplier to your warehouse or 3PL. If you’re importing from China or Southeast Asia, this can add 8-15% to your product cost.
- Customs duties and tariffs. Australian import duties vary by product category, but they can add 5% or more on top of the landed cost for certain goods.
- Packaging materials. Your mailer bags, boxes, tissue paper, stickers, thank-you cards — packaging typically represents 10-15% of total fulfilment costs and is often the second-largest expense after labour.
- Pick, pack, and fulfilment labour. Whether you’re packing orders in your garage or paying a 3PL, there’s a per-order cost to get products out the door.
- Outbound shipping. The cost of getting that parcel from your warehouse to your customer’s door. Shipping often comprises 20-30% of total COGS for ecommerce brands.
When you add all of that up, your “real” COGS is almost always higher than the number sitting in your Shopify reports. And if you’re not tracking every component, you’re making pricing and margin decisions based on incomplete data. That’s a recipe for slowly going broke while your revenue graphs look healthy. If you haven’t already mapped out your true cost per order, that’s your first move.
The COGS Benchmarks You Should Be Targeting
Not all ecommerce businesses are created equal, and your ideal COGS percentage depends heavily on your product category and business model. But here are the benchmarks that separate profitable stores from ones that are slowly bleeding cash:
Healthy COGS ranges by category:
- Fashion and apparel: 35-50% of revenue (aim for the lower end with direct-to-manufacturer relationships)
- Beauty and skincare: 15-30% of revenue (high-margin category, but watch out for packaging costs eating into that)
- Electronics and tech accessories: 50-75% of revenue (thinner margins, so volume and AOV matter more)
- Food and beverage: 30-45% of revenue (perishability adds waste costs most brands underestimate)
- Home and lifestyle: 40-55% of revenue (bulky items push shipping costs higher)
The general rule? For a typical ecommerce business selling physical products, your all-in COGS should be no more than 40% of your retail price if you want to maintain a healthy net margin after marketing, platform fees, and overheads. According to industry data, the average ecommerce retailer ends up with roughly 20% net profit when you account for COGS at 40%, marketing at 15%, platform and marketplace fees at 12%, payment processing at 3%, and shipping at 10%.
If your COGS is above 50%, you’ve got a structural problem. No amount of marketing wizardry will fix a business where half of every dollar goes to product costs before you’ve spent a cent on growth.
Strategy 1: Negotiate Smarter With Suppliers (Without Burning Bridges)
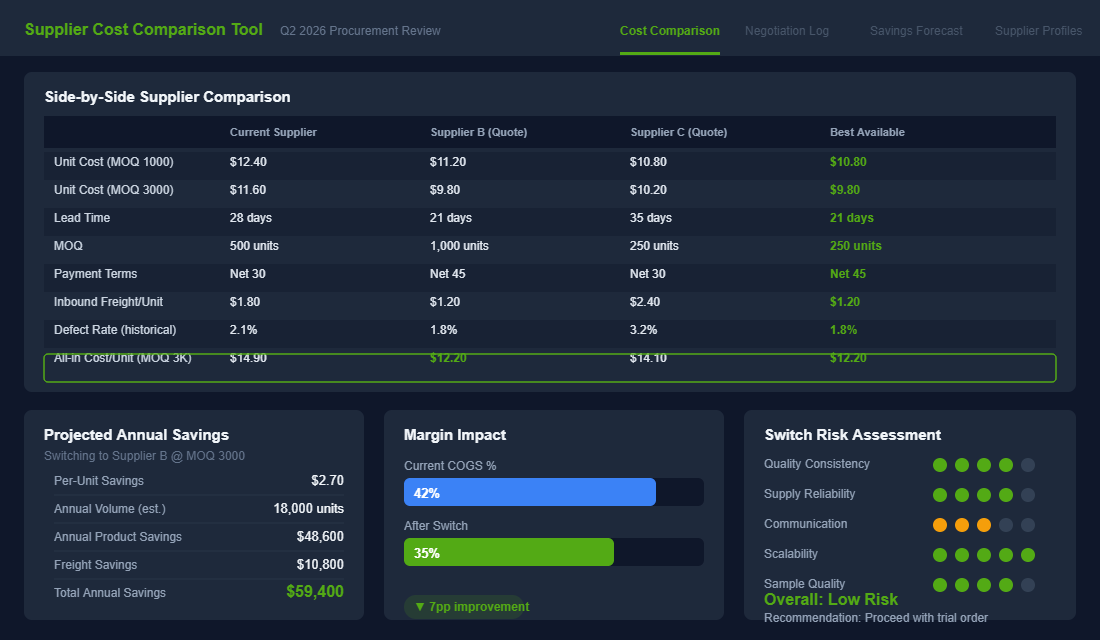
Your supplier relationship is the single biggest lever you have over your COGS. A 10% reduction in your per-unit product cost drops straight to your bottom line — and unlike a 10% increase in revenue, it doesn’t cost you anything in ad spend to achieve it.
But most store owners approach supplier negotiations wrong. They either never negotiate at all (leaving money on the table), or they go in aggressively demanding lower prices (burning relationships and risking quality).
Here’s how to do it right:
Lead with data, not demands. Before any negotiation, build a “should-cost” model. Research what raw materials cost, estimate manufacturing time, factor in supplier margins. When you walk in with a fact-based breakdown of costs, the conversation shifts from “give me a better price” to “let’s find efficiencies together.” Suppliers respect buyers who understand their cost structure.
Negotiate beyond the unit price. If your supplier won’t budge on per-unit pricing, there are other levers that save you just as much money. Push for better payment terms — moving from 30-day to 60-day terms improves your cash flow dramatically. Negotiate on minimum order quantities (MOQs) to reduce inventory carrying costs. Ask about freight consolidation or FOB pricing to cut your inbound shipping bill.
Offer volume commitments. Suppliers give their best pricing to buyers who reduce their risk. If you can commit to quarterly purchase volumes or sign an annual agreement, you’ll unlock tier pricing that ad hoc buyers never see. A guaranteed order of 5,000 units per quarter is worth more to a manufacturer than sporadic orders of 500. Bulk purchasing agreements typically achieve 10-20% material savings.
Get competitive quotes — and use them strategically. Every 12 months, get quotes from 2-3 alternative suppliers. You don’t need to switch — but having real alternatives gives you leverage. When your current supplier knows you have options, they’re much more likely to sharpen their pricing on renewal.
Consider regional sourcing. With global shipping costs still elevated post-pandemic, Australian brands are increasingly looking at suppliers in Southeast Asia, India, or even domestic manufacturers for certain product categories. Shorter supply chains mean lower freight costs, faster lead times, and less capital tied up in transit inventory.
Strategy 2: Cut Your Packaging and Shipping Costs Without Cutting Corners
After your raw product cost, packaging and shipping are typically the next biggest COGS components. And unlike supplier pricing, these are areas where you have direct, immediate control.
Right-size your packaging. This is the single fastest win for most ecommerce brands. Shipping carriers calculate dimensional weight (DIM weight) based on package volume, not actual weight — meaning a lightweight product in an oversized box could cost you 5-10x more to ship than it should. Brands that implement right-sizing strategies see 15-20% shipping cost reductions almost immediately.
Audit every SKU you ship. Do your mailer bags actually need to be that large? Could you switch from a box to a satchel for certain products? Are you using filler material to pad out oversized packaging? Every cubic centimetre of wasted space is money you’re sending to Australia Post or your carrier for nothing.
Consolidate your packaging SKUs. If you’re carrying 15 different box sizes, you’re overcomplicating your fulfilment and probably overpaying on packaging unit costs. Most Shopify stores can get by with 3-5 packaging sizes that cover 90% of their orders. Fewer SKUs means better volume pricing from your packaging supplier and faster pick-and-pack times.
Rethink your branded packaging. That beautiful custom tissue paper and metallic sticker might cost you $2.50 per order. Multiply that by 1,000 orders a month, and you’re spending $30,000 a year on packaging aesthetics. I’m not saying ditch the unboxing experience — it matters for retention and UGC. But be strategic about it. Frank Body built a cult following with simple kraft packaging and a cheeky tone. You don’t need luxury packaging to create a memorable moment.
Review your carrier rates quarterly. Don’t set and forget your shipping contracts. Australian carrier rates shift regularly, and if you’re growing, your volume should be unlocking better rate tiers. Get quotes from Sendle, Australia Post eParcel, Aramex, and CouriersPlease at least twice a year. Even a 5% reduction on shipping rates across thousands of orders adds up to real money.
Consider a 3PL at the right stage. If you’re processing more than 1,000 orders per month, a third-party logistics provider can typically achieve 15-30% shipping cost savings through negotiated carrier rates and zone-skipping strategies that individual brands can’t access. According to industry data, 64% of companies using 3PLs report reduced operating costs. The typical break-even point is between 1,000-3,000 orders per month, depending on your product characteristics and current setup.
Strategy 3: Reduce Waste and Dead Stock With Demand Forecasting
Here’s a COGS killer that doesn’t show up on most store owners’ radar: dead stock. Every unit sitting in your warehouse that doesn’t sell is money you’ve already spent on COGS that will never generate revenue. And the longer it sits, the more it costs you in storage fees, opportunity cost, and eventual markdowns.
Smart demand forecasting doesn’t require a data science degree. Here’s how to approach it:
Track your sell-through rate by SKU. Your sell-through rate is the percentage of inventory you sell within a given period (typically 30 days). A healthy sell-through rate for most ecommerce products is 20-30% per month. If you’ve got SKUs sitting below 10%, you’ve got a dead stock problem that’s silently inflating your effective COGS.
Order smaller, more frequently. The old playbook was to order massive quantities for the best per-unit price. But that equation changes when you factor in storage costs, cash tied up in inventory, and the risk of products not selling. In many cases, ordering 20% more frequently at slightly higher per-unit costs actually reduces your total COGS when you account for waste, markdowns, and carrying costs.
Use your data to forecast. Shopify’s built-in analytics give you sales velocity data by product. Combine that with seasonality patterns (especially important in Australia where seasons are flipped for global trends) and you can build a reliable 90-day demand forecast. Tools like Inventory Planner for Shopify automate this and use AI-driven algorithms to predict demand — brands using AI demand forecasting have reported reducing overstock by up to 25%.
Implement a dead stock protocol. Set a rule: any product that hasn’t sold a unit in 60 days gets flagged. At 90 days, it gets bundled, discounted, or liquidated. Don’t let emotional attachment to products override the maths. That slow-moving inventory is costing you warehouse space, insurance, and the opportunity cost of capital that could be invested in your best sellers.
Strategy 4: Track Your COGS Properly (The Tools You Need)
You can’t optimise what you can’t measure. And Shopify’s default reporting, while decent, doesn’t give you the full COGS picture out of the box. You need a dedicated profit tracking tool that pulls in all cost components.
Here are the best options for Australian Shopify stores in 2026:
BeProfit (from $49/month). This is the pick for most growing Shopify brands. BeProfit connects directly to your Shopify store, ad accounts, and expense sources to calculate real-time profit per order, per product, and per channel. You can input COGS at the product level, track shipping costs, and see your true net margin after everything is accounted for.
Here’s how to set it up:
- Install BeProfit from the Shopify App Store and connect your store.
- Enter your product costs — you can do this by individual SKU, by bulk CSV upload, or by setting a default COGS percentage across categories.
- Connect your ad accounts (Meta, Google, TikTok) so the tool can factor in your customer acquisition costs alongside COGS.
- Set up your shipping cost rules — flat rate per order, carrier-specific rates, or actual cost per shipment.
- Add any other recurring costs: packaging, fulfilment fees, transaction fees, software subscriptions.
- Review your Profit Dashboard daily. Focus on the “Profit per Order” metric — this is the number that tells you whether your COGS is in the healthy range.
Lifetimely by Amp (from $149/month). If you want deeper LTV and cohort analysis alongside your COGS tracking, Lifetimely is excellent. It factors in cost of goods, ads, shipping, and other expenses to give you real-time profitability insights — plus it layers in customer lifetime value data so you can see not just your margin per order, but your margin per customer over time. This is particularly powerful for subscription and repeat-purchase brands where the initial COGS hit is recovered over multiple orders.
Link My Books or Amaka (for accounting sync). If your primary goal is getting accurate COGS data into your accounting software (Xero or QuickBooks — the standards for Australian businesses), these tools automatically sync your Shopify sales, fees, and COGS into your accounting platform. This means your BAS reporting and end-of-financial-year numbers actually reflect your true cost structure.
The key insight here: checking your COGS monthly isn’t enough. The brands that maintain the healthiest margins review their cost metrics weekly — catching supplier price creep, shipping rate changes, and inventory issues before they compound into serious margin erosion. Here’s how that fits into your broader pricing and margins strategy.
Strategy 5: Rethink Your Product Mix to Improve Blended COGS
Sometimes the fastest way to improve your COGS isn’t to reduce costs on existing products — it’s to shift your sales mix toward higher-margin items.
Identify your margin heroes and margin drains. Export your product catalogue with COGS data and rank every SKU by gross margin percentage. You’ll almost always find a pattern: 20% of your products generate 80% of your gross profit, while a long tail of low-margin items drag down your blended COGS.
Promote your high-margin products harder. Once you know which products deliver the best margins, direct more ad spend, email real estate, and homepage placement toward them. If Product A has a 70% gross margin and Product B has a 30% gross margin, every sale you shift from B to A drops more cash to your bottom line — even if the revenue per order is the same.
Build bundles strategically. Bundling is one of the most underused COGS optimisation tactics in ecommerce. Pair a high-margin product with a lower-margin one, and you increase AOV while improving your blended margin. The customer perceives more value (because they’re getting “more stuff”), and you’re effectively using the high-margin item to subsidise the lower-margin one. Done right, bundling can improve your blended COGS by 5-10%.
Consider digital add-ons. Digital products (guides, templates, video courses, care instructions) have zero COGS. If you can add a $15 digital product to a $50 physical order, you’ve just improved the margin on that transaction dramatically. Who Gives A Crap doesn’t sell digital products, but they’ve built a brand so strong that customers pay a premium for toilet paper — proof that brand equity itself is a margin lever.
The Compound Effect: How Small COGS Wins Add Up to Massive Profit
Here’s where COGS optimisation gets exciting. Unlike most growth tactics, COGS improvements compound across every single order.
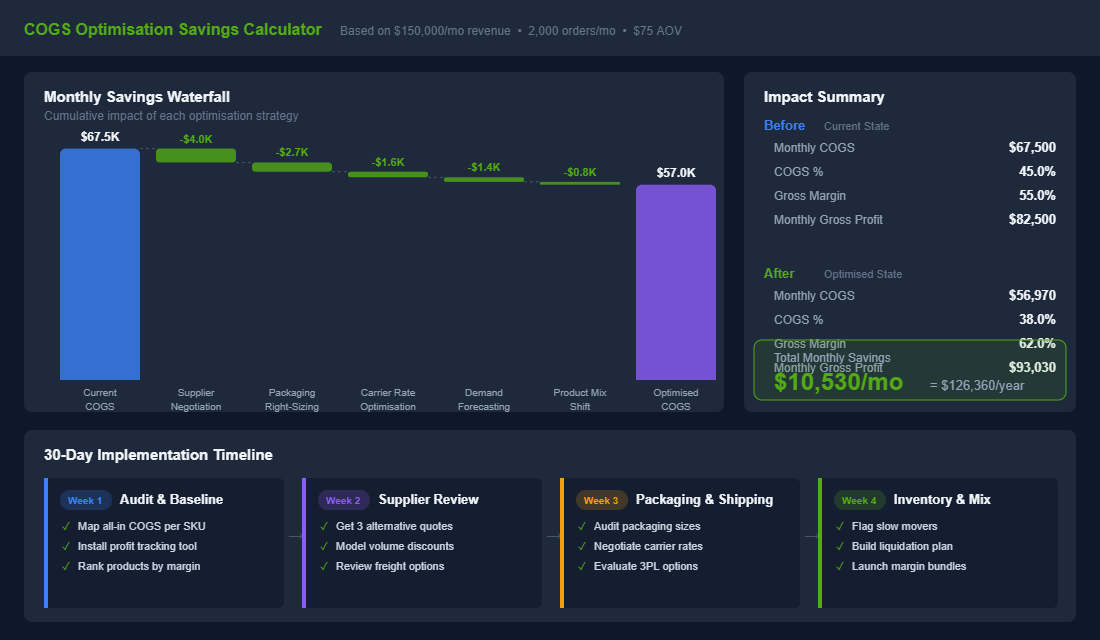
Let’s run the maths on a store doing 2,000 orders per month at a $75 AOV — that’s $150,000 in monthly revenue.
If your current all-in COGS is 45% ($67,500/month), and you implement the strategies above to bring it down to 38%, here’s what happens:
- Monthly COGS saving: $10,500
- Annual COGS saving: $126,000
- Gross margin improvement: From 55% to 62%
That $126,000 per year goes straight to your bottom line. No extra ad spend. No extra traffic. No new customers required. Just smarter operations on the sales you’re already making.
And here’s the real kicker: that extra $126K gives you more budget to reinvest in growth. You can afford to bid higher on Meta, test new channels, hire a VA to handle customer service, or invest in product development. COGS optimisation doesn’t just improve today’s profitability — it funds tomorrow’s growth.
This is exactly what separates stores that hit a revenue ceiling from ones that scale past $1M, $5M, and beyond. Revenue gets you to the starting line. Margin management is what builds the business. For more on the numbers that matter, check out our guide to running sales without destroying your margins.
Your COGS Optimisation Checklist: The 30-Day Action Plan
Here’s a practical framework you can start implementing this week. Work through it over the next 30 days, and you’ll have a clear picture of where your money is going — and where the biggest savings opportunities are.
Week 1 — Audit and Baseline:
- Calculate your true all-in COGS per product (not just supplier cost — include freight, duties, packaging, fulfilment, and shipping)
- Install a profit tracking tool (BeProfit or Lifetimely) and input all cost data
- Rank all SKUs by gross margin percentage from highest to lowest
- Identify your bottom 20% margin products — these are your COGS problem children
Week 2 — Supplier and Procurement:
- Request updated quotes from 2-3 alternative suppliers for your top-selling products
- Model the impact of volume commitments on per-unit pricing with your current supplier
- Review your inbound freight costs and explore consolidated shipping options
- Check if any customs duty exemptions or concessions apply to your product categories
Week 3 — Packaging and Fulfilment:
- Audit your packaging sizes against actual product dimensions — identify DIM weight overages
- Get quotes from at least 2 new carriers or negotiate current rates with volume data
- Calculate your branded packaging cost per order and assess ROI on each component
- If doing 1,000+ orders/month, get 3PL quotes and run a total cost comparison
Week 4 — Inventory and Product Mix:
- Review sell-through rates for all SKUs — flag anything below 10% monthly sell-through
- Create a dead stock liquidation plan for slow-moving inventory
- Identify your top 5 highest-margin products and plan a promotional push
- Design at least one high-margin bundle combining strong and moderate performers
- Set up a weekly COGS review in your profit tracking dashboard
Australian COGS Reality: GST, FX, and the Hidden Costs Most Stores Forget
Most COGS templates online are built for US stores and miss the Australian-specific costs that quietly destroy your margin. If you import from China, the US, or the UK, your real cost per unit can be 18–35% higher than the supplier invoice once everything lands in your warehouse:
- Currency hedging. If your AUD weakens 5–10% against the USD between PO and payment, your COGS quietly inflates. Brands doing $500K+/year in COGS should set up forward contracts with OFX, Wise Business, or their bank. Saves 2–4% off COGS in volatile years.
- Inbound freight and customs. Sea freight from China sits at $1,800–$3,500 USD per 20ft container in 2026. Air freight is 4–6x sea. Add 10% GST on the landed value plus customs duty (most consumer goods sit at 5%, apparel 10%) — that is your real first-touch cost.
- 3PL fees. Receiving, storage, pick-and-pack typically adds $4–$9 per order in Australia. Brands using a Sydney 3PL only often overpay vs running a Sydney + Brisbane or Sydney + Perth combination for parcel-cost reasons.
- Last-mile shipping. Auspost MyPost Business and Sendle add $7–$15 per order. Free shipping on a $79 AOV product with 35% COGS quietly turns into a 8–14% margin leak.
- GST on B2C sales. Your sticker price already includes GST, but every founder I speak to forgets to strip the 1/11th out before calculating gross margin. A $99 sale is really $90 ex-GST when you do margin math.
COGS Benchmarks by Category: Are You Paying Too Much?
Knowing what “good” COGS looks like in your category is the cheat code most owners never use. Here is the real-world benchmark band for product COGS as a percentage of net revenue (after GST stripped out):
- Apparel and fashion: 30–45% (the higher end if you do small batches in Australia, lower if you import).
- Beauty and skincare: 18–28% — formulators, packaging, and compliance push you up.
- Supplements and nutraceuticals: 15–28% — hero formulas often hit 12–18% if you contract-manufacture in Australia.
- Homewares and decor: 35–55% — bulky goods get punished by freight.
- Pet products: 30–45%, with bulk dog food sitting closer to 50%.
- Electronics and accessories: 45–65% — thin margins are normal here, so volume is everything.
- Custom or print-on-demand: 50–65% — the hidden cost is fulfilment time and quality control.
If you are 5+ percentage points above your category median, that is not a tolerance issue — it is a contract issue. Time to renegotiate. Pair this with the right pricing strategy — see the pricing mistakes killing your margins.
The Tools That Pay for Themselves Inside 90 Days
- Cogsy ($199–$649/mo). Inventory and COGS forecasting that talks to Shopify directly. Pays for itself if it prevents one stockout or one overbuy per quarter.
- Inventory Planner ($199–$999/mo). Strong forecasting and PO automation. Better fit for brands with 200+ SKUs.
- Finaloop or A2X for proper Shopify-to-Xero/MYOB accounting that splits COGS, ad spend, and shipping cleanly. The single biggest cause of “I think I’m profitable but I have no cash” diagnoses I see.
- Settle or 8fig for inventory financing. Frees cash off your balance sheet so you can take advantage of larger order discounts that drop your COGS 8–15%.
Stop Chasing Revenue. Start Protecting Your Margins.
Every dollar you save on COGS is a dollar of pure profit. No ad spend required. No conversion rate optimisation needed. No new traffic to find. It’s the most direct path to a more profitable ecommerce business, and it’s sitting right there in your spreadsheet, waiting for you to pay attention to it.
The brands that win in ecommerce aren’t always the ones with the most revenue. They’re the ones that keep the most out of every sale. Start with the audit. Get your numbers right. Then work through the strategies above, one by one. The compound effect will surprise you.
Inside the eCommerce Circle, COGS optimisation and margin management are core pillars we work on with every member. If you’d like help auditing your cost structure and finding the hidden profit in your business, let’s talk.