Most Shopify founders spend more time choosing their logo font than confirming whether anyone actually wants what they’re about to sell.
What’s in This Article
The result? Thousands of dollars tied up in stock that barely moves, markdowns that destroy margins, and clearance sales that feel like public failure. A Harvard Business School professor found that 95% of the 30,000 new products launched each year fail in the market. In a survey of founders who shut their stores down, 63% admitted they hadn’t spent enough time validating demand before buying inventory.
The good news: proper validation costs $0 to $200 AUD and takes two to four weeks. The founders who do it consistently report less dead stock, faster initial sell-through, and better margins from day one. Here’s the five-step research playbook they follow.
Why Skipping Validation Is the Most Expensive Mistake in Ecommerce
There’s a common assumption that ecommerce is low-risk because you can start small. That’s partly true. But “starting small” doesn’t mean much if you’re still dropping $8,000 on stock in a category with three dominant brands, saturated margins, and a declining search trend you didn’t bother to check.
Inventory distortion (the combination of overstock and stockouts) cost global retailers $1.77 trillion in 2023 — equivalent to 7.2% of all retail sales. For a Shopify store doing $500,000 per year, that ratio translates to up to $36,000 in annual value destruction from buying the wrong products or buying them in the wrong volumes.
Validation doesn’t eliminate risk. It narrows the gap between what you think will sell and what actually does. The goal isn’t certainty. It’s informed conviction before you commit capital.
Step 1: Run the Google Trends Test (Free, 20 Minutes)
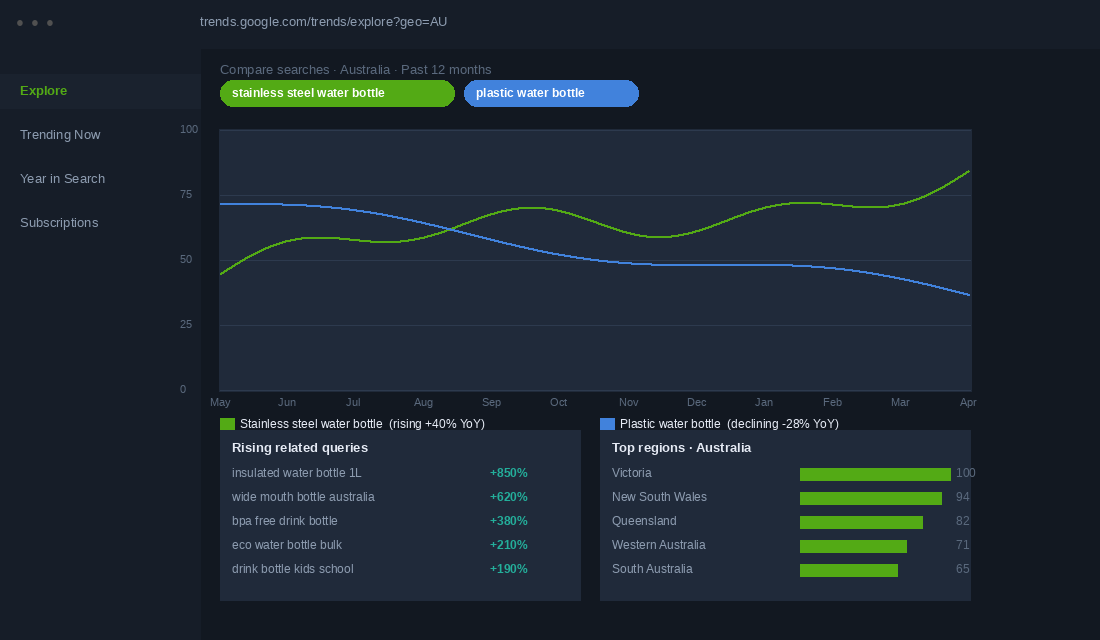
Google Trends is the most underused free research tool in ecommerce. It shows relative search interest for any keyword over time, across regions and categories. Before you look at a single supplier or product sample, start here.
Search your primary product keyword and set the region to Australia. Then check three things. First, is the trend going up, flat, or down? A flat trend over two years is acceptable. A consistent downward slope is a yellow flag worth taking seriously. Declining search trends tend to continue. Second, is this seasonal or evergreen? Surf accessories will spike every summer and slow in winter. That’s not a reason to avoid the category, but it is a reason to plan your cash flow accordingly and avoid entering right before the off-season. Third, what related queries are rising? The “Rising” section inside Trends shows terms gaining momentum before they’re fully saturated. That’s where early-mover advantage still exists in 2026.
Compare your product against at least two alternatives. If you’re deciding between “stainless steel water bottle” and “silicone water bottle,” run them side by side. The winner helps you name your products, write your ad copy, and structure your SEO from the start. Combine Google Trends with a keyword research tool like Semrush or Ahrefs to get approximate monthly search volumes behind the trend lines. Trends shows relative popularity. Keyword tools show the scale behind it.
Step 2: Research Where Your Customers Already Talk
This step surprises most founders because it has nothing to do with data tools. It’s about finding the communities where your target customer vents, asks questions, and shares their frustrations — before they have any idea you’re watching.
Reddit is where this research pays off most. Search for subreddits related to your product category and spend 30 minutes reading threads. You’re looking for three things: problems people mention repeatedly (not one-off complaints, but patterns across multiple threads), the exact language they use to describe the problem (these phrases become your product descriptions and ad headlines), and what they wish existed (feature requests, workarounds, product wishlist posts).
Do the same with Facebook groups in your niche. Pet product founders consistently find more research value in owner Facebook groups than in any paid tool. The complaints in those groups about leaking feeders, fragile toys, or misleading sizing charts are worth more than a month of keyword research.
This stage connects directly to the Jobs to Be Done framework for customer research. If you haven’t mapped out the real reason your customer is going to buy, it’s worth doing that before you run ads. Understanding the “job” your product performs — not just what it is, but why someone buys it — shapes everything from your homepage headline to your post-purchase email.
Step 3: Map the Competitive Landscape Before You Commit
Checking who else is selling your product isn’t just about knowing the competition. It tells you whether the market is ready, saturated, or underserved. And it shows you exactly where to position yourself before you write a single product description.
Search your primary product keyword on Amazon Australia. Look at how many results come back. Under 1,000 usually means low competition but possibly low demand. Between 1,000 and 10,000 is the sweet spot for most Shopify founders entering a category. Over 50,000 means you need a very specific angle, a strong brand, or a price point advantage to get traction.
Check the Best Seller Rank (BSR) numbers on top listings. Products with a BSR under 50,000 in their category are moving units consistently. Use Jungle Scout (around $49/month) to convert BSR into estimated monthly sales volume. This tells you whether there’s enough demand to sustain a new entrant. Then sort competitor reviews by 3-star ratings. That middle ground surfaces the most honest feedback. Repeated complaints about the same quality issue, sizing problem, or branding gap are your differentiation points.
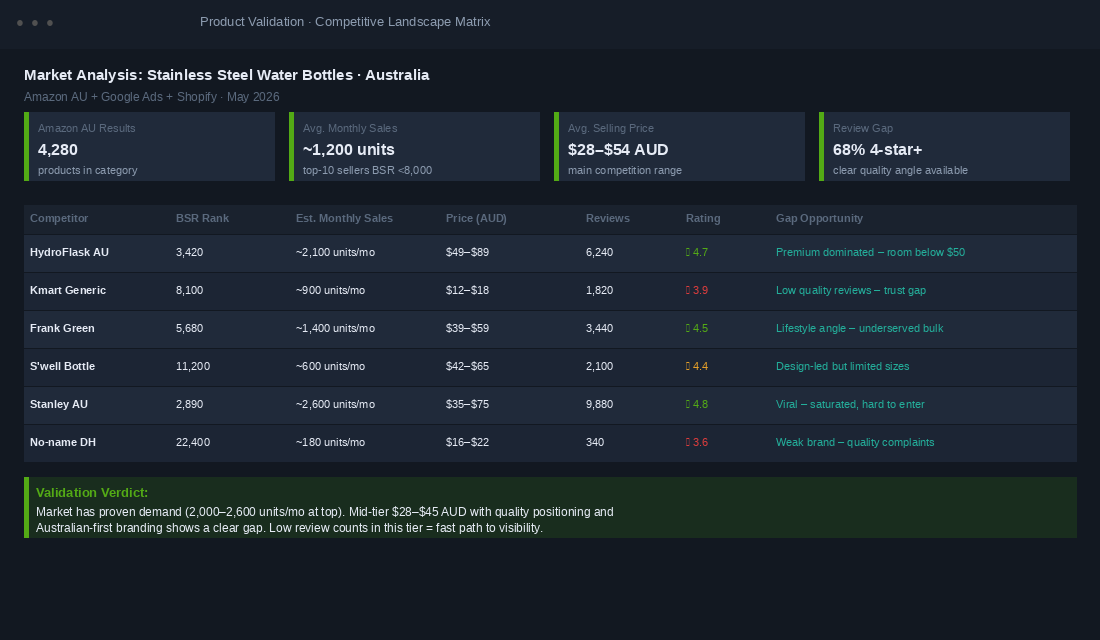
Then search for Shopify stores in the same space using Google: site:myshopify.com [your product keyword]. Check their pricing, product page structure, and whether they’re running ads (the Meta Ad Library is free and shows every active ad). For a full systematic approach to this stage, this competitive analysis framework walks you through the complete process.
Step 4: Run a Micro-Test Before You Place the Order
This is the step that separates founders who move confidently into inventory from those who cross their fingers and hope. A micro-test is a small, real-money experiment that tells you whether actual customers will pay for your product before you commit to a full order.
There are three options, in order of effort and cost.
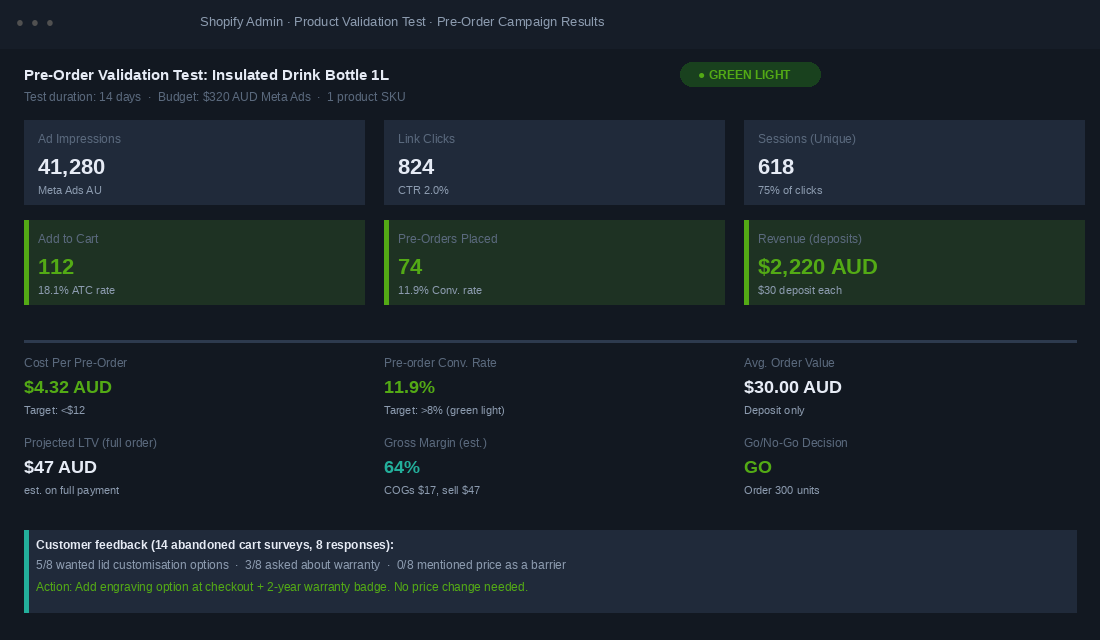
Option A: Pre-order page. Create a single Shopify product page for your product, set up a pre-order app (Timesact works well for this), and drive $200 to $400 in Meta ads to it over 10 to 14 days. A pre-order conversion rate of 10 to 20% is considered strong, compared to the standard ecommerce average of 2 to 4%. That means if 500 people visit your page and 60 place a pre-order, you’ve already confirmed real demand before buying a single unit. UK brand SPOKE reported 400% higher sell-through on products tested via pre-orders versus traditional launch methods.
Option B: Dropship first. Source a small batch through Shopify Collective or a dropship supplier to test real demand before committing to your own inventory. You’ll sacrifice margin, but you’ll learn what messaging converts, what the return rate looks like, and what customers actually ask at checkout before you’ve spent anything on manufacturing.
Option C: Test in person. Aussie founders consistently underestimate how powerful a weekend market or pop-up stall is for validation. The conversations you have with 50 strangers about your product will tell you more than 500 sessions of Google Analytics. You’ll hear objections you didn’t anticipate, see which packaging design people pick up first, and find out what they’d pay without you naming a number.
The goal at this stage isn’t to make money. It’s to find out whether real people will hand over real AUD.
Step 5: Read the Data and Make the Call
Once your micro-test is complete, you have one job: read the results honestly and make a decision. Here’s the framework for doing that without letting excitement or sunk-cost thinking cloud your judgement.
Green light (place the order): Pre-order conversion rate above 8%, cost per acquisition is lower than your expected gross margin, customer feedback is consistent with your product’s core claim, and no significant repeated objections appearing in abandoned cart patterns.
Amber light (iterate before scaling): Conversion rate is between 3% and 8%, some consistent objections around price, shipping time, or product uncertainty, add-to-cart rate is strong but checkout completion is weak (usually a trust issue that’s fixable with better social proof or a guarantee).
Red light (serious rethink): Conversion rate under 2% despite 300-plus unique visitors, multiple dominant competitors with strong review counts and no visible gap in the category, customer feedback reveals a fundamental mismatch between your positioning and the actual problem they’re trying to solve.
Red lights aren’t failures. They’re the research system working exactly as designed. Every $200 you spend validating a product that doesn’t convert is $8,000 of dead stock you didn’t buy. That’s a good outcome.
The Validation Stack: How the Five Steps Work Together
Run these five steps in sequence and you end up with something most founders never have before launch day: a clear, data-backed picture of whether your product deserves shelf space.
Google Trends tells you if demand is real and the trajectory is right. Community research tells you what problem you’re actually solving, in the customer’s own words. Competitive analysis tells you whether the market has room for a new entrant and where to position. The micro-test tells you whether your specific angle converts with real money at stake. Reading the data tells you whether to order 300 units or pivot to something else entirely.
Done together, these steps typically take three to four weeks. The total out-of-pocket cost is usually under $500 AUD, including ad spend. And they turn what most founders treat as a gut call into a calculated move.
Once you’ve validated a product and start selling, the research doesn’t stop. A proper Voice of Customer program captures ongoing feedback that improves your listings, ad messaging, and future product development. The VoC framework here walks through how to set that up systematically.
Validate the Margin, Not Just the Demand
Demand and viability are two different questions, and most founders only ever answer the first one. You can prove that 10,000 Australians a month search for your product, that the subreddit is full of people complaining about the current options, and that your pre-order page converted at 11%. None of that tells you whether the product makes you money.
Run the margin test before you place the order, using real numbers from your supplier quote rather than the unit price on the quote email. Your landed cost is the factory price plus freight, plus duty, plus GST on import, plus any customs brokerage, plus the inbound freight to your 3PL. On most first orders from Asia into Australia, that stack adds 25-40% on top of the ex-factory price, and founders who budget off the ex-factory number alone are wrong before they start. Our landed cost playbook walks the full calculation line by line.
Then work forward to contribution margin, not gross margin. Take your planned retail price, subtract landed cost, payment processing (roughly 1.75% plus $0.30 on Shopify Payments in Australia), pick and pack, outbound shipping, your expected returns rate, and any platform or app fees tied to the order. What is left is the real money that has to pay for advertising and still leave a profit.
Here is the version that decides it for you. A product landing at $22 and retailing at $69 looks like a 68% gross margin, which feels comfortable. Take out $1.51 in processing, $2.50 pick and pack, $9 shipping and a 6% returns allowance, and your contribution is around $30 a unit, or 43%. If your blended cost to acquire a first-time customer is $45, that product does not make money on order one and never will unless people buy again.
- Green light: contribution margin above 45% and first-order contribution comfortably above your target CAC. You can advertise it profitably from day one.
- Conditional: contribution between 35% and 45%. It only works if it is a repeat-purchase product or a hero item that pulls a bigger basket. Model the second order before committing.
- Red light: contribution under 35% on a one-off purchase. You are buying revenue, not profit. Renegotiate the cost, raise the price, or drop the idea.
If the numbers land in the conditional band, your first move is not a price rise. It is a cost conversation. Minimum order quantity, payment terms, and freight mode are all negotiable on a first order more often than founders assume, and a 10% cost reduction on a $22 landed unit adds more than $2 straight to contribution. Work through the levers in the supplier negotiation playbook before you accept the quote as final. A full contribution margin audit across your existing range will also tell you what “good” actually looks like in your business, rather than a benchmark borrowed from someone else’s.
What to Do When the Data Says No
A no is the outcome you paid for. Spending $600 on a micro-test to avoid a $15,000 inventory mistake is the highest return on investment in the whole business, and it is the part founders quietly refuse to bank because saying no feels like failure.
Before you scrap the idea, separate the three things that can actually be wrong. The demand can be wrong, the offer can be wrong, or the traffic can be wrong. They look identical on a dashboard and they need completely different responses.
- Traffic problem. Under 1.5% add to cart with a bounce rate above 75% and average time on page under 20 seconds. The wrong people arrived. Re-run the test on a tighter audience or a different keyword before you conclude anything about the product.
- Offer problem. Healthy engagement (60+ seconds on page, people scrolling past the fold, 8-12% add to cart) but almost no completed pre-orders. They want it. They do not want it at that price, with that shipping estimate, or with that little proof. Change one variable and re-test.
- Demand problem. Good traffic, good page, and still under 4% add to cart across 300-plus qualified visitors. That is the real no. Stop.
Give yourself exactly one re-test, and write down the change and the threshold before you run it. Two variables at once and you learn nothing. Founders who allow themselves unlimited re-tests are not validating, they are negotiating with the data until it agrees with them.
If it is a genuine no, harvest the asset. You have a warmed audience, a keyword set that pulls traffic, and a list of people who clicked but did not buy. Email that segment and ask the one useful question: what stopped you? A 300-person segment will typically return 15-40 replies, and those replies routinely point at the adjacent product that actually sells. Cheaper research does not exist.
One more discipline worth building now. Every product you say no to protects the range you already have, because a bloated catalogue costs you far more than the dud SKU itself in stock capital, photography, support load, and attention. If your range has already crept past what you can merchandise properly, run a SKU rationalisation audit before you add anything else to it.
The Product Validation Checklist: Your 8-Point Go/No-Go Framework
Before placing your first stock order, run through each item. If you can tick all eight, you’re buying with confidence rather than hope.
- Google Trends check. Search trend is flat or rising over the past 12 months in Australia. No significant downward slope visible.
- Seasonal planning done. You understand the demand cycle and have mapped cash flow around the peak and off-peak periods.
- Community research complete. At least three recurring pain points identified in customer forums, Reddit threads, or Facebook groups. You can describe the problem in the customer’s exact words.
- Competitor analysis done. You can name three direct competitors, estimate their monthly sales, and articulate one clear point of difference for your product.
- Market size confirmed. The category has proven demand without complete domination. BSR data supports the presence of multiple brands doing meaningful volume.
- Micro-test run. At least 300 unique visitors driven to a product page or pre-order landing page over a minimum 10-day window.
- Conversion threshold met. Pre-order or add-to-cart rate meets your green-light threshold (above 8% for pre-order, or above 15% ATC with strong checkout completion).
- Go/no-go decision made on data. You have written down the result, the cost per acquisition, and why you’re proceeding or pivoting. Your excitement level is not part of the calculation.
The founders who skip this list are the ones running clearance sales six months later. The ones who follow it are the ones buying more stock, not less, because they already know it sells.
Inside eCommerce Circle, Prospects is one of the core 10 P’s we work through with every member. If you’re evaluating your next product move and want a second set of eyes on your research, let’s talk.