Open your Klaviyo account, your Meta ads manager and your Shopify customer report side by side. Add up the numbers. Thirty eight thousand email subscribers. Ten thousand SMS subscribers. Sixty thousand website visitors in your custom audiences. A customer list of thirty eight thousand. It looks like a marketing machine with a reach of nearly a hundred and fifty thousand people.
What’s in This Article
It is not. It is closer to seventy thousand, and about twenty eight thousand of those have never given you a dollar. The rest are the same humans, counted four or five times, being served the same offer across four or five channels while you pay for the privilege every single time.
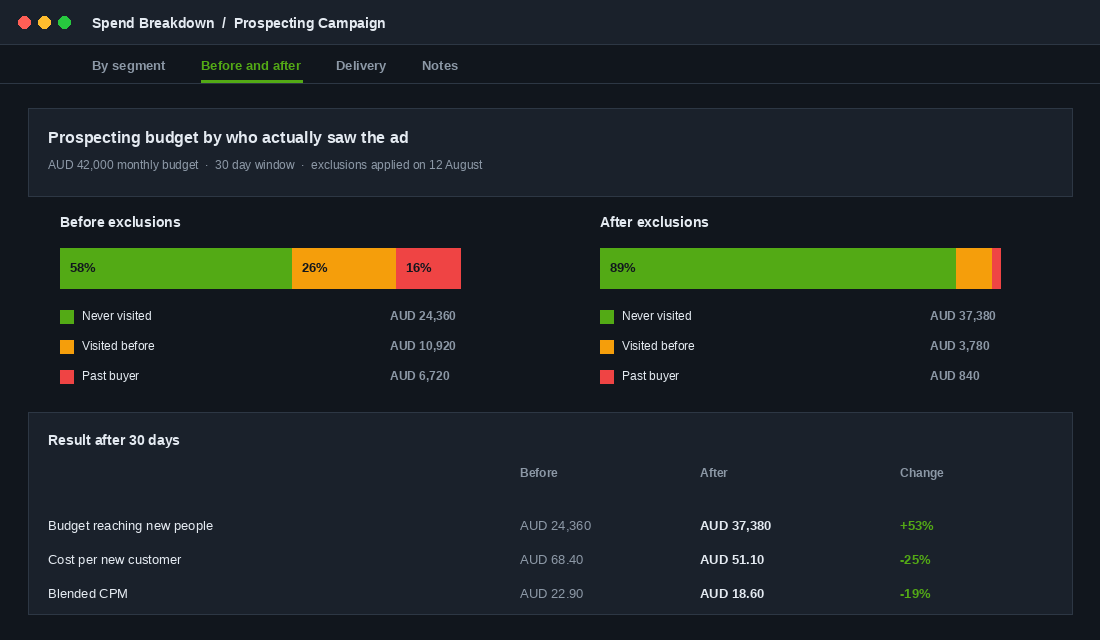
This is the most expensive blind spot in Australian ecommerce right now, and it is getting worse. When prospecting campaigns run without proper exclusions, 30 to 40% of the spend lands on people who have already visited your site or already bought from you. At a modest 40,000 dollars a month on Meta, that is roughly fifteen thousand dollars a month going to people your email list already owns for free. Most operators never see it because no dashboard in their stack is built to count people instead of records.
The fix is an audit, not a new tool. Here is how to run it.
Why Your Channel Numbers Add Up to a Lie
Every platform in your stack reports on records, not humans. Klaviyo counts profiles. Meta counts matched identities. Shopify counts customer accounts. Google counts cookies and signed-in users. None of them talks to the others, and none of them has any incentive to tell you that the person it just charged you to reach is already sitting in three other databases you own.
The Australian market makes this worse than almost anywhere else. 96% of Australians now shop online, and roughly 9.8 million households, about 82% of the country, bought something online last year. Australians spent 82.6 billion dollars online in 2025, up 14% year on year, with 24% of all retail spend now happening online. We are a small, highly saturated, highly connected market. If you sell activewear in Australia, the pool of people who have already touched your brand overlaps enormously with the pool of people you are paying to introduce yourself to.
Overlap is not just wasted reach. It is an auction problem. When your prospecting ad set and your retargeting ad set both bid on the same person, Meta sees two bidders and prices the impression accordingly. You are bidding against yourself. In accounts spending between thirty and two hundred thousand a month, unchecked overlap commonly adds 15 to 30% to blended CPMs. Anything above 20 to 30% overlap between two audiences starts causing real auction damage.
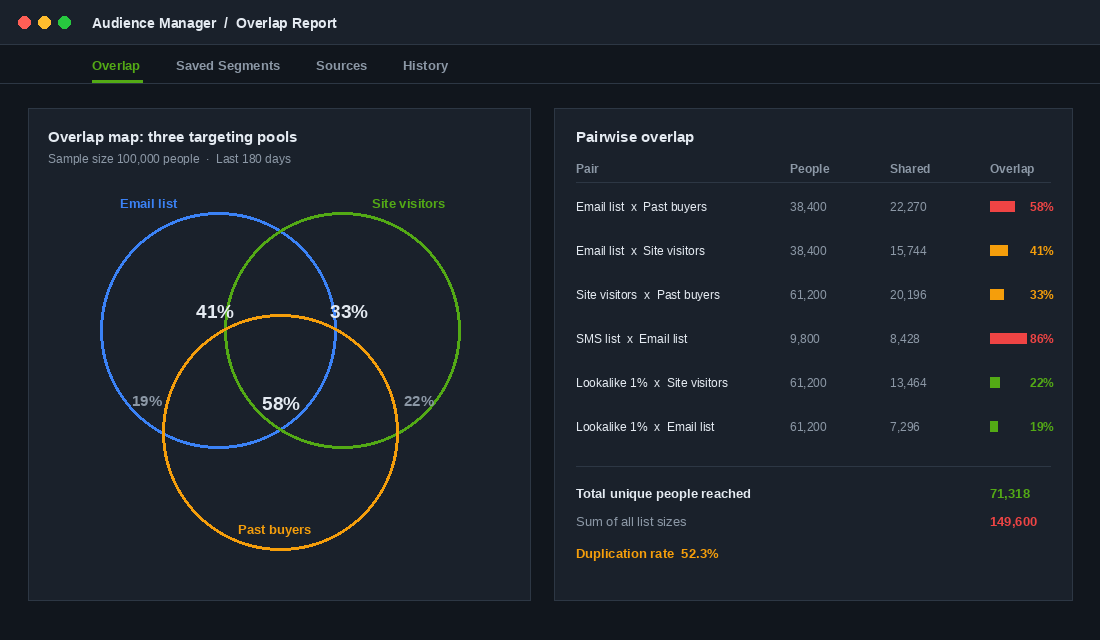
Look at the SMS row in that report. An 86% overlap with the email list is completely normal, because almost everyone who gives you a phone number gave you an email address first. That is not a failure. It becomes a failure the moment you treat SMS as incremental reach in your planning, budget for it as a new audience, and send the same promotion to the same person twice in an afternoon.
Step 1: Build One Master File of Real Humans
You cannot measure overlap until you have a single list where one person appears once. This takes about ninety minutes and a spreadsheet. You do not need a customer data platform for it.
- Export your Shopify customers. Customers, then Export, all customers, CSV. You want email, phone, orders count, total spent, last order date.
- Export your Klaviyo profiles. Build one segment with the condition “email marketing consent equals subscribed” and a second with “SMS consent equals subscribed”. Export both with email and phone number columns.
- Pull your Meta customer list audiences. You cannot export the matched file, but you can record the size and match rate of every customer list audience you have uploaded, plus the date it was last refreshed. Anything older than ninety days is stale and should be flagged.
- Normalise the join keys. Lowercase every email. Strip spaces. Convert Australian mobiles to a single format, either 04 or +614, and keep it consistent. Most duplication in these audits is fake duplication caused by inconsistent phone formatting.
- Deduplicate on email first, phone second. Match on email address. For rows with no email, match on phone. Whatever is left is a genuinely separate person.
Now add one column that changes everything: lifetime orders. Zero, one, or two plus. This single field splits your file into the three groups that should never be treated the same way, and it is the backbone of any serious customer segmentation approach.
Step 2: Run the Overlap Report Inside Meta
Meta gives you a free overlap tool and almost nobody opens it. It takes four minutes.
- Open Ads Manager, click All Tools, then Audiences under the Assets column.
- Tick the checkbox next to two to five audiences. Start with your email customer list, your 180 day site visitors, your purchasers, and your top lookalike.
- Click the three dot Actions menu and choose Show Audience Overlap.
- Meta returns a Venn diagram and a percentage for each pair. Screenshot it and paste it into your audit sheet.
- Repeat for every combination you actively target. Anything over 30% goes on the fix list.
One caveat worth knowing. The overlap tool shows the smaller audience as a percentage of itself, not of the larger one, so a 58% figure means 58% of the smaller pool is contained inside the bigger pool. Read the direction carefully before you go rewriting your campaign structure.
Then do the same exercise for email and SMS. In Klaviyo, build a segment with the conditions “is in list Email Subscribers” AND “is in list SMS Subscribers”. The count that comes back is your true cross channel duplication. Most Aussie brands running both channels land somewhere between 70 and 90%.
Step 3: Work Out Your True Unduplicated Reach
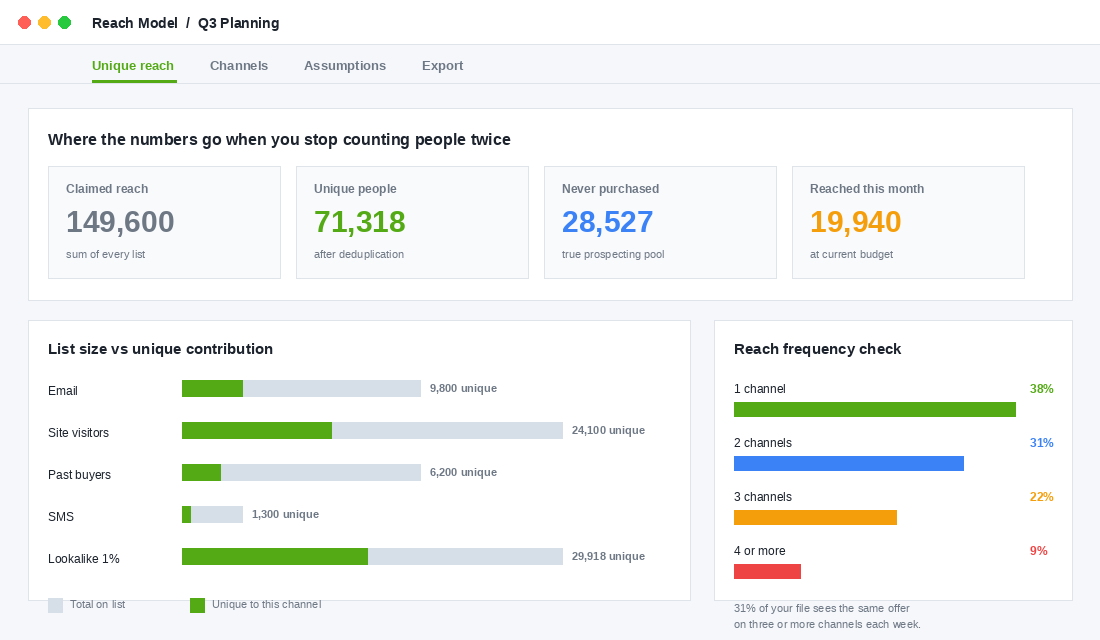
Four numbers come out of the audit. Write them on a whiteboard and leave them there for a quarter.
- Claimed reach. The sum of every list, every audience, every subscriber count. This is the number in your board deck. It is fiction.
- Unique people. The deduplicated master file. This is your real owned audience.
- Never purchased. The subset with zero lifetime orders. This is the only pool where acquisition spend belongs.
- Reached this month. How many of those unique people actually saw something from you in the last thirty days, across any channel.
The gap between the first and the second number tells you how badly your planning has been inflated. The gap between the second and the fourth tells you how much of your own audience you are leaving completely untouched while you buy strangers on Meta. In most audits I run, the second gap is the more shocking one. Brands are paying to reach cold traffic while twenty thousand people who gave them an email address eighteen months ago have not heard a word since.
There is a frequency question sitting underneath this too. If 31% of your file is being hit on three or more channels in the same week, you do not have a reach problem. You have a fatigue problem dressed up as a coverage strategy.
Step 4: Decide Who Owns Each Person
This is where the audit turns into money. Every person in your file should be owned by exactly one channel at any given moment, and every other channel should be excluding them.
- Never purchased, not on your list. Owned by paid prospecting. This is the only group your acquisition budget should be chasing.
- Never purchased, on your email list. Owned by email. Your welcome and browse abandonment flows already reach this person for close to nothing. Exclude them from prospecting.
- Bought once, last 90 days. Owned by lifecycle email and SMS. Your post purchase sequence is doing the work. Paid retargeting here is almost always duplicated spend.
- Bought two or more times. Owned by retention. Loyalty, replenishment, VIP treatment. Exclude from everything paid unless you are running a deliberate winback.
- Lapsed beyond your repurchase cycle. Owned by paid winback, and only then. This is the one case where paying to reach a past customer earns its keep.
The exclusions themselves take about twenty minutes. In every prospecting ad set, add your customer list, your 180 day site visitors and your purchasers as exclusions. Refresh the uploaded customer list weekly, not quarterly, because a stale exclusion list is the same as no exclusion list. If you are on Meta’s Customer Lifecycle Strategy, which rolled out in early 2026, you can tell the platform directly to spend only on people who have never purchased.
Expect the first fortnight to look worse. When you cut off the easy conversions, CPA typically climbs 15 to 30% while the algorithm learns to find genuinely cold buyers, starts recovering in weeks three and four, and settles into a predictable range from week five. If your media buyer panics in week two and switches the exclusions off, you have paid the learning cost and thrown away the return. Hold the line.
Step 5: Rebuild a Prospecting Pool That Is Actually Cold
Once the exclusions are clean, you will find your addressable prospecting pool is smaller than you assumed. Good. Now you can go and build a real one instead of recycling the same twenty thousand people.
- Feed lookalikes from value, not from volume. A 1% lookalike built from your top decile of customers by lifetime value will overlap far less with your existing file than one built from all purchasers, and it will find better people.
- Buy attention where you have none. If your entire acquisition budget sits on Meta and Google, every new dollar is fishing in a pond you have already emptied. Newsletter sponsorships, creator partnerships, podcasts, and retail media all reach people your pixel has never seen.
- Use category entry points. People searching “gift for a new dad” have zero brand awareness and no presence in any of your audiences. Content and search that targets the moment rather than the brand is genuinely incremental reach.
- Collect data you do not already have. Quizzes, preference centres and surveys turn anonymous traffic into identified prospects, which is exactly the kind of zero party data that makes future targeting cheaper.
Business model changes the maths here more than most operators realise. Take Who Gives A Crap, the Melbourne based subscription brand. A meaningful share of their customer file is on an active subscription, which means the subscription itself is the retention channel. Any paid impression served to that person is competing with a relationship the brand already owns outright. Compare that with July, the Melbourne luggage brand, where the repurchase cycle is measured in years. Retargeting somebody who bought a suitcase sixty days ago is not retention. It is a donation. Koala sits in the same shape, high consideration and low frequency, where the entire value of the audience file is in the people who have not bought yet.
The lesson is the same in all three cases. Your repurchase cycle should set your exclusion windows. If people buy from you every six weeks, a thirty day purchaser exclusion is sensible. If they buy every three years, ninety days is nowhere near long enough.
Three Mistakes That Undo the Whole Audit
I have watched brands run this audit properly, find the waste, fix the exclusions, and then quietly give the savings back within a quarter. It happens the same three ways every time.
- Letting the exclusion list go stale. A customer list uploaded in March is worthless by June, because every person who bought between those dates is invisible to it. Put a weekly recurring task on someone’s calendar to re-upload. If your team will not do it manually, a Klaviyo to Meta audience sync will keep it current automatically.
- Excluding on the wrong window. Copying a thirty day purchaser exclusion from a case study written by a supplements brand, when you sell furniture, guarantees you will keep paying to reach people who are years away from buying again. Set the window from your own median time between orders, which you can pull straight out of a Shopify cohort report.
- Judging the change on last click. Removing existing customers from prospecting will make your platform reported ROAS look worse, because you have taken away the easiest conversions in the account. If you evaluate the change on the same dashboard that told you the old setup was working, you will reverse it. Judge it on new customers acquired and blended cost per new customer instead.
There is a fourth, quieter mistake: treating the audit as a one off project. Your file changes every day. A brand adding two thousand customers a month will have a materially different overlap profile in ninety days. Quarterly is the right cadence, and it should sit in your operating rhythm next to your stocktake and your budget review, not in a document nobody opens again.
The Six Line Overlap Audit Worksheet
Copy this into a sheet and fill it in once a quarter. Six lines, thirty minutes, and it will do more for your acquisition efficiency than the next creative test.
- Claimed reach. Add every list, audience and subscriber count together. Record the number and be honest about how often you quote it.
- Unique people. Deduplicate on email then phone. Record the count and the duplication rate as a percentage.
- Never purchased. Filter to zero lifetime orders. This is your addressable acquisition pool.
- Worst overlap pair. From the Meta overlap tool, record the two audiences with the highest overlap and the percentage.
- Prospecting spend hitting known people. Break your prospecting campaign delivery down by new versus returning and record the share and the dollar value.
- Exclusion freshness. Record the date your customer list audience was last uploaded. If it is more than seven days old, that is your first job tomorrow.
Track those six numbers across four quarters and you will have something almost no brand your size has: a defensible view of how many actual humans your marketing touches, and what each new one costs.
What Changes When Your Reach Numbers Are Honest
The individual fixes are small. Refresh a customer list. Add three exclusions. Change a lookalike source. None of them feels like a growth lever on its own. Together they change the shape of the whole business.
Your cost per new customer becomes real, because the denominator stops being polluted by people who were going to buy anyway. Your channel reporting stops double counting, so email revenue and SMS revenue and paid revenue stop adding up to more than your actual sales. Your CPMs drop because you are no longer bidding against yourself in the auction. And the case for paid media gets stronger rather than weaker, because the research is clear that Meta does drive genuine new customer growth when it is pointed at new customers. One analysis across more than ten thousand campaigns found 64% of Meta’s incremental conversions came from new to brand buyers. That only holds if you actually let it chase new people.
Most importantly, the audit forces a decision most brands avoid. When you can see that your real owned audience is seventy thousand people and only twenty eight thousand have never bought, you have to choose. Spend to acquire more people, or spend to get more out of the ones you have. Both are valid strategies. Guessing is not, and neither is pretending you have a hundred and fifty thousand people when you have half that. If you want to go further on proving which spend is genuinely creating sales rather than claiming them, the incrementality testing approach is the natural next step.
Run the audit this week. Ninety minutes with a spreadsheet, four minutes in the Meta overlap tool, twenty minutes adding exclusions. Then go and look at what your prospecting budget does when it is only allowed to talk to people who have never heard of you.
Inside eCommerce Circle, knowing exactly who you are reaching and what each new customer costs is one of the core pillars we work on with every member. If you want a second opinion on yours, let’s talk.