You have Google Analytics installed. You might even check it occasionally. But if you are like most Shopify store owners, you open GA4, stare at the dashboard for two minutes, feel overwhelmed by the data, and close the tab without making a single decision. Sound familiar?
What’s in This Article
The problem is not the tool — it is knowing what to look at and what to do with what you find. A proper analytics deep dive once a month can reveal exactly where your store is leaking money and where the biggest growth opportunities are hiding. Here is the framework for turning data into decisions.
The Monthly Analytics Review: What to Check and Why
Block 90 minutes on the first Monday of each month for your analytics review. This is not a casual glance — it is a structured analysis that reveals patterns you would never see day-to-day. Here is the order of operations:
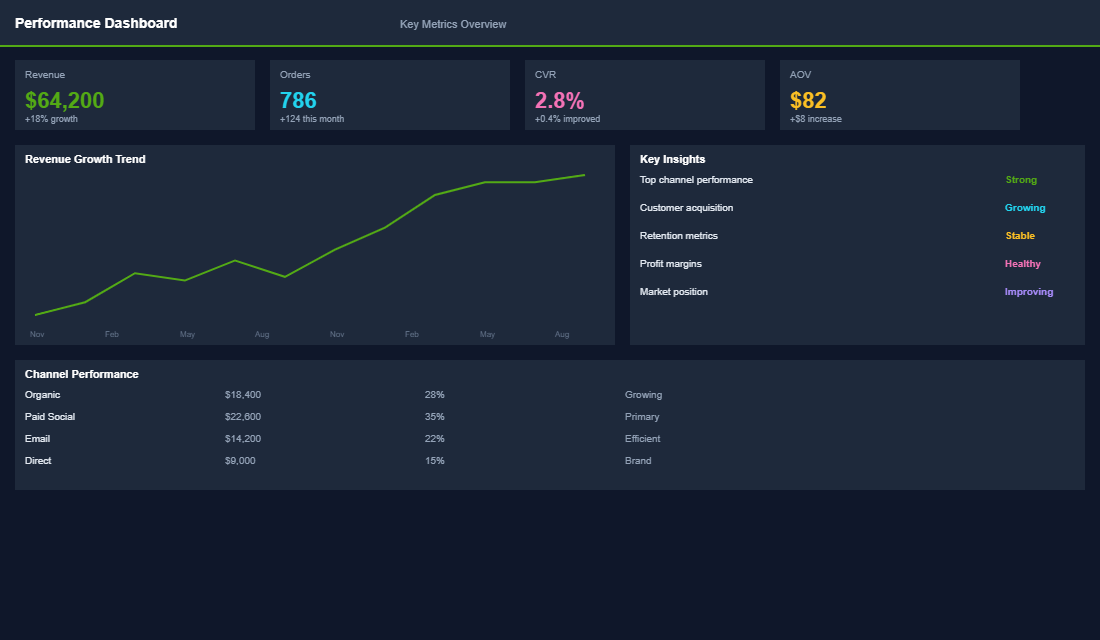
Start with the revenue overview. Compare this month to last month and to the same month last year. Look at total revenue, number of orders, average order value, and conversion rate. If any of these have changed by more than 10%, you need to understand why before looking at anything else.
Check your traffic sources. In GA4, go to Acquisition, then Traffic Acquisition. Sort by revenue. Which channels are driving the most revenue? Which have the highest conversion rate? Which have the lowest cost per acquisition? The answer to these three questions should drive 80% of your marketing budget decisions.
Analyse the purchase funnel. Look at the drop-off between each stage: product view to add-to-cart (should be 8-12%), add-to-cart to checkout (should be 40-60%), checkout to purchase (should be 55-75%). If any stage is below these benchmarks, that is where your biggest conversion opportunity lives.
The Five Reports That Actually Matter
GA4 has hundreds of reports. You need five. Here they are, in order of importance:
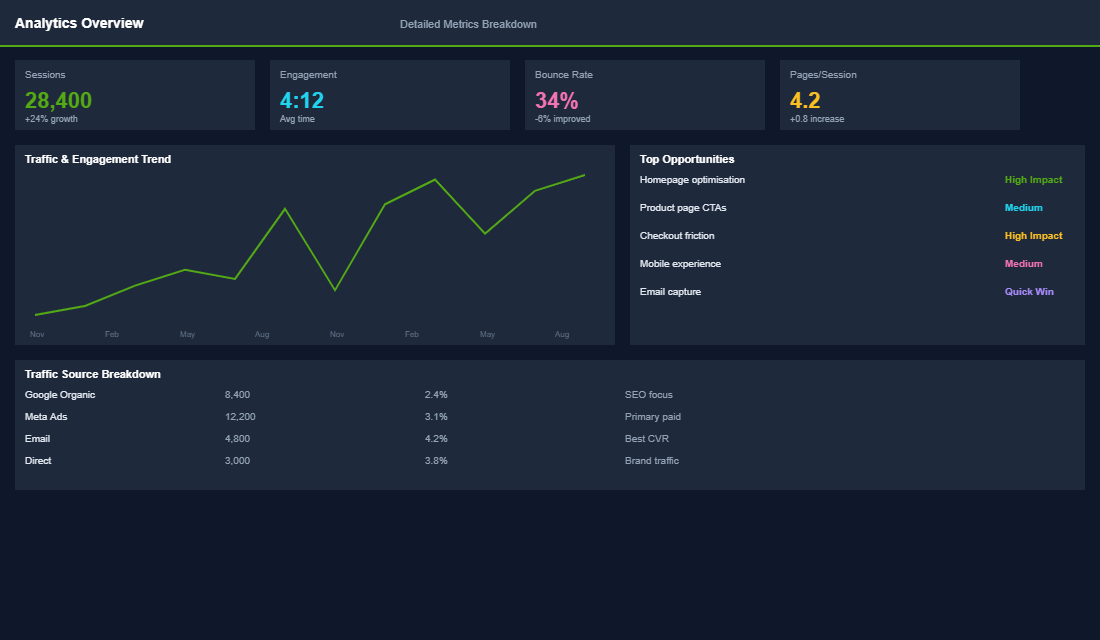
- Landing Page Performance. Go to Engagement, then Landing Page. Sort by sessions, then check conversion rate for each page. Your top 10 landing pages probably account for 70% of your traffic. If any of those have a below-average conversion rate, fixing them will have an outsized impact on revenue. Look for pages with high traffic but low conversion — these are your biggest opportunities.
- Product Performance. Use the Ecommerce Purchases report to see which products are viewed most, added to cart most, and purchased most. Calculate the view-to-purchase rate for your top 20 products. Products with high views but low purchases have a product page problem. Products with high add-to-cart but low purchase have a checkout or pricing problem.
- Device Performance. Compare conversion rates between mobile, desktop, and tablet. If mobile traffic is 70% of your total but converts at half the rate of desktop, your mobile experience needs urgent attention. Most Shopify stores have a 40-60% conversion rate gap between mobile and desktop.
- New vs Returning Visitors. In GA4, create a comparison segment for new vs returning users. Returning visitors should convert at 2-3x the rate of new visitors. If the gap is wider, your remarketing and retention strategy needs work. If the gap is narrower, your acquisition channels might be too narrowly targeted.
- Geographic Performance. Check which states or countries your traffic and revenue come from. Australian stores often find that Sydney and Melbourne drive 60-70% of revenue but only 45-50% of traffic — meaning other regions have untapped potential. This data also informs your shipping strategy and ad targeting.
Reading the Funnel: Where Money Goes to Die
Your purchase funnel tells a story. Every drop-off between stages represents lost revenue. Here is how to read it and what to fix at each stage:
Low product view to add-to-cart (below 8%). Your product pages are not convincing visitors to buy. Common causes: poor product photography, weak product descriptions, missing social proof (reviews), confusing size/variant selection, or prices that feel too high without enough perceived value. Fix the product page experience.
Low add-to-cart to checkout (below 40%). People want your product but something stops them before checkout. Common causes: high shipping costs revealed in the cart, no trust signals (security badges, guarantees), missing payment options, or unexpected costs. Adding a free shipping threshold, trust badges, and buy-now-pay-later options typically recovers 15-25% of this drop-off.
Low checkout to purchase (below 55%). Customers are in your checkout but abandoning before completing payment. Common causes: too many form fields, no guest checkout option, limited payment methods, slow page load during checkout, or error messages. Simplify the checkout, enable Shop Pay and Apple Pay, and ensure the checkout loads in under 2 seconds.
Custom Dashboards: Building Your Command Centre
GA4 Explorations let you build custom reports that answer your specific business questions. Here are three explorations every Shopify store should create:
Revenue by Traffic Source (Weekly Trend). Create a line chart showing revenue by source/medium over the last 12 weeks. This reveals trends that monthly totals hide — like a gradual decline in organic revenue that gets masked by a simultaneous increase in paid.
Product Funnel by Category. Build a funnel exploration filtered by product category. This shows whether your conversion issues are store-wide or category-specific. Often, one category converts beautifully while another bleeds visitors — and the category-level data tells you exactly where to focus.
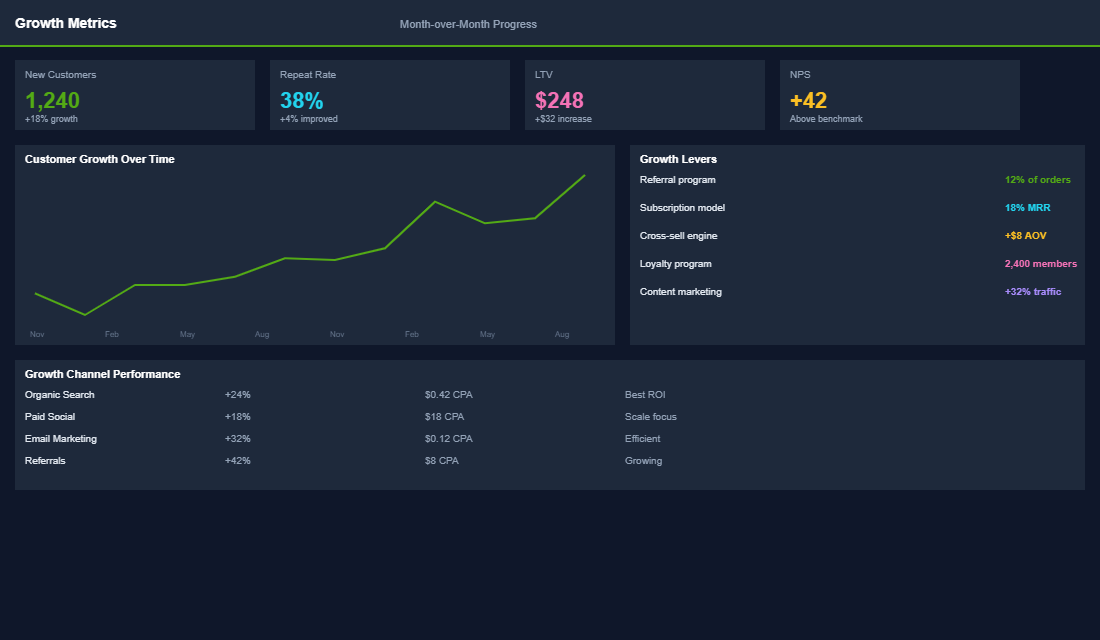
Customer Lifetime Value Cohort. Use the cohort exploration to see how much revenue customers generate in their first 30, 60, and 90 days after first purchase. This reveals whether your retention marketing is working and how quickly customers come back to buy again.
From Data to Decisions: The Action Framework
Data without action is just noise. After every monthly review, document three things:
- One thing that is working (double down). Identify the channel, product, or page that is performing above average and invest more. If Google organic is converting at 4.2% while your average is 2.8%, invest in SEO for the products ranking well.
- One thing that is broken (fix it). Find the biggest drop-off or underperformance and prioritise fixing it this month. If mobile conversion is 1.1% vs desktop at 3.4%, your mobile experience is the bottleneck.
- One thing to test (experiment). Based on your data, design one experiment to run this month. If add-to-cart rate is low, test new product page layouts. If cart abandonment is high, test adding trust signals or changing your shipping threshold.
Keep a running log of these three items each month. After six months, you will have a clear record of what moved the needle and what did not — which is worth more than any amount of raw data.
The 5 Analytics Mistakes That Quietly Drain Revenue
Knowing which reports to check is only half the battle. Most Shopify store owners make the same analytics mistakes — and each one costs real money. Here are the five we see most often when working with eCommerce Circle members.
1. Looking at averages instead of segments. Your store-wide conversion rate is 2.1%? That number is nearly useless on its own. Break it down. Mobile might be 1.4% and desktop 3.2%. Returning visitors might convert at 4.5% while new visitors sit at 1.1%. When you look at averages, the strong segments mask the weak ones. Segment every metric by device, traffic source, customer type, and geography. The problems — and opportunities — are always hiding in the segments.
2. Obsessing over traffic volume instead of traffic quality. More traffic is not always better. A store doing 50,000 visits per month with a 1% conversion rate generates the same revenue as one doing 25,000 visits at 2%. But the second store is spending half the ad budget. If your GA4 reports show sessions climbing but revenue is flat, you have a traffic quality problem, not a traffic volume problem. Tighten your targeting before scaling spend.
3. Ignoring the “Add to Cart” to “Purchase” drop-off. Most stores track visits and purchases but completely ignore the middle of the funnel. On average, 69.8% of Shopify carts are abandoned before checkout. But the reasons vary wildly — unexpected shipping costs (48% of cases), forced account creation (24%), complicated checkout (18%), or lack of trust signals (17%). Your analytics will show you where the drop-off is worst. Checkout optimisation starts with knowing exactly where buyers are leaving.
4. Checking analytics without a comparison period. A $12,000 revenue day means nothing without context. Was it up or down from the same day last week? Last month? Last year? Always use comparison periods in GA4 — ideally comparing against the same day of the week from the prior period. Seasonality, day-of-week effects, and promotional calendars all create noise that makes single-period data misleading. The trend matters more than the number.
5. Collecting data without acting on it. This is the biggest mistake of all. Your monthly analytics review should produce exactly three action items — no more, no less. Three is enough to move the needle, few enough to actually execute. If you review your data and do not change a single thing in your store, ads, or email flows within the following week, the review was wasted time. Data without action is just expensive entertainment.
The Compound Effect of Data-Driven Decisions
Stores that run monthly analytics reviews and take action on the findings consistently outperform stores that rely on gut feel. The advantage compounds because each improvement builds on the last — fix mobile conversion in month one, optimise your top landing page in month two, improve checkout in month three, and by month six your store is converting at twice its original rate.
One eCommerce Circle member started monthly analytics reviews and discovered that their second-highest traffic landing page had a 0.9% conversion rate (vs. 2.8% store average). A product page redesign lifted that page to 2.4% conversion — which translated to an extra $6,200 per month in revenue from existing traffic. No extra ad spend required.
The data is already there. You are already paying for the traffic. The only question is whether you are looking at the numbers and making smart decisions based on what they tell you.
Start Your First Proper Analytics Review
This month, block 90 minutes on your calendar. Open GA4, work through the five reports above, analyse your purchase funnel, and document your three action items. That single session will give you more clarity on your business than months of casual dashboard glances.
Inside the eCommerce Circle, analytics and data-driven decision making is the backbone of our Performance framework. We walk members through monthly analytics reviews, help interpret the numbers, and ensure every insight leads to a concrete action that grows revenue.
Your analytics are not just numbers on a screen — they are a roadmap showing you exactly where the money is. The stores that treat data as a weekly habit instead of an occasional glance consistently outperform those that fly blind.
If you want a structured analytics framework tailored to your store’s specific metrics and growth goals, let’s talk.