Here is a number that should scare you: the average Shopify store owner overestimates their profit margin by 22%. They look at their revenue, subtract what they paid for the product, and call the rest “profit.” Meanwhile, their bank balance tells a completely different story.
What’s in This Article
If you have ever had a month where you did $30K in sales but somehow ended up with less cash than you started with, you are not alone. And you are not bad at business – you are just measuring the wrong things.
The difference between Shopify stores that scale to $50K+ months and ones that plateau at $15K usually comes down to one thing: the owner who scales actually understands their real margins. Not the fantasy margins on a spreadsheet, but the cold hard numbers after every single cost is accounted for.
The “I Buy It for , Sell It for ” Delusion
This is the most dangerous sentence in ecommerce. It sounds like a 70% margin, and on paper it is. But paper margins do not pay rent. Here is what actually happens to that $50 sale for a typical Australian Shopify store:
- Product cost: $15.00 (what you think your total cost is)
- International shipping to AU: $3.20 (often forgotten until the freight invoice arrives)
- Customs duty + GST on import: $2.85 (yes, you pay GST on the landed value)
- Domestic shipping: $9.80 (Australia Post is not cheap, and customers expect fast delivery)
- Shopify + payment processing: $2.45 (2.9% + 30c adds up fast)
- Packaging and inserts: $1.80 (branded packaging costs more than you think)
- Returns reserve (7%): $3.50 (because returns happen whether you budget for them or not)
- Customer acquisition (Meta Ads): $15.00 (at a 3.3x ROAS, which is actually decent)
Total real cost: $53.60. On a $50 sale. You just lost $3.60 per order while thinking you were making $35. This is not an extreme example – this is the reality for brands that have not done proper margin analysis.
The Three Numbers You Must Know Cold
Forget vanity metrics. There are three numbers that determine whether your Shopify store is actually a business or an expensive hobby:
- Gross Margin (after COGS + shipping). This should be 65-75% for a product-based DTC brand. Below 60% and you will struggle to acquire customers profitably through paid channels.
- Contribution Margin (after variable costs including ads). This is your real margin per order. Target 15-25%. Below 15% means you need either higher prices, better AOV, or lower acquisition costs.
- Net Margin (after everything including fixed costs). For a healthy Shopify business doing $30-80K/month, aim for 12-20% net margin. Below 10% means you are working too hard for too little.
If you do not know these three numbers for your store right now, stop reading and go calculate them. Everything else in this article – and frankly, everything else in your business – depends on getting these right.
The Contribution Margin Audit: A Step-by-Step Walkthrough
Knowing the theory is one thing. Calculating your actual contribution margin is another. Here is a worked example so you can do this for your own products right now.
Say you sell a premium Australian skincare bundle. Your selling price is $89 AUD. Here is what you actually pay: product cost (ingredients, packaging, labels) $18. Shopify fees (payment processing, transaction fees) $4.90. Shipping to customer $6.50. Packaging materials (boxes, tissue, tape) $2.10. Returns and refunds (average 3% loss) $2.67.
Total variable costs: $34.17. Your contribution margin: $89 minus $34.17 = $54.83 per unit (61.6%).
That $54.83 has to cover your fixed costs (staff, rent, software subscriptions, marketing) and generate profit. If you are paying $2,500 per month in fixed costs and selling 100 units monthly, you need at least $25 contribution per unit just to break even. You are safe. But if you are only selling 30 units monthly? You are losing money on this product.
Use Google Sheets to set up a simple template. List every product, calculate contribution margin, then track it monthly. For deeper insights, Shopify Reports shows you product profitability if you have configured costs correctly (most stores have not). The BeProfit app automates this entirely – it pulls your costs and calculates margins across your whole store. For a deeper look at how to structure your unit economics, read that guide next.
Cash vs Profit: The Trap That Catches Growing Brands
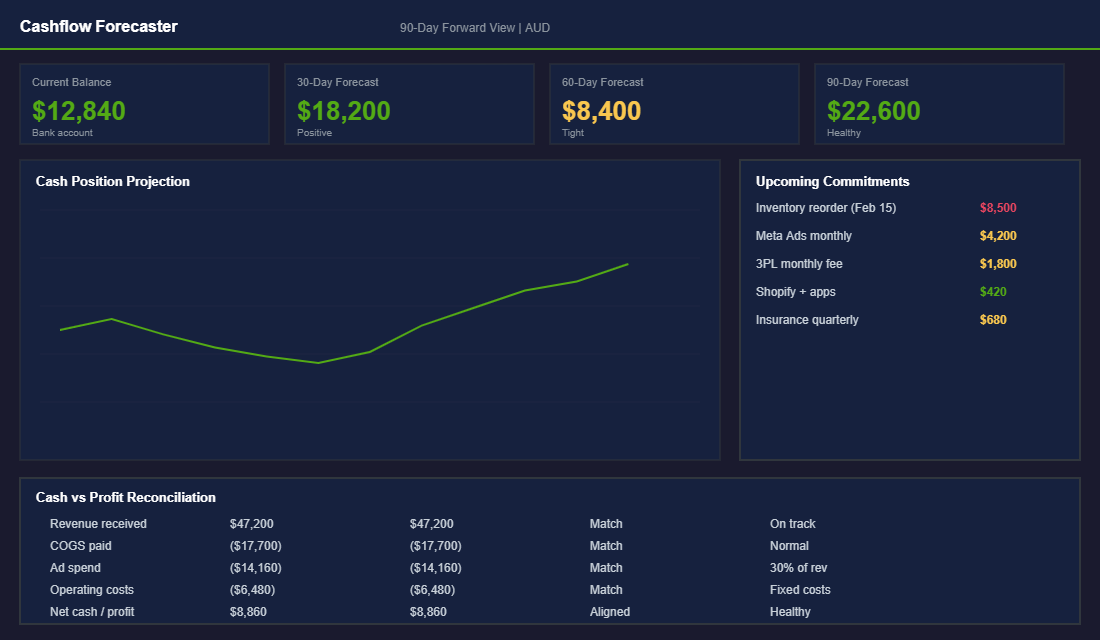
Here is an uncomfortable truth: you can be profitable on paper and completely broke in your bank account. This happens constantly with growing ecommerce brands, and it catches smart people off guard.
The reason is timing. You pay for inventory 60-90 days before you sell it. You pay for ads today but get the revenue over the next 30 days. You pay your 3PL weekly but get paid by Shopify Payments every 2-3 business days. When you are growing fast, these timing gaps multiply and create a cash crunch that can kill a profitable business.
The fix is simple but most founders skip it: build a 90-day forward cashflow model. Not a P&L – a cashflow forecast that shows exactly when money comes in and when it goes out. Tools like Float or even a well-built Google Sheet can do this. The point is to see the cash gaps coming before they arrive, not after your supplier payment bounces.
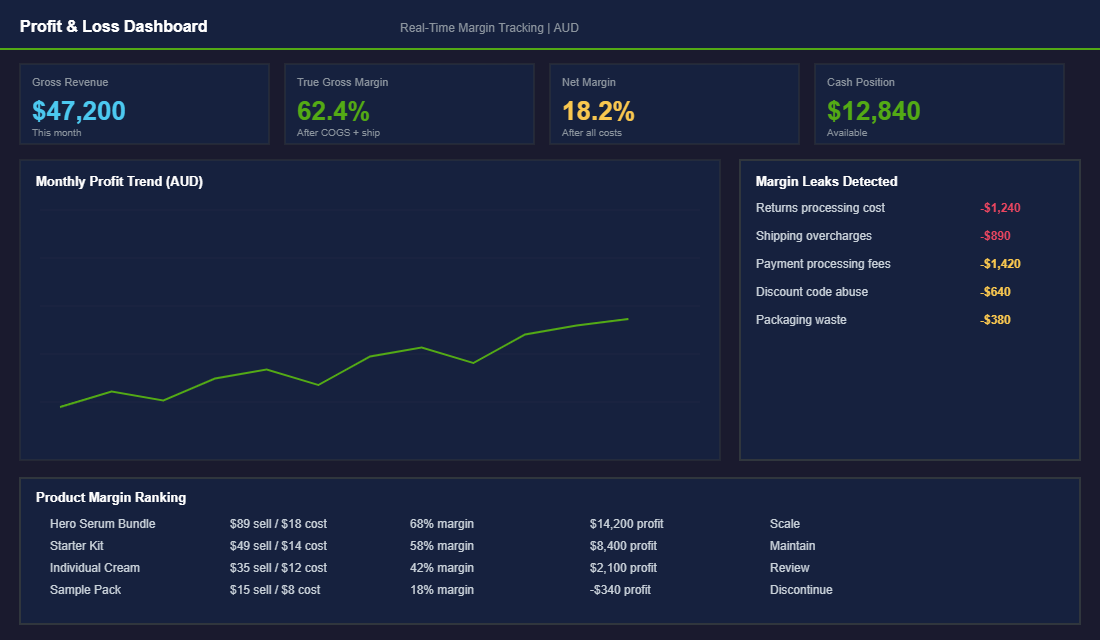
Find and Fix Your Margin Leaks
Every Shopify store has margin leaks – costs that quietly erode your profitability without showing up as obvious line items. Here are the five most common ones we see when auditing eCommerce Circle member stores:
- Shipping overcharges. Most brands set up their shipping rates once and never revisit them. If your average parcel weight has changed, you could be subsidising shipping by $2-4 per order without realising it.
- App bloat. The average Shopify store has 12-15 apps installed. At $20-80/month each, that is $400-1,200/month in subscription costs. Audit quarterly and cut anything that is not directly driving revenue.
- Discount code abuse. If your discount codes are floating around on coupon sites, you are giving away margin to customers who would have paid full price. Use unique, single-use codes tied to specific campaigns.
- Return processing costs. The product comes back, but you also lose the original shipping cost, the return shipping cost, and often the item cannot be resold at full price. Budget 1.5-2x the return rate as your actual cost of returns.
- Creative and content spend. Photography, videography, and design costs that get buried in “marketing” but should be amortised across the products they support.
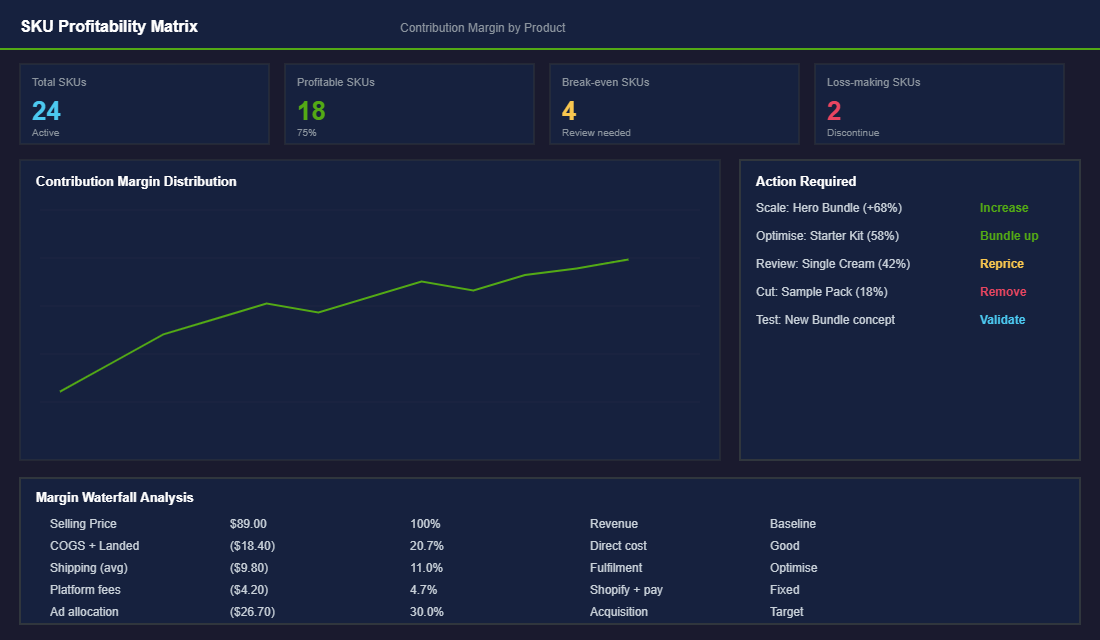
The SKU-Level Profitability Trap
Here is the uncomfortable truth: most Shopify stores have a handful of products carrying the weight of the entire business, while unprofitable SKUs masquerade as winners.
We have audited hundreds of Australian ecommerce stores. The pattern is always the same. The bottom 20% of your SKUs contribute 0% of total profit. Often they are negative – actively losing money. Yet they sit in your inventory, demand marketing spend, and distract your team. Why? Because your average margin of 40% hides individual products with margins of 8% or even negative margins hiding in plain sight.
Do a SKU-level margin audit right now. Export your product list. Calculate contribution margin for each one. Sort from lowest to highest. Then ask: which products in the bottom quartile are draining profit?
Your action: kill, reprice, or bundle the bottom 10-15% of SKUs. When one Australian beauty brand we worked with cut 14 low-margin products, their overall profitability jumped 18% in one quarter – with fewer products to manage. For more on pricing strategy, see our guide on discount strategy that protects your margins.
Set Guardrails That Trigger Action Automatically
The smartest thing you can do for your margins is set up financial guardrails – specific thresholds that trigger automatic action when crossed. This removes emotion from financial decisions and keeps your business healthy even when you are busy with everything else.
- If gross margin drops below 62%: Pause all new inventory orders and audit COGS.
- If contribution margin drops below 15%: Reduce ad spend by 30% and focus on organic and email revenue.
- If cash reserves drop below 6 weeks of operating costs: Halt all non-essential spending and accelerate collections.
- If a SKU contribution margin is below 10% for two consecutive months: Discontinue or reprice.
Write these down. Put them somewhere visible. Review them monthly. The brands that survive and scale are not the ones with the best products – they are the ones with the best financial discipline.
Automating Your Margin Guardrails
You cannot manage what you do not monitor. The best Shopify stores do not rely on monthly reviews – they have set up automated alerts that flag problems before they spiral.
Shopify Flow lets you create conditional automations. Set rules like: “If a product’s contribution margin falls below 45%, pause its ads and notify me.” BeProfit has built-in alerts that email you weekly margin reports showing which products are sliding. Set a margin floor for each product category and let the tools do the watching while you focus on growth. You should never discover margin erosion six months after it started.
The Compound Effect: Margin Discipline Creates Freedom
When your margins are healthy and your cash position is clear, everything changes. You can invest in better creative because you know the numbers support it. You can test new products because you have the cash buffer to absorb a miss. You can scale ads confidently because you know exactly what ROAS you need to stay profitable.
Most importantly, you stop making decisions from a place of fear. The brands that panic-discount, slash ad spend randomly, and chase revenue at any cost are almost always the ones without margin clarity. Fix the numbers, and you fix the decision-making.
The Monthly Margin Review Ritual
Margins do not fix themselves. You need a rhythm. Here is the 30-minute monthly ritual that separates disciplined stores from drifters.
Week 1: The data check (10 minutes). Open your margin report (Shopify Reports, BeProfit, or Google Sheets). Are your variable costs up to date? Have supplier prices changed? Have payment processor fees shifted? Confirm your inputs are current before you trust the outputs.
Week 2: The profit deep dive (10 minutes). Check your top 20 SKUs. Have margins moved? Which products are trending down? Look for the story. Did a supplier price increase hit your highest-volume product? Did your COGS creep up without you noticing? Find the use points.
Week 3: The action phase (10 minutes). Make one decision. Reprice a product, negotiate with a supplier, kill a low-margin SKU, or bundle products smarter. One decision per month compounds. Over 12 months, you are making meaningful structural improvements to profitability.
Build this ritual into your calendar like you would schedule a meeting with your accountant. Because that is what this is – a meeting with your numbers.
The Monthly Margin Scorecard: Five Numbers That Decide If You Keep the Cash
Most owners check revenue daily and true margin almost never. That is backwards. Revenue is vanity. The five numbers below decide whether a $100 order leaves you with $18 or $4, and you want them in front of you on the first Monday of every month.
- True net margin. After COGS, fees, shipping, returns and apps, a healthy Aussie DTC brand keeps 10 to 20% of every sale. Under 10% and one bad ad month wipes you out.
- Payment fees. Shopify Payments in Australia runs roughly 1.7 to 2.2% plus 30c a transaction. On $80k a month that is $1,400 to $1,800 gone before you ship a thing, and worth auditing ahead of the RBA surcharging changes landing in late 2026.
- Return rate. Budget 8 to 12% for most categories and 20 to 30% for apparel. Each return costs the outbound shipping, the return shipping and often the product, so a 25% apparel return rate can quietly halve your margin.
- Shipping subsidy. Free shipping is rarely free. Absorb $9 on a $70 order and that is nearly 13% of the sale. Track it as its own line, not a cost you forget about.
- Discount depth. At a 30% margin, a 10% off code needs about 50% more volume just to break even on profit. Run the maths before the next sale, not after.
Imagine you run a $120k a month skincare brand at what you think is a 25% margin. Plug in real fees (2%), returns (10%), a $7 shipping subsidy and a standing 10% welcome code, and your true margin is closer to 14%. That gap is roughly $13k a month you assumed you had and do not.
You do not need a CFO to see this. Tools like TrueProfit, BeProfit and Lifetimely plug into Shopify and calculate net profit per order automatically, pulling in ad spend, fees and COGS. Set one up, then pressure-test your numbers with the Shopify pricing strategy playbook so the margin on your scorecard is one you actually keep.
Want Help Getting Your Numbers Right?
Inside the eCommerce Circle, Profit is the third pillar of the More Orders Operating System – and it is one of the first things we audit with every new member. If you are unsure whether your margins are real or if you have got hidden leaks eating into your profitability, let’s talk. We have walked hundreds of Australian Shopify brands through this exact margin audit and we would love to do the same for you.