Your P&L looks fine. Revenue is up, gross margin is sitting around 65%, and your accountant is happy. Then you check the bank account and it tells a different story. The cash is not where the numbers suggested it would be.
What’s in This Article
That gap is the most expensive blind spot in Australian ecommerce. Most $1m to $5m Shopify founders run their business off a P&L that hides 20 to 30% of the truth, and by the time the year-end accounts come in, the leaks have already swallowed $30,000 to $100,000 in profit that should have stayed in the business.
The fix is not better bookkeeping. It is a contribution margin audit, run quarterly, that strips revenue down to the actual dollar that lands in your account after every variable cost. We have helped hundreds of Aussie Shopify founders run this exact process inside eCommerce Circle. The first audit almost always finds money. The next four make it permanent.
Why Gross Margin Hides the Truth (CM1, CM2 and CM3)
Gross profit margin is a useful number for talking to your accountant. It is a terrible number for running a Shopify business day to day.
Here is why. Gross margin only accounts for cost of goods sold (COGS). A Shopify store with $75 average order value and $30 in COGS has a gross margin of 60%, which sounds healthy. The catch is that the same order also costs you payment fees, inbound freight, picking and packing, shipping to the customer, returns processing, and the marketing dollars you spent to acquire that customer in the first place. By the time you net those out, the order is contributing closer to $20 than the $45 your gross margin claims.
Operators who scale profitably break contribution margin into three layers. Each one strips out a different category of cost.
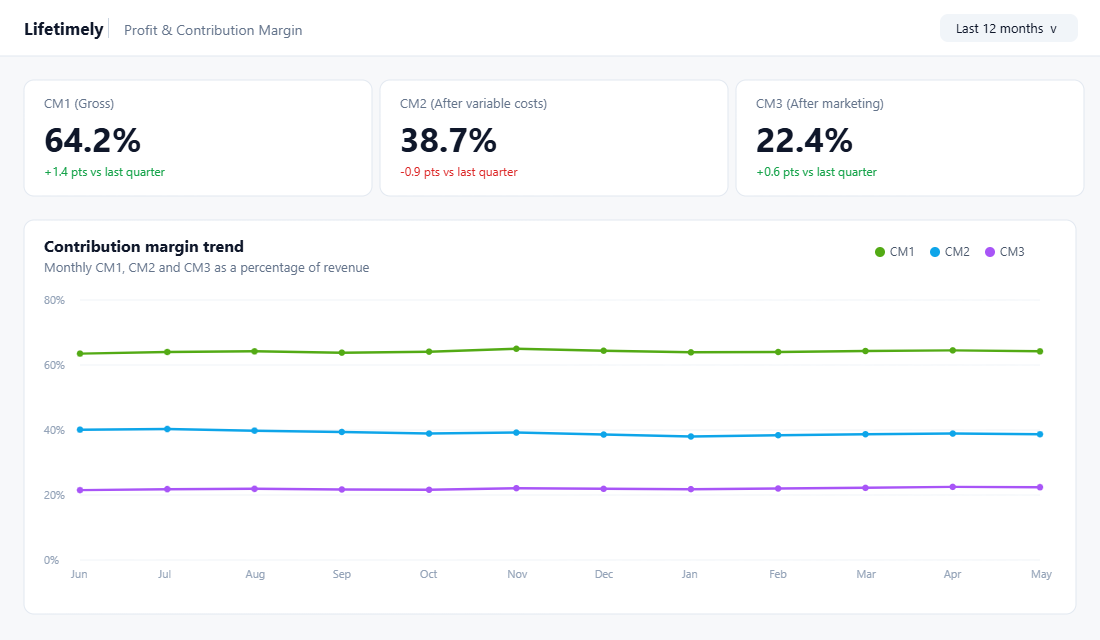
- CM1: Revenue minus COGS. This is your gross profit. Healthy Shopify CM1 sits between 50 and 70%. Beauty and supplements sit at the top end (65 to 85%), apparel at 50 to 65%, food and beverage at 40 to 55%.
- CM2: CM1 minus all order-level variable costs. Shipping, fulfilment, returns, payment fees, packaging. A typical Aussie Shopify store lands between 35 and 50%.
- CM3: CM2 minus marketing spend. This is the dollar that actually pays for your overheads, your salary, and your tax bill. The minimum acceptable benchmark is 20%. Below that, scaling will burn cash.
Most Aussie founders track CM1 (because Shopify shows it) and net profit at year end (because their accountant calculates it). The two numbers in between, CM2 and CM3, are where the entire business lives. Miss them and you cannot tell whether your next 90 days of growth will leave you richer or poorer.
This work sits upstream of almost everything else in our Profit-Per-Visitor framework. PPV is the output. Contribution margin is the input that decides whether PPV is rising or falling.
The 5 Hidden Costs Most Aussie Founders Miss
When we audit a Shopify P&L, the same five categories leak first. Most of these never make it into your Shopify reports, so they hide in plain sight on the bank statement.
- Inbound freight and duty. Shopify shows you the FOB price of the unit, not what it cost to land in Sydney. Add 12 to 18% to true COGS for most imported categories. If you are bringing in container loads from China, add a separate line for customs duty, GST on import, and quarantine fees.
- Returns processing. The full cost of a return (reverse shipping, restocking, customer service time, refurb or write-off) is 3 to 4x what most merchants think. Industry studies put it at $10 to $40 per return depending on category. At scale, returns quietly devour 20 to 30% of profit on apparel and footwear brands.
- Payment processing. Shopify Payments is 1.4 to 1.7% in Australia plus 30c, but if you also have Klarna, Afterpay or PayPal, the blended fee can hit 5 to 6% on a third of your transactions. A buy-now-pay-later mix above 30% will push your blended payment cost over 3%.
- App stack creep. $400 to $1,200 a month is normal for a $1m store. Per order, that is 50c to $2 vanishing into fixed app costs you stopped questioning twelve months ago. Apps you trialled, did not turn off, or duplicate each other.
- CAC drift. Your blended CAC creeps up 5 to 10% per quarter as you scale. Unless you are looking at CAC by channel and cohort, the drift hides inside “marketing spend” on the P&L until it has eaten your margin alive.
Most of these are not surprises individually. They are surprises in aggregate. A 1% slippage on payments, 3% on inbound freight, 2% on returns and 4% on CAC drift is 10 points of CM2 gone. On a $2m store, that is $200,000 a year.
Building the Contribution Margin Audit: The Tool Stack
You can run this on a spreadsheet for the first month, then automate it. Here is the stack we recommend to Aussie founders inside the workshop.
Lifetimely or BeProfit as the calc engine. Both apps pull Shopify orders, COGS, ad spend from Meta, Google and TikTok, and shipping costs into a single contribution margin view. Lifetimely starts at $35/month for stores under $50k MRR. BeProfit is comparable. Either works.
Setup takes a single morning. Here is the exact sequence we walk new members through.
- Install the app from the Shopify App Store. Both have a 14-day trial.
- Connect your ad accounts (Meta Ads Manager, Google Ads, TikTok Ads). The OAuth flow takes 2 minutes per platform.
- Upload your COGS per SKU as a CSV. If you do not have unit costs by SKU yet, use a 60-day weighted average from your supplier invoices. Imperfect is fine. Empty is not.
- Add inbound freight as a percentage uplift on COGS (typically 12 to 18% for imported goods).
- Add fixed costs (apps, software, salaries, rent) in the “Operating costs” section so you can see CM3 and net margin in the same view.
- Set up the daily email digest so contribution margin lands in your inbox at 7am alongside the revenue number.
The first run will be wrong. COGS will be missing on some SKUs, shipping zones will be miscoded, ad spend will be off because one of your campaigns is not connected. Fix the data over the first two weeks, then look at the numbers seriously.
For audit purposes, also export the underlying transactions into a Google Sheet so you can slice by SKU, channel, customer cohort and discount code. The app gives you the headline number. The sheet shows you where the leaks are.
The 4 Leak Patterns You Will See Every Time
Once the audit is running, the same four patterns show up across almost every Aussie store we look at. Print this list and run it as a quarterly review.
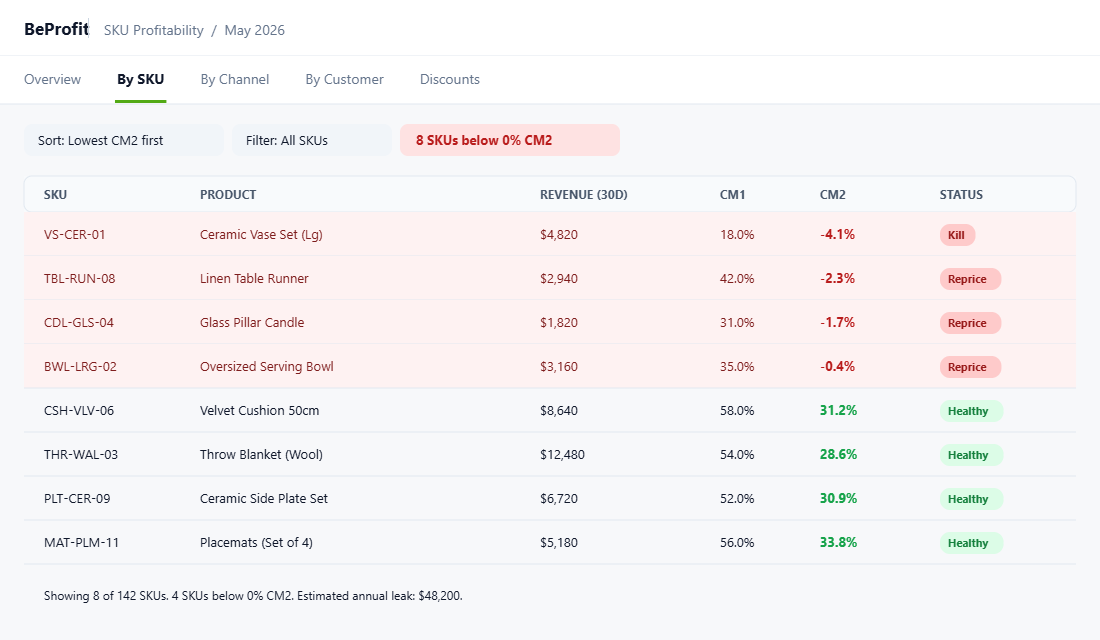
Leak 1: The negative-margin SKU
Every store has 5 to 15% of its SKUs running below 0% contribution margin once you load in all the variable costs. Often these are heavy or bulky items where shipping eats the gross profit, or loss-leader hero products that are no longer covering CAC.
A real Aussie example. A homewares brand we worked with had a ceramic vase set running at 18% gross margin but minus 4% contribution margin once you accounted for the $14 oversized shipping fee they were absorbing on every order. Killing the SKU lifted store-wide CM2 by 2.1 points and freed up warehouse space they were paying for.
The action is not always “kill the SKU”. Sometimes it is “lift the price by 10%”, sometimes it is “move shipping to flat $15 for this category”, sometimes it is “remove from paid traffic and let it survive on organic”. Run the math first, then decide.
Leak 2: The discount-dependent channel
Look at CM2 by traffic source. Most stores find that one channel (often Klaviyo flows, often Meta DPA retargeting) is delivering 30% of revenue at 15 percentage points below the store average, because it is leaning on a 20% off welcome code or an abandoned cart 15% to convert.
The fix is not to kill the channel. It is to test a 10% code or a free gift instead of the 20% discount and watch what happens to absolute contribution dollars, not conversion rate. A $300,000 channel running at 25% CM2 contributes the same dollars as a $250,000 channel running at 30%, but the second one leaves you with more brand equity and less discount conditioning on your list.
Leak 3: The shipping band miss
Most Aussie Shopify stores set their free shipping threshold at $80 or $100 because their first competitor did. The right threshold is whatever lifts AOV enough to cover the average shipping cost plus your target contribution margin on the marginal order.
Pull your average shipping cost per order, divide it by your target CM2, and that is your minimum free shipping threshold. For a store with $11 average shipping cost and a 35% CM2 target on the marginal order, the threshold should be $90 to $100 at minimum. We see $120 to $140 working harder for most categories.
The threshold is also the single biggest AOV lever you have. Aussie brand August (skincare) and Frank Body have both moved their thresholds up over time as their basket sizes have grown. Yours should too.
Leak 4: The over-discounted first purchase
First-purchase contribution margin should be break-even or slightly positive for a healthy DTC brand. If your welcome code is dragging CM2 on first orders into the minus 5 to minus 15% zone, you are paying twice. Once for the ad, once for the discount. You are only winning if LTV plays out, and most operators never go back to validate that it did.
Pull your last 90 days of first-order data and calculate CM2 by discount code. If your welcome code is the worst performer (it usually is), test a “10% off plus free gift” alternative for 30 days. The free gift carries near-zero marginal cost if it is from existing inventory and shifts conversion almost as hard as the larger discount.
The 5 Levers to Lift Contribution Margin
Once you have audited the leaks, here are the five levers in order of speed-to-impact. Run them in this order. Each one compounds on the last.
Lever 1: Re-band shipping
Lift your free shipping threshold by $20 to $30 and watch AOV move with it. We see CM2 lifts of 2 to 4 points within 30 days, with no negative impact on conversion when the threshold is communicated cleanly on the PDP and the cart drawer. The bar should appear in three places: collection cards, product page (above the add-to-cart), and the cart drawer header.
Lever 2: Bundle to spread fixed-per-order cost
Bundled orders carry the same shipping and payment cost as a single-item order but spread it over a larger basket. A $60 AOV with $11 shipping is an 18% shipping cost. A $120 AOV with the same $11 shipping is 9%. Bundles are the fastest CM2 lift you can engineer without changing pricing. The maths is unforgiving and works in your favour every time.
We have a full bundle framework that pairs cleanly with this audit. See the 6-Type Bundle Framework for the playbook.
Lever 3: Trim the discount stack
Most Aussie stores have 4 to 7 active discount codes running at once. Welcome, cart abandonment, post-purchase, VIP, BFCM legacy and a few influencer codes that should have expired two months ago. Audit your discount usage by code over the last 90 days. Kill any code doing under 1% of revenue or running on top of another code (codes that stack are how 25% off becomes 40% off without you noticing).
Lever 4: Renegotiate fulfilment and shipping
Once you hit 1,000 orders a month, you have leverage. The biggest gains we see come from renegotiating with your 3PL (5 to 12% off the rate card), switching to a cheaper carrier for the 60% of orders that are not time-sensitive, and consolidating to a single shipping protection app instead of two.
A 7% reduction in fulfilment cost on a $2m store is roughly $14,000 to $20,000 a year. The phone call takes 45 minutes. The ROI on your time is hard to beat.
Lever 5: Lift AOV with intent, not discounts
Cross-sells in the cart drawer, post-purchase upsells, free-gift thresholds that lift AOV without giving away margin. A well-tuned post-purchase upsell adds 8 to 15% to AOV at near-100% contribution margin, because there is no incremental ad cost, no shipping uplift, and the customer is already converted.
The Aussie brands doing this well (Showpo, Bondi Sands, Frank Body) all run a post-purchase one-click upsell offering a complementary product at a 10 to 15% discount. The acceptance rate is typically 6 to 12%. That is incremental revenue that costs nothing to acquire.
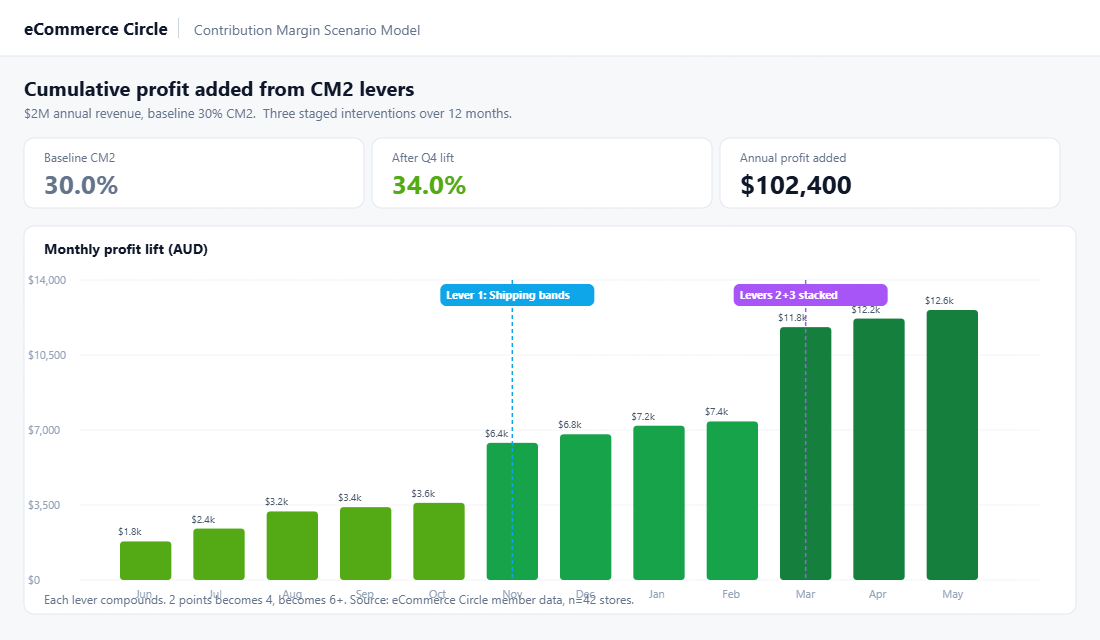
The Compound Effect: How a 2% Lift Becomes K+
The reason this audit matters more than almost anything else on your roadmap is because contribution margin compounds the way ad ROAS does not.
A $2 million per year Shopify store running at 30% CM2 throws off $600,000 to cover overheads, salaries and tax. Lift CM2 by 2 percentage points (which is the lower end of what a single audit will find) and you have added $40,000 of pure profit that did not require a single extra ad dollar or new customer.
Stack two lifts (re-banded shipping plus killed two unprofitable SKUs) and you are now at 4 points. That is $80,000 a year. Add a CAC-by-channel review that trims your worst-performing 20% of spend, and you have a $100,000+ swing without selling a single extra unit.
The reason most founders do not do this work is not because it is hard. It is because revenue is louder, more visible and easier to celebrate. A 10% revenue lift gets a Slack notification and a high five. A 2 point CM2 lift gets a quiet line item in next quarter’s P&L. But over 12 months, the CM2 lift is the one that decides whether you are paying yourself a real salary or borrowing from the line of credit again.
The Quarterly Contribution Margin Audit Checklist
Here is the checklist we run with members inside the workshop. Save it, share it with your finance person, and run it on the first Monday of every quarter.
- Pull CM1, CM2 and CM3 by month for the last 12 months. Look for the trend, not just the absolute number.
- Identify the bottom 10% of SKUs by CM2. Decide: kill, reprice, or restrict to organic traffic.
- Slice CM2 by traffic channel. Flag any channel running 10 points below store average.
- Review every active discount code. Kill anything under 1% of revenue or stacking with other codes.
- Recalculate the right free shipping threshold using current shipping costs and target CM2.
- Audit the app stack. Cancel anything you have not opened in 60 days. Consolidate duplicates.
- Review blended CAC trend by channel. If a channel has drifted up more than 15% in 90 days, reassess spend allocation.
- Compare to the right benchmark. CM3 above 20% is healthy. Below 15% is the warning line.
Quarterly is the minimum. Monthly is better. The numbers move every time you launch a new ad campaign, run a sale, or onboard a new SKU. Pair this audit with the 8-week cash flow forecast and you will see margin problems coming before they hit the bank account.
Inside the More Orders Operating System, we treat the contribution margin review as one of four mandatory monthly rituals, alongside cash flow forecast, marketing performance review and customer retention scorecard. The founders who run it consistently are the ones who scale past $5m and still take a paycheck.
Inside eCommerce Circle, contribution margin is one of the core pillars we work on with every member. If you want a second opinion on yours, let’s talk.