Your Meta Pixel is lying to you. By somewhere between 40 and 60%, depending on how much of your traffic is iPhone. That is not a small reporting variance. That is half your attribution gone, and most Aussie founders are still making seven-figure budget decisions on the half that remains.
What’s in This Article
Apple’s App Tracking Transparency rollout in iOS 14.5 cracked the foundation. Roughly 85% of iOS users opted out of cross-app tracking the moment that pop-up appeared. Then iOS 17 introduced Link Tracking Protection, which strips the fbclid parameter Meta uses to connect a click to a conversion. iOS 18 widened that protection further. The Pixel that used to capture 85 to 90% of your conversions now captures 40 to 60% in most accounts. Your dashboard looks the same. The number it shows is half a story.
Most operators respond by chasing better pixel setups. Conversions API. Server-side tracking. Enhanced match keys. All of it helps at the margin, but none of it solves the underlying problem: a meaningful chunk of your customers arrive through channels no pixel can ever see. Word of mouth, group chats, podcasts heard in the car, a screenshot someone sent on WhatsApp. Private sharing is estimated to drive up to 69% of social referral traffic, and dark social as a whole accounts for around 84% of online sharing activity. That is the iceberg your reporting tools cannot map.
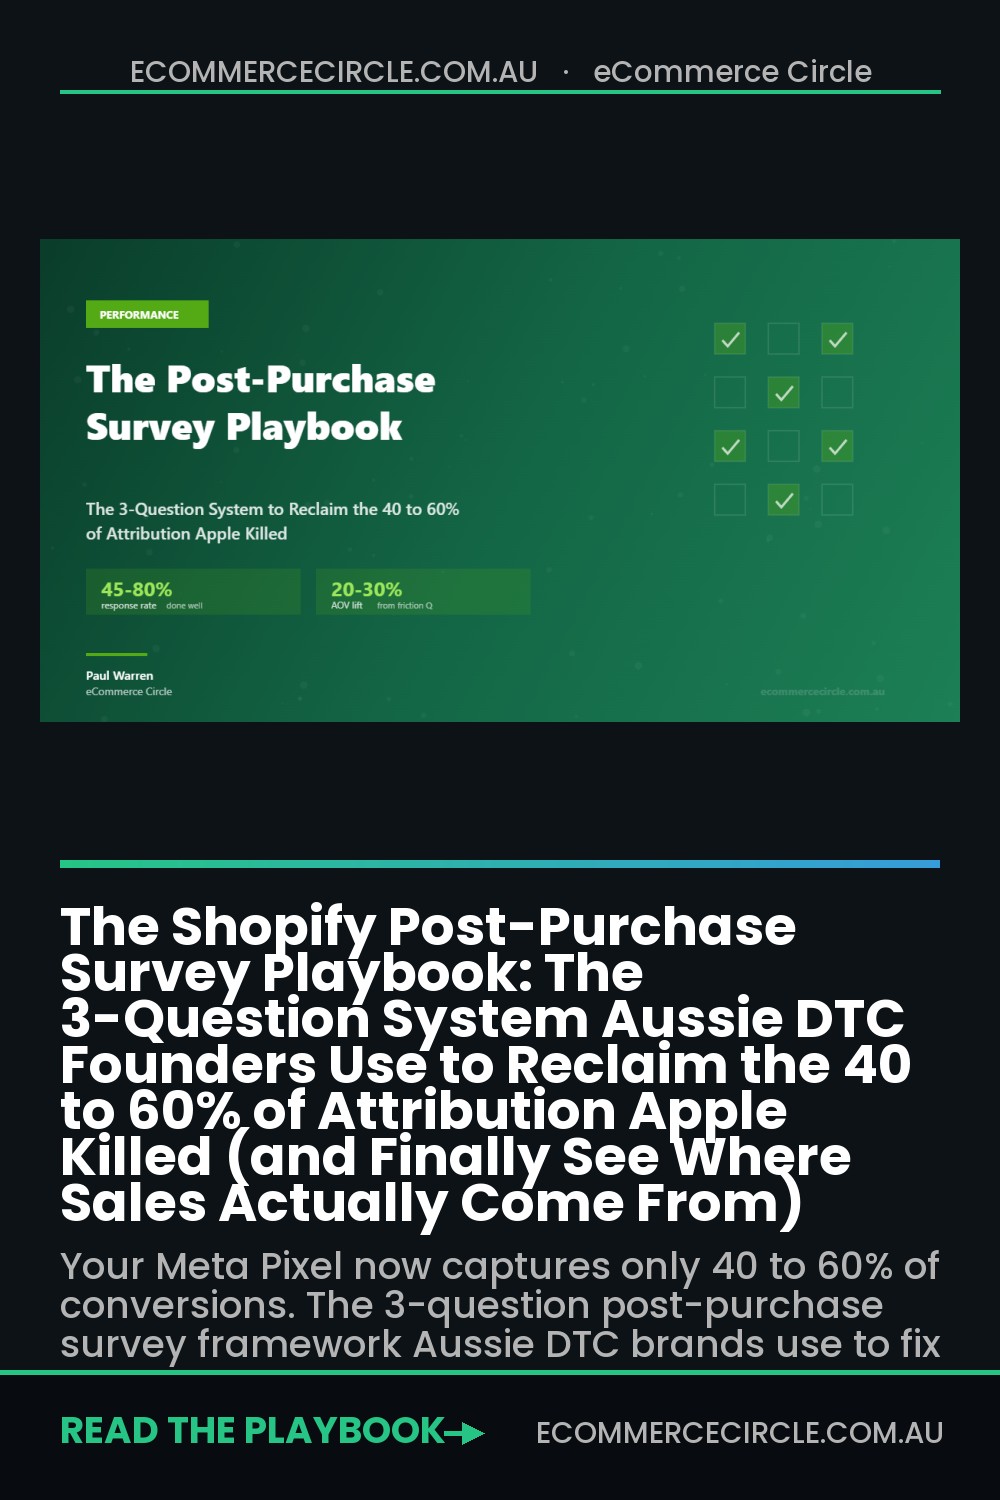
The brands that scale cleanly past $1m AUD a year in this environment have stopped pretending the pixel is enough. They have added a second source of truth that runs in parallel: a 3-question post-purchase survey that asks the customer directly. Done right, it gives you a 45 to 80% response rate (KnoCommerce reports 45% average, Fairing reports 40 to 80% across 3,000 plus DTC brands), and it surfaces the channels, the friction, and the buying triggers your analytics will never reveal. This playbook is the exact 3-question framework we use with members of eCommerce Circle.
Why Multi-Touch Attribution Will Never Fully Recover
Before we get into the questions, you need to understand why this problem is structural, not technical. A lot of agencies are still selling the dream that the next attribution platform will solve it. It will not. Here is the math.
Around 60% of your Aussie ecommerce traffic comes from iOS devices, depending on your category (fashion, beauty, and lifestyle skew higher; tech and gaming skew lower). Of those iOS users, roughly 85% have opted out of cross-app tracking. That alone removes about half of all iOS conversions from your Meta Pixel reporting. Then add iOS 17 and 18 link tracking protection stripping click identifiers in Safari, which removes another slice. Then add browser-level extensions like Brave, Firefox Enhanced Tracking, and Chrome’s third-party cookie deprecation rolling forward. The Pixel was built for an internet that no longer exists.
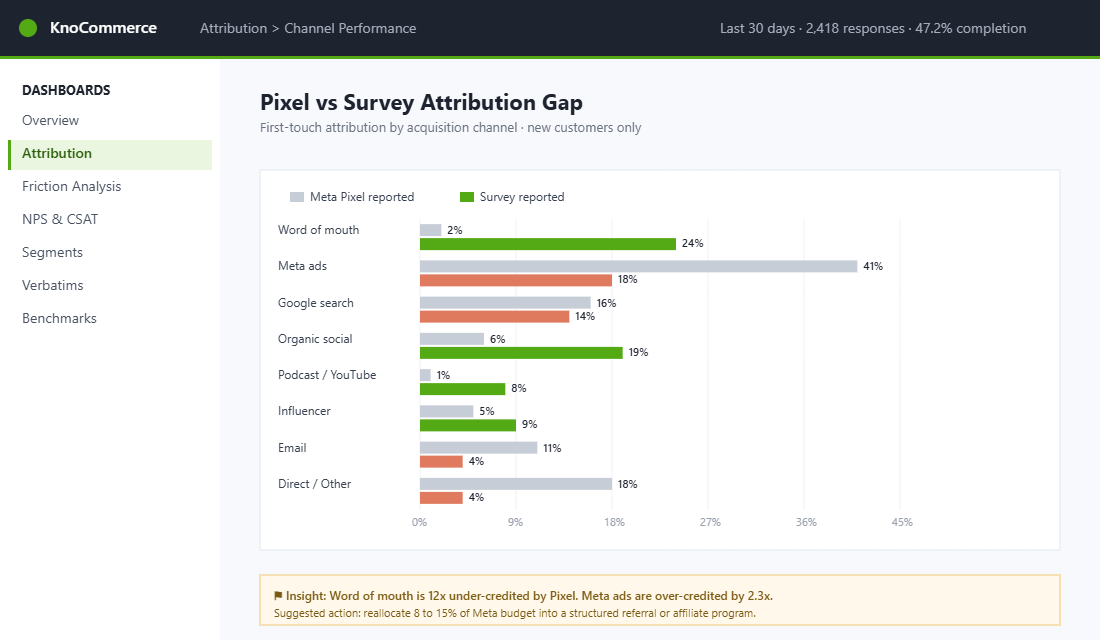
This matters because the gap between what your Pixel reports and what is actually happening is not random. It is biased. Channels that rely on click identifiers (Meta, Google paid) under-report. Channels that bypass click identifiers entirely (word of mouth, podcast, organic social, retail) report nothing at all and get bucketed under “direct” or “organic” in your analytics. Salesforce found that 70% of marketers struggle to track the full customer journey, and the reason is mathematical, not configurational.
The post-purchase survey works because it bypasses the entire tracking stack. You are not measuring clicks. You are asking the only person who actually knows. That answer is imperfect (people forget, people guess, people credit the last touch they remember rather than the first), but it is structurally different from pixel data. When you triangulate the two, the truth lives in the overlap. For the full picture of how this plugs into your broader measurement stack, our deeper dive on ecommerce marketing attribution covers the multi-touch foundations.
The 3-Question Framework (Why Less Is Always More)
Here is the rule that decides whether your survey works or wastes everyone’s time: a focused 2-question survey can hit a 50% completion rate. A 20-question survey struggles to clear 1%. Every additional question you add is a tax on your response rate, and below about 30%, your sample size stops being statistically useful for the volumes most Aussie DTC brands run.
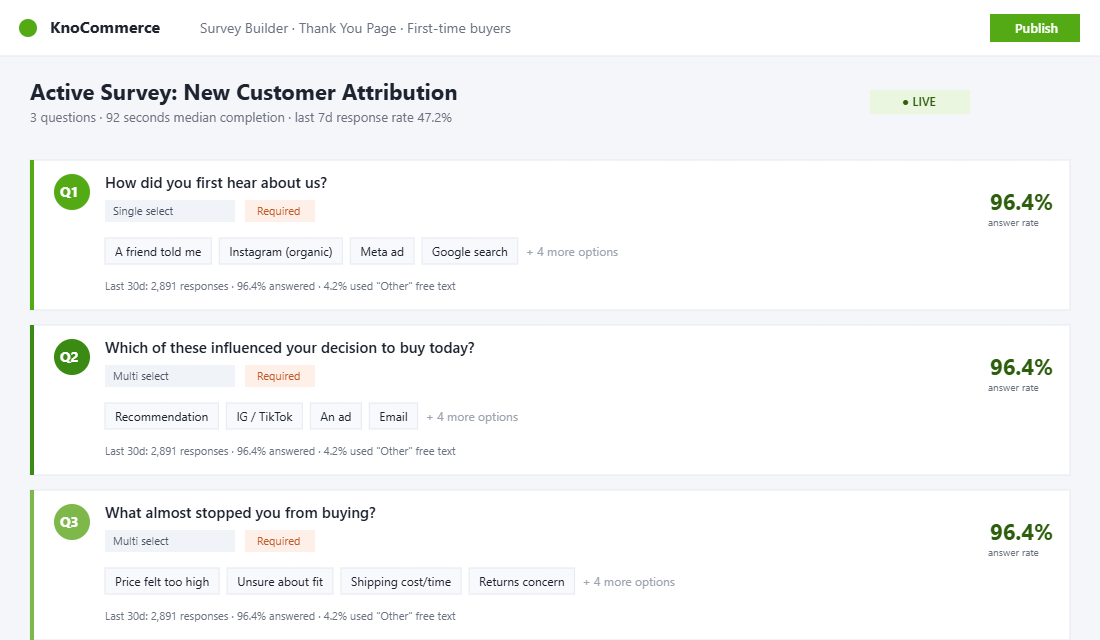
The 3-question framework hits the sweet spot. You get enough signal to triangulate three completely different decisions (where to invest, what to fix, what to amplify), and you keep the response rate north of 40%. Here is the structure:
- Question 1: How did you first hear about us? (HDYHAU). The attribution spark. Answers the strategic budget question.
- Question 2: Which of these influenced your decision to buy today? (Influence). The channel mix. Answers the tactical media-mix question.
- Question 3: What almost stopped you from buying? (Friction). The CRO goldmine. Answers the conversion-rate question.
Three questions. Three completely different decisions they feed. Together they replace half the dashboards most founders are paying for. Let me walk you through each one.
Question 1: “How Did You First Hear About Us?” (The Attribution Spark)
This is the famous HDYHAU question, and it has earned its own acronym for a reason. It is the single most important question in DTC measurement right now, because it captures the one thing no pixel can: the first time the customer became aware your brand existed. Meta will gladly take credit for closing the sale even when an Instagram Reel three weeks ago, shared by a friend, did the actual work. HDYHAU surfaces that.
Format it as a multiple choice, single select. Show 6 to 8 options maximum, with an “Other” free-text fallback. Order matters: put the channels you most want clean data on at the top, because there is a small primacy bias. Here is the option set that works for most Aussie DTC brands:
- A friend or family member told me. Word-of-mouth proxy. Often the largest single answer.
- Instagram or TikTok (organic, not an ad). Separate from paid social so you can read both.
- Meta or Instagram ad. The paid social bucket.
- Google search. Catches branded and non-branded search together.
- YouTube or podcast. The long-tail awareness bucket most founders under-invest in.
- Influencer or creator. Critical to separate from organic social if you run a creator program.
- Saw the brand in store or at an event. Aussie retail and pop-up presence shows up here.
- Other (please tell us). Free text. Read these weekly. The real gold lives here.
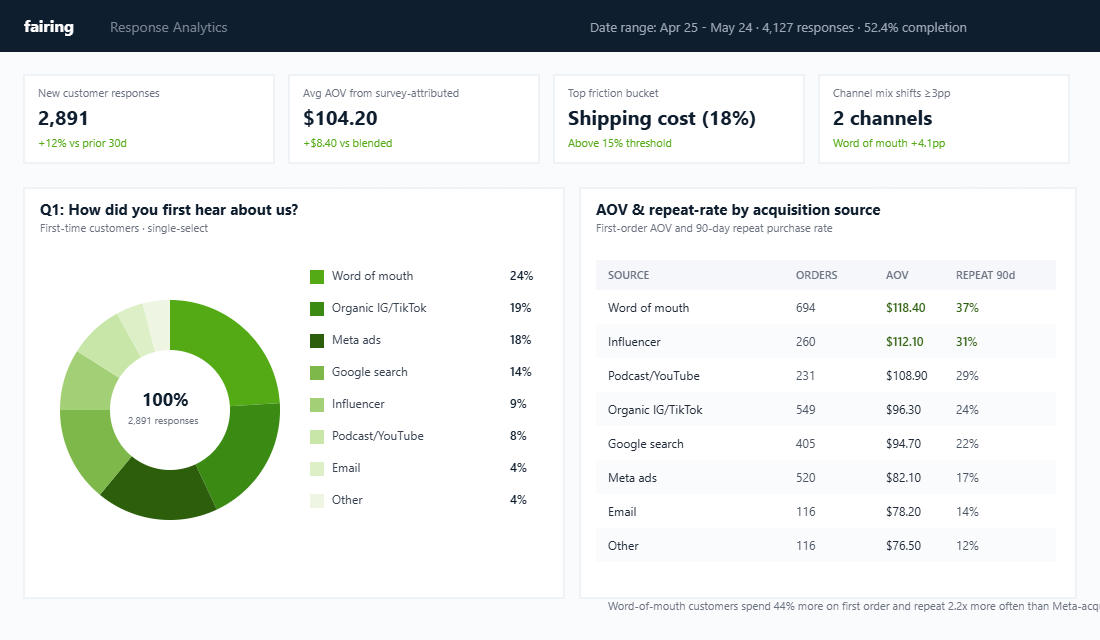
What you do with the data is more important than the data itself. Look at the percentage of first-time customers who answered each option. Then compare it to the percentage of your ad spend going to each corresponding channel. The gap is your reallocation signal. The classic finding for Aussie brands at the $50k to $200k a month range: word of mouth shows up as 18 to 28% of new customers, while the brand is spending 0% intentionally on referral or community programs. That is the most expensive blind spot in DTC.
Olipop, the US prebiotic soda brand often referenced as a best-in-class survey user, used this exact question to discover their top customer acquisition driver had shifted from paid social to retail. The data told them to stop pouring more into Meta and start funding the in-store experience. True Classic uses post-purchase survey data as a primary input to their media-mix modelling. These are not edge cases. They are how mature DTC brands now make decisions.
Question 2: “Which of These Influenced Your Decision to Buy Today?” (Channel Stacking Reality)
Question 1 captures the spark. Question 2 captures the journey. This one is multi-select, and that is intentional. Customers rarely buy on a single touch. They see a friend’s Instagram post, then a Meta ad, then a Google search to check reviews, then a TikTok creator using it, then your email three days later. Multi-select reveals the stacking. It tells you which channels work in combination, not which one “won” the conversion.
Use a similar option list to Question 1 but reframed for influence rather than first-discovery:
- Recommendation from someone I trust.
- Seeing the product on Instagram or TikTok.
- An ad I saw on Meta, TikTok or YouTube.
- An email from your brand.
- Reviews or ratings I read online.
- An influencer or creator I follow.
- A discount or promotion.
- I have purchased from you before.
This is where it gets interesting for repeat customers, who you can segment out separately. For first-time buyers, the stacking pattern usually reveals which channels do the heavy lifting at consideration (reviews, organic social, influencer) versus which channels close the deal (ads, email, discount). When you see “Reviews or ratings” showing up in 35 to 50% of responses, that is your signal to invest in conversion rate optimisation through review density, not more cold traffic.
The other thing this question quietly does: it gives you the language your customers use to describe your brand. The free-text “Other” answers, the way they phrase the influence, all of it feeds back into ad copy, product page copy, and email subject lines. We have seen brands lift Meta ad CTR by 18 to 25% just by rewriting headlines using verbatim customer language from this question.
Question 3: “What Almost Stopped You From Buying?” (The CRO Goldmine)
This is the question most brands skip, and the reason is psychological: nobody wants to hear the answer. It is also, statistically, the most valuable question in the survey. The data point that sells it: only about 15% of merchants actively ask this. The brands that do, and that act on the answers, see 20 to 30% AOV uplift over twelve months. That is not a CRO test result. That is a structural change in how your customers feel about checking out.
Format it as multiple choice with a free-text “Other” option, just like Question 1. The option set:
- The price felt too high. The pricing perception bucket.
- I was not sure about the size, fit or specs. The product clarity bucket.
- I was worried about shipping cost or delivery time. The fulfilment bucket. Huge in Australia.
- I was unsure about returns or guarantee. The risk-reversal bucket.
- I could not find enough reviews or proof. The social proof bucket.
- The checkout felt slow or confusing. The UX bucket.
- Nothing, I bought without hesitation. Crucially, give them this option so you can baseline the friction-free customer.
- Something else (please tell us).
The interpretation rule: when any single friction bucket exceeds 15% of responses, you have a structural problem worth a quarter of CRO work to fix. Below 10%, it is noise. Between 10 and 15%, it is a watch-list. Above 15%, it is the next thing on your roadmap.
Real Aussie example. A homewares brand we worked with was running 2.1% conversion on cold Meta traffic. The Pixel was telling them ad fatigue. The post-purchase survey told them 22% of buyers had hesitated because of shipping cost. They had been hiding a $14.95 flat-rate shipping line until checkout. We moved the free-shipping threshold to $89 (their previous AOV was $76), surfaced “Free shipping over $89” sitewide, and the conversion rate moved to 2.9% over six weeks. AOV climbed from $76 to $94. That is not a CRO test. That is a survey question doing the job dashboards could not. For the full mechanics of how to set those thresholds without bleeding margin, our free shipping threshold playbook walks through the math.
Tool Setup: KnoCommerce vs Fairing (and the One-Time Settings That Matter)
You have two serious options on Shopify. There are cheaper apps, and they are fine for a single-question NPS poll, but for the full 3-question framework with proper benchmarking and AOV segmentation, KnoCommerce and Fairing are the two we recommend.
- KnoCommerce. Reports a 45% average response rate across its network. Has the broadest question-type library (12 types) and the best industry benchmarking, which lets you compare your channel mix against similar Aussie DTC brands. Pricing tiers start affordable for sub-$50k a month brands. Best choice if you are starting from scratch and want a guided setup.
- Fairing. Used by 3,000 plus DTC brands and 2,000 plus Shopify Plus brands. Reports 40 to 80% response rates. Stronger on integrations with Klaviyo, Triple Whale, and Northbeam if you are already running a heavier measurement stack. Best choice if you are above $200k a month and already have an attribution platform you want to feed.
Either way, the one-time settings that decide whether your survey works or fails:
- Show the survey on the Thank You page, not the Order Status page. The Thank You page has the highest engagement window. Order Status is checked days later when memory of the journey has decayed.
- Limit to 3 questions, full stop. Resist the urge to add a fourth. Every additional question costs you roughly 8 to 12 percentage points of completion rate.
- Make the first question single-select. Multi-select on Question 1 ruins your HDYHAU clarity. Save multi-select for Question 2.
- Always include an “Other (please tell us)” free-text option. The verbatim quotes are worth more than the percentages.
- Set the display rule to first-time customers only for the first month. Get the new-customer baseline clean before you start surveying repeat buyers.
- Pipe survey data into your Klaviyo profiles as custom properties. Now you can build flows like “send a referral incentive to anyone who said ‘A friend told me'”.
Setup time, end to end, is about 90 minutes. That includes installing the app, drafting your three questions, configuring the display rules, and wiring up the Klaviyo property sync. Compared to the months you have spent fighting your Pixel for clean data, it is the cheapest measurement infrastructure investment in your stack.
The Weekly 15-Minute Review (and the Sample Size Rule)
Surveys generate data that nobody reads, which is the leading cause of survey programs being quietly abandoned six months in. The fix is a fixed weekly cadence. Block 15 minutes every Monday morning. Same time, same notebook, same three things to look at:
- HDYHAU shifts week on week. Is any channel rising or falling more than 3 percentage points over a 4-week rolling average? That is a signal worth investigating.
- Friction bucket above 15%. If any answer to Question 3 has crossed the threshold this week, it goes to your CRO backlog by Friday.
- Five “Other” free-text answers. Read five. That is all. The patterns that matter will appear inside ten weeks.
Sample size matters and most founders get this wrong. The rough rule for a single-select question like HDYHAU: you need around 100 responses before any individual channel percentage is stable enough to act on. For multi-select questions like Question 2 and 3, you need closer to 200. If you are doing 500 orders a month and your survey hits a 45% response rate, you are getting around 225 responses a month, which means you can act on HDYHAU weekly and on the other two monthly. If you are doing 100 orders a month, look at the data quarterly, not weekly, or you will chase noise.
The other discipline is to never read a single response in isolation. One customer saying “your shipping is too expensive” is data. Eighteen customers saying it across a month is a decision. The whole point of survey infrastructure is to convert anecdote into evidence with a sample size you can defend.
Three Decisions Survey Data Should Drive Every Quarter
Survey data that does not change a decision is a vanity metric. Here are the three decisions the framework should drive every single quarter. If it is not driving these, you have a configuration problem, not a data problem.
- Decision 1: Channel reallocation. Quarterly, compare HDYHAU percentages against ad-spend percentages. Where the survey says “20% of customers heard from a friend” and your referral spend is 0%, that is a budget reallocation. We routinely see Aussie brands move 8 to 15% of their Meta spend into a structured referral or affiliate program after the first quarter of survey data.
- Decision 2: CRO roadmap. Quarterly, take the top two friction buckets from Question 3 and build them into your CRO test backlog. If “I was not sure about the size or fit” is 19% of responses, the next two quarters of CRO work needs to include a sizing guide, fit-finder, and on-PDP measurement video.
- Decision 3: Email and ad copy refresh. Quarterly, pull all the free-text “Other” responses and the influence-question verbatims. Use them to rewrite three Meta ad headlines and three Klaviyo subject lines. The lift from customer-language copy is consistently 12 to 25%.
Three decisions, four times a year. That is twelve material changes to your business per year, all driven by data the Pixel cannot give you. None of them require a CRO agency, a data scientist, or a new attribution platform.
Worked Example: What a Two-Million-Dollar Aussie Skincare Brand Found in 90 Days of Survey Data
Imagine you run a Melbourne skincare brand doing $200K a month, spending $45K of it on Meta and Google. Your ad platforms say Meta drove 62% of last-click revenue. Ninety days of post-purchase survey responses, with a 38% response rate on roughly 2,100 orders, tell a very different story.
- Meta: 34% of “first heard” answers, not 62%. Meta was doing the heavy lifting on introduction, but Google Brand and direct were harvesting most of the last click it claimed.
- Podcast and creator mentions: 17%, against roughly 2% in GA4. That is the classic dark-social gap, and it was the single biggest surprise for the founder.
- Friend or family recommendation: 14%. A referral program existed but had never been promoted because nobody knew referrals were already a top-three channel.
- “What almost stopped you?”: shipping cost (31%) and unsure about skin type match (24%). Two objections accounting for more than half the hesitation, both fixable on the product page.
The decisions that followed were simple. Creator spend went from $3K to $9K a month, a free-shipping threshold at $85 replaced flat $9.95 shipping (AOV rose 11% inside six weeks), and a two-question skin-type quiz went on the top four product pages. Blended CAC dropped from $38 to $29 over the following quarter. None of it needed a new attribution tool. It needed three questions and a spreadsheet.
Five Benchmarks to Judge Your Own Survey Program Against
Once your survey has been live for a full month, hold it against these numbers. They are drawn from what we see across Aussie DTC brands using KnoCommerce, Fairing and Zigpoll, and they tell you quickly whether the data is worth trusting.
- Response rate: 30 to 50% on the thank-you page is healthy. Under 20% usually means the survey is loading below the fold or after the order status page has already refreshed.
- Minimum sample before acting: 200 responses per channel decision, or four weeks of data, whichever comes second. Below that, one influencer post can swing a channel by 10 points.
- “Other” answers: should sit under 8% of responses. Above that, your answer list is missing a channel and you are throwing away signal. Read the free-text every week for the first two months.
- Survey-to-platform gap: expect Meta to be over-credited by 15 to 30 points on last-click and under-credited by 5 to 15 points on view-through. If your gap is wildly outside that range, check your pixel and Conversions API setup before you re-budget anything.
- Time to first budget decision: the brands that get value from this make one spend change inside the first 45 days. If you are three months in and have changed nothing, the survey is a report, not a system.
If you want the survey data to reconcile against something more rigorous than a platform dashboard, pair it with a clean UTM tracking structure so the “how did you hear” answer and the GA4 session source can be compared order by order. And once the numbers settle, fold the top three channels into your one-page monthly business review so survey share sits next to spend share every month, where the gap is impossible to ignore.
The Compound Effect: Why This Replaces Half Your Reporting Stack
Here is the part most founders do not see until they have run this for a quarter. The 3-question survey is not just an attribution tool. It is the central source of truth for three completely different functions: media planning, CRO, and creative. When you have a stable, weekly stream of HDYHAU, influence, and friction data, you can stop subscribing to half the dashboards you currently pay for.
You no longer need a multi-touch attribution platform to tell you that Meta is over-credited. The survey tells you. You no longer need an expensive CRO agency to identify the next test. The friction question tells you. You no longer need a creative strategist to give you ad-copy angles. The verbatim quotes give them to you, in your customer’s own words. The compound effect is that one $200 a month app replaces around $2,000 a month of tooling and consulting, and the data is closer to the truth.
The brands that are quietly winning in 2026 are not the ones with the most sophisticated attribution stack. They are the ones that figured out the Pixel is broken, accepted that no technical fix will ever fully repair it, and built a parallel measurement system anchored on the customer telling them directly. That is the play. Three questions, 45 to 80% response rate, weekly review, quarterly decisions. If you only build one new piece of measurement infrastructure this quarter, build this.
Your Implementation Checklist (This Week)
- Day 1. Install KnoCommerce or Fairing on Shopify. Pick based on revenue band (under $200k a month, Kno; above, Fairing).
- Day 2. Draft the three questions exactly as outlined above. Resist adding a fourth. Get a second pair of eyes on the option set.
- Day 3. Configure display rules: Thank You page, first-time customers only for the first month.
- Day 4. Wire the survey responses into Klaviyo as profile properties. Set up one flow: “if HDYHAU answer is ‘a friend told me’, send referral incentive on Day 7 post-purchase”.
- Day 5. Add the weekly Monday 15-minute review block to your calendar. Recurring. Non-negotiable.
- Day 30. First monthly review. Read 20 free-text “Other” responses. Identify your first friction bucket above 15%. Add to your CRO backlog.
- Day 90. First quarterly review. Reallocate ad spend based on the HDYHAU vs spend-percentage gap. Refresh ad headlines using verbatim customer language.
That is a 90-day program with no agency required, no new ad budget required, and no Pixel configuration required. The output: an attribution view that is closer to the truth than anything in your current dashboard, a CRO roadmap based on what is actually losing you sales, and ad creative built from your customers’ own words. The compound effect of those three over 12 months is what separates the Aussie brands that scale cleanly from the ones that hit a wall at $1m a year and cannot work out why their cost per acquisition keeps climbing.
Inside eCommerce Circle, post-purchase survey infrastructure is one of the core measurement pillars we work on with every member, sitting under the Performance P of the More Orders Operating System alongside dashboards, attribution and CRO. If you want a second opinion on your survey setup or the decisions you should be making from the data, let’s talk.