Here is the conversation I have with a founder almost every week. They tell me revenue is up 40% on last year. They are pumped. Then I ask one question: how much profit did you actually keep on the last order you shipped? Silence. They know revenue to the dollar and they have no idea what the order underneath it was worth.
What’s in This Article
This is the single most expensive blind spot in Australian ecommerce. The median direct-to-consumer brand keeps just 3 to 10% as net profit after every cost is paid. So a store doing $2m a year is often fighting over a $100k to $200k sliver, and most founders are managing the $2m number instead of the sliver. You can double revenue and go backwards at the same time. It happens constantly.
The fix is one number most operators never calculate properly: contribution margin. It is the profit left on an order after every variable cost, before your fixed overheads. Get it right and you can see exactly which products carry the business, which ones are quietly bleeding you, and how hard you can push on ads without scaling into a loss. Get it wrong, or never look, and you are flying a plane with the fuel gauge taped over.
This is the playbook we run with members to find their real per-order profit. Five steps, plain numbers, no accounting degree required.
First, Three Numbers Everyone Treats As One
Most founders use “margin” to mean one fuzzy thing. There are actually three, and they answer completely different questions.
- Gross margin. Revenue minus the cost of the goods themselves. The median Aussie and global DTC brand sits around 57% gross. This number feels great and tells you almost nothing about whether you make money.
- Contribution margin. Gross profit minus every other variable cost tied to fulfilling that order: shipping, payment fees, pick and pack, returns. This is the number that decides if you can scale.
- Net margin. Contribution margin minus fixed overheads like rent, salaries, software and your own wage. This is what you actually take home.
The trap is living at the top of that list. A 60% gross margin product can have a 5% contribution margin once the bulky-parcel shipping and the 25% return rate are paid for. The gross number told you it was a winner. The contribution number tells you the truth. Everything in this playbook is about getting you to that middle number, because it is the one almost nobody calculates and the one that runs the whole business.
Step 1: Map Your Four Profit Layers Once
Before you touch a single product, build the skeleton. On one page, list the four layers in order and the costs that sit in each. You are creating the map every order will flow through.
- Layer 1, Revenue. The price the customer actually paid, after any discount code. Not RRP. Not the price before the 15% welcome offer. The real cash that landed.
- Layer 2, Gross profit. Revenue minus landed cost of goods. Landed means the product plus inbound freight plus import duty plus any per-unit packaging, not just the supplier invoice.
- Layer 3, Contribution margin. Gross profit minus outbound shipping cost, payment processing fees, pick and pack labour, and a returns reserve.
- Layer 4, Net profit. Contribution margin minus marketing spend allocated to that order, then minus your fixed monthly overheads spread across orders.
The discipline here is refusing to skip a layer. Founders love to jump from revenue straight to “we made about 50%”. That 50% is gross margin and it is hiding the three deductions that actually sink brands. Do this map once and every product calculation afterwards takes minutes.
Step 2: Catch the Costs That Hide Between Revenue and Margin
This is where the money leaks. Most founders know their cost of goods. Almost none of them have honestly added up the four costs that live between gross profit and contribution margin. Here is where to look.
- Shipping cost, not shipping charged. What you pay the carrier, after the customer’s contribution. If you offer free shipping over a threshold, you are eating the full parcel cost on a chunk of orders. Bulky or heavy products are where this quietly destroys contribution margin.
- Payment fees. Standard processing runs around 2.9% plus 30 cents per transaction. On a $60 order that is roughly $2.04. It feels trivial until you multiply it across every order for a year.
- Returns. The average ecommerce return rate hit around 20% in 2025, and apparel runs 20 to 40%. Processing a single return can cost 20 to 65% of the product’s original price once you count return freight, inspection and restocking. The brutal maths: a 25% return rate can cut your unit contribution margin by roughly 70%, not 25%.
- Pick, pack and the small stuff. Warehouse labour, the mailer, the tissue, the thank-you card, the gift-with-purchase. Two or three dollars an order that never makes it into anyone’s spreadsheet.
Add a returns reserve even on products that are not returned today. A simple way: take your category return rate, multiply by the full cost of handling one return, and bake that as a per-order line on every product. It stops a rising return rate from ambushing you six months from now. If returns are a real problem for you, fixing the policy itself is the other half of this job, and we cover that in the Shopify Returns and Exchanges Playbook.
Step 3: Calculate Contribution Margin Per Order and Per Product
Now the actual sum. For one order it is dead simple:
Contribution margin = price paid – landed COGS – shipping cost – payment fee – pick and pack – returns reserve.
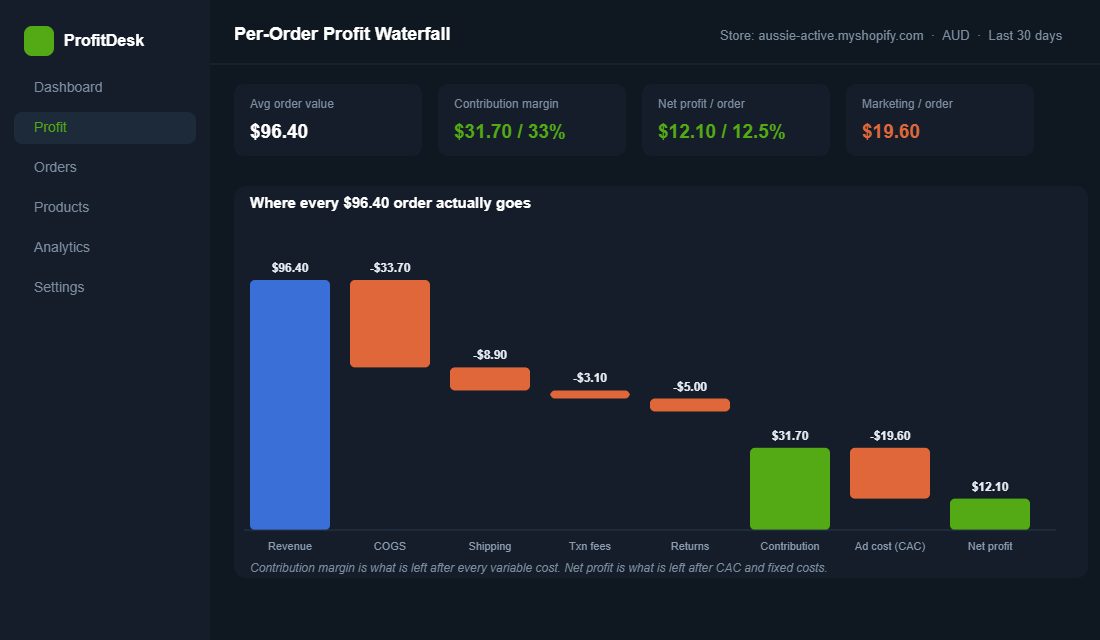
Worked example on a real-looking order. A $96.40 cart. Landed cost of goods $33.70. Shipping cost to you $8.90. Payment fee $3.10. Returns reserve $5.00. That leaves a contribution margin of around $31.70, or about 33%. Healthy. Now you know that this order can afford up to roughly $31 of advertising before it stops contributing to your overheads and profit. That is the number that should set your ad bids, not a gut feel.
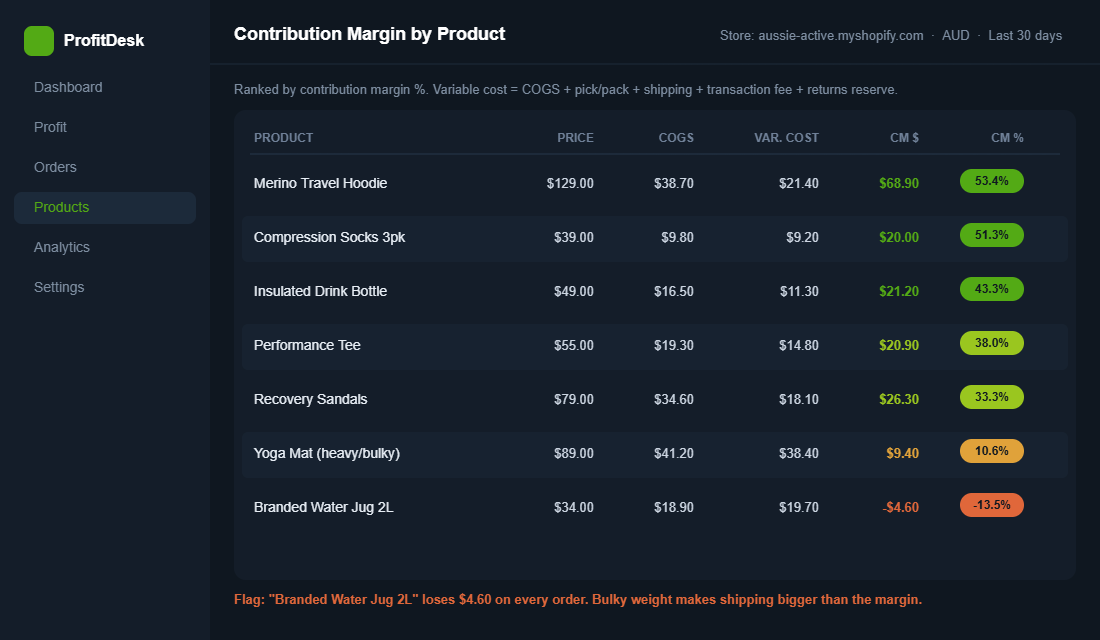
Then run the same sum for every SKU and rank them, highest contribution margin to lowest. This single ranked list is the most useful page in your business. It will show you three things instantly: the heroes that deserve more ad spend and homepage real estate, the middle performers that fund the lights, and the SKUs sitting at single-digit or negative contribution margin that you have been proudly promoting. We almost always find at least one product that is genuinely losing money on every sale, usually something bulky where shipping eats the lot.
This is also where pricing decisions get easy. When you can see exactly what a product contributes, a price rise stops being scary and becomes arithmetic. If contribution margin is too thin, you have three levers: lift the price, cut the landed cost, or reduce the variable cost of fulfilling it. We go deep on the first lever in the Shopify Pricing Strategy Playbook.
Step 4: Set Your Floor and Tie It to Customer Acquisition
A number with no line in the sand is just trivia. So set a floor. The benchmark that separates brands that scale from brands that scale into bankruptcy is a contribution margin after acquisition cost of at least 20%. Below 15% at any real revenue, you do not have a scale problem, you have a unit economics problem, and growing faster just produces bigger losses.
Here is why the floor matters more every year. Ad costs are not standing still. CPMs across most verticals rose 15 to 22% in 2025, which means the slice of contribution margin that acquisition eats keeps growing unless your margin grows too. The single most common reason a brand quietly slides into losses is that customer acquisition cost creeps up while contribution margin stays flat. Both numbers have to move, not just one.
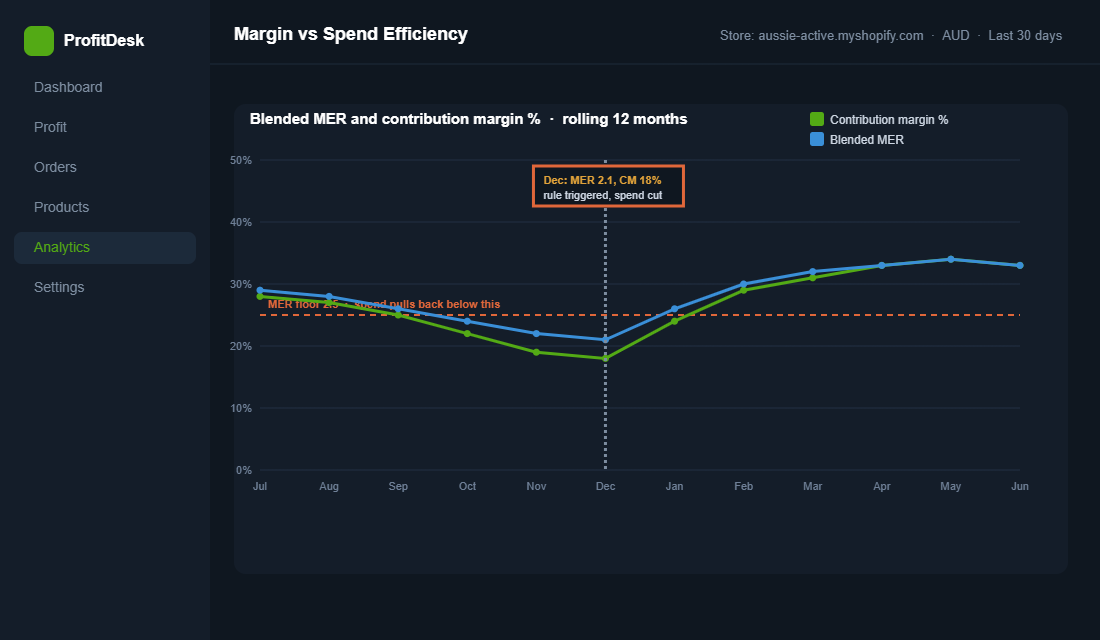
An Australian wellness brand we admire ran this exact discipline. With a 68% gross margin, they wanted to push ad spend hard. Instead of guessing, they modelled contribution margin at the higher spend and set a hard rule: if blended marketing efficiency dropped below 2.5 for three months straight, spend pulled back automatically. They hit $9m in revenue 18 months later, with contribution margin settling around 21%, almost exactly where the model said it would. The trigger mattered more than the spend level. That is what a floor does.
Step 5: Run the Store Off the Number
Calculating contribution margin is worthless if it lives in a spreadsheet you open once a quarter. The point is to make decisions with it, weekly. Four ways it should change what you do.
- Decide what to scale. Push ad budget and homepage space toward your highest contribution-margin products, not your highest-revenue ones. Revenue heroes with thin margins are a trap. July, the Australian luggage brand, sells direct only and stays in the $250 to $400 band precisely to protect margin while it scales, and it was profitable within six months of launching in the US.
- Decide what to fix or kill. Any SKU under your floor gets one of three treatments: reprice it, re-source it cheaper, or retire it. A bulky product losing money on shipping might need a flat-rate freight charge or a bundle that lifts the cart above your free-shipping threshold.
- Set your acquisition ceiling. Your contribution margin per order is the maximum you can spend to acquire that order and still break even on order one. Brands like Who Gives A Crap can pay more to acquire because a premium price and a subscription protect contribution margin over many orders, not just the first.
- Bundle and lift the cart. Raising average order value spreads your fixed per-order costs (shipping, the payment fee, the mailer) across more revenue, which lifts contribution margin without touching price. This is exactly why a smart free-shipping threshold works, and we break down the maths in the Shopify Free Shipping Threshold Playbook.
The Tool: Get TrueProfit Doing the Maths Automatically
You can run this in a spreadsheet, and you should at least once to feel the numbers. But to keep it live, a profit-tracking app pays for itself fast. TrueProfit is the one most of our members land on. It pulls revenue, cost of goods, ad spend, shipping and fees into a single real-time net-profit view. Setup is genuinely quick, usually 5 to 30 minutes depending on how messy your costs are.
- Install and connect. Add TrueProfit from the Shopify App Store. It auto-syncs orders, revenue and Shopify Payments fees on install.
- Plug in ad accounts. Connect Meta, Google and TikTok ads so acquisition cost flows into every order automatically. This is what turns gross numbers into real contribution and net margin.
- Load your COGS. Sync landed cost per variant from Shopify, a fulfilment platform, or upload it. Be honest and use landed cost, not the supplier invoice.
- Define shipping and custom costs. Set shipping cost by weight, quantity or destination, or connect a carrier to sync it. Add the pick-and-pack and packaging costs as custom expenses so nothing hides.
- Watch margin per order and per product. Once it is running, your contribution and net margin update on autopilot, and you can finally rank SKUs without rebuilding a spreadsheet each month.
The Compound Effect: Why This One Number Changes Everything
Here is what happens when contribution margin becomes the number you manage. Your ad spend gets sharper, because you bid against real per-order economics instead of a blended ROAS guess. Your product range gets healthier, because the loss-makers get fixed or cut and the heroes get fed. Your pricing gets braver, because you can see the headroom. And your stress drops, because you finally know which orders are worth chasing.
The pieces reinforce each other. Better product mix lifts blended contribution margin, which raises your acquisition ceiling, which lets you outbid competitors for the same customer while still keeping profit, which funds better products. That is the flywheel. It all starts with refusing to confuse gross margin with the truth. Revenue is vanity, gross margin is comfort, contribution margin is the number that pays your mortgage.
Your Contribution Margin Worksheet
Steal this. Work through it for your top 10 products this week.
- Average price paid per order for the product, after discounts.
- Minus landed COGS (product + inbound freight + duty + per-unit packaging).
- Minus shipping cost you actually pay the carrier, net of what the customer pays.
- Minus payment fee (around 2.9% + 30c).
- Minus pick, pack and inserts.
- Minus returns reserve (category return rate x cost to handle one return).
- = Contribution margin in dollars and as a % of price.
- Compare to your floor. Under 20% after acquisition, flag it. Under 15%, fix it now.
- Set the acquisition ceiling for each product = its contribution margin in dollars.
- Decide the action: scale, reprice, re-source, bundle or retire.
Do that and you will know more about your real profitability than most founders doing ten times your revenue. The number was always there. You just had to go and find it.
Inside eCommerce Circle, contribution margin is one of the core pillars we work on with every member, because it quietly decides whether all the marketing effort actually turns into money you keep. If you want a second opinion on yours, let’s talk.